


Abstract
In Parkinson’s disease oxidative stress and calcium-induced excitotoxicity have been considered important mechanisms leading to cell death for decades, but the factors that make some neurons vulnerable to neurodegeneration while others remain resistant are not fully understood. Studies of the disorder in animal models suggest that the voltage-gated calcium channel subtype CaV1.3 has a role in making neurons susceptible to neurodegeneration and support earlier work in post-mortem human brain that suggested loss of calcium buffering capacity in neurons correlated with areas of neuronal loss in the substantia nigra of parkinsonian brain. This study examined expression of CaV1 subtypes and the calcium-binding proteins calbindin, calmodulin and calreticulin in areas vulnerable and resistant to neurodegeneration in Parkinson’s disease, in brain from neurologically normal individuals and patients with Parkinson’s disease. In control brain the expression of a specific CaV1 subtype or distribution of each calcium-binding protein did not associate with those regions prone to neurodegeneration in Parkinson’s disease. Whereas, alterations in the amount of both CaV1 subtypes and the calcium-binding proteins were found throughout the brain in Parkinson’s disease. Some changes reflected the cell loss seen in Parkinson’s disease, whereas others represented altered levels of cellular expression, which as they occurred in the absence of cell loss could not be explained as solely compensatory to the neurodegeneration. The finding of increased CaV1.3 subtype expression in the cerebral cortex of early stage Parkinson’s disease, before the appearance of pathological changes, supports the view that disturbed calcium homeostasis is an early feature of Parkinson’s disease and not just a compensatory consequence to the neurodegenerative process. This interpretation is supported further by the finding that the ratio of CaV1 subtypes differed throughout the brain in patients with Parkinson’s disease compared with control subjects, in favour of an increased use of CaV1.3, which would add to the metabolic burden for cells that rely on this CaV1 subtype for electrical activity and could therefore render specific neuronal populations more vulnerable to neurodegeneration.
Introduction
Parkinson’s disease is a progressive hypokinetic neurodegenerative disorder characterized by bradykinesia, rigidity, akinesia, abnormal posture and resting tremor and is the most prevalent movement disorder. The greatest risk factor for Parkinson’s disease is increasing age, such that it affects 1% of people >60 years of age, rising to 2–4% for those aged >80 years. In the later stages of the disease sensorimotor dysfunction, cognitive decline, depression and sleep disturbances also occur. The loss of nigrostriatal dopamine neurons in the substantia nigra pars compacta (and consequential reduction in the level of dopamine in the striatum), underlies the main motor symptoms of the disease. However, non-motor functional deficits often precede the major motor symptoms and may reflect neuronal loss or α-synuclein deposition in other brain regions, e.g. dorsal motor nucleus of the vagus nerve (DMV) and locus coeruleus (Lees et al., 2009).
The reason why some neurons die in Parkinson’s disease while others are spared is unknown, but vulnerable neurons share numerous traits. Thus, degenerating neurons, irrespective of the neurotransmitter type, are poorly myelinated with long fine axons that connect different brain regions and have large axonal fields (Braak et al., 2004). Consequently such neurons have high energy requirements, which necessitates efficient mitochondrial function and an effective Ca2+ buffering capacity if damage through oxidative stress or excitotoxicity is to be avoided (Surmeier et al., 2011). Another common feature of midbrain dopamine neurons and the other brainstem nuclei that degenerate in Parkinson’s disease is that they are autonomously active, with prominent transmembrane calcium currents that generate regular, slow, broad action potentials (2–4 Hz) in the absence of synaptic input (Surmeier et al., 2011). This pacemaking activity maintains basal neurotransmitter levels in regions that are innervated by these neurons. While most neurons rely exclusively on monovalent cation channels to drive pacemaking, studies in animals indicate that neurons vulnerable to neurodegeneration in the substantia nigra pars compacta and DMV preferentially use voltage-gated calcium channel (CaV1.3) for pacemaking, whereas the CaV1.3 channels on neurons that do not degenerate and which do not exhibit pacemaking (e.g. striatal spiny neurons) are only episodically activated (Fujimura and Matsuda, 1989; Chan et al., 2007; Khaliq and Bean, 2010; Goldberg et al., 2012; Surmeier et al., 2012). The use of calcium rather than monovalent cation ions for pacemaking uses more energy to maintain a non-toxic intracellular calcium concentration. In Parkinson’s disease, where mitochondrial dysfunction is evident, the reliance on CaV1.3 channels, should it also occur in humans, together with the other phenotype characteristics mentioned above may make the substantia nigra pars compacta neurons more susceptible to calcium-mediated excitotoxicity (Schapira et al., 1989; Guzman et al., 2010; Surmeier et al., 2011).
However, within regions that have pacemaking neurons, there is still variation in the susceptibility of neurons to degenerate and this has been postulated to coincide with the level of calcium-binding proteins that can buffer potentially toxic fluctuations in intracellular calcium concentrations (Yamada et al., 1990; German et al., 1992; Damier et al., 1999).
Recent retrospective epidemiological studies of patients treated with dihydropyridines (CaV1 subtype antagonists) have indicated a decreased risk for Parkinson’s disease (Becker et al., 2008; Ritz et al., 2010; Marras et al., 2012; Pasternak et al., 2012). Together, these data suggest a pathogenic role for CaV1.3 in Parkinson’s disease and CaV1.3 may therefore represent a disease modifying (neuroprotective) therapeutic target.
The expression of CaV1 subtypes is widespread throughout the brain, but most studies have been conducted in animals and examined brain regions that do not degenerate in Parkinson’s disease. No systematic study of the distribution of CaV1 subtypes or calcium-binding proteins has been conducted in normal human or Parkinson’s disease brain (Hurley and Dexter, 2012). Such studies are vital to elucidate whether the distribution of CaV1 subtypes has a role in neuronal vulnerability in Parkinson’s disease. This study investigated the expression of CaV1 subtypes and the calcium-binding proteins calbindin, calmodulin and calreticulin in normal human brain, in regions vulnerable and unaffected by neurodegeneration in Parkinson’s disease and assessed how they change in Parkinson’s disease. The data were analysed in two ways; first, cases were divided into early and late α-synuclein Braak stages in order to determine whether changes in expression of CaV1 subtypes preceded Parkinson’s disease pathology in brain or occurred as a result of the neurodegenerative process. Second, the cases were analysed with respect to the level of motor complications that the patients suffered from before death, in order to determine whether altered expression of CaV1 subtypes was linked to the motor complications associated with the treatment of Parkinson’s disease with dopaminergic drugs.
Materials and methods
Post-mortem human brain
Slide-mounted formalin-fixed paraffin wax embedded brain sections (6 μm) from nine control individuals (four males and five females) and 18 patients (14 males and four females) with Parkinson’s disease were obtained from the Parkinson’s UK Tissue Bank at Imperial College (Table 1). All subjects had consented while living to brain donation upon death. The average age of control subjects was 79.9 years (range 65–93 years) and the average age of patients with Parkinson’s disease was 78.1 years (range 58–86 years). The clinical diagnosis of Parkinson’s disease was confirmed post-mortem by neuropathological analysis (Alafuzoff et al., 2009). Control cases were from individuals who had no clinical diagnosis of a neurological or psychiatric disorder during life, nor any neuropathological abnormality evident post-mortem other than normal age-related changes. The brain regions chosen ranged from those with early involvement in the disease process, which undergo cell loss and had extensive α-synuclein pathology, to those that do not undergo cell loss and only contain α-synuclein pathology at the end-stage of Parkinson’s disease (Fig. 1). During neuropathological analysis, conducted by the Parkinson’s UK Tissue Bank, the degree of α-synuclein pathology was rated and each case was allocated to an α-synuclein Braak stage (Braak et al., 2003). In addition, all cases were rated (ABC level) for Alzheimer’s disease neuropathological change by assessment of amyloid-β plaques (A), neurofibrillary tangles (B) and neuritic plaques (C) scores (Montine et al., 2012). Cases with Parkinson’s disease were designated to either a low or high motor complications group, based on reference to falls, freezing, on–off phenomenon and dyskinesia in their clinical notes. All cases received l-DOPA (l-3,4-dihydroxyphenylalanine) and/or direct acting dopamine agonists before death.
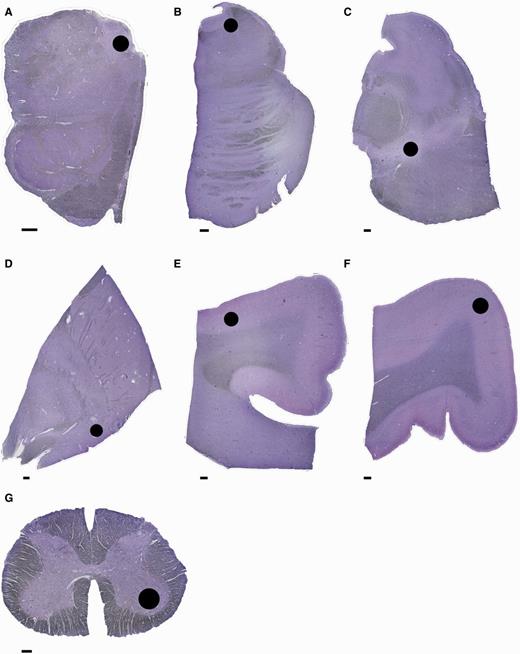
Anatomical regions examined. Sections stained with Cresyl violet showing the areas (black circle) where cell count and optical density measurements were taken. (A) Medulla with dorsal motor nucleus of the vagus nerve; (B) pons with locus coeruleus; (C) midbrain with substantia nigra pars compacta; (D) basal forebrain with nucleus basalis of Meynert; (E) cingulate gyrus with grey matter of superior sulcus (cingulate cortex); (F) precentral gyrus grey matter (primary motor cortex); (G) lumbar spinal cord with ventral horn. Scale bar = 1 mm.
Details of patients and control individuals who donated brain used in this study
| Case | Age | Gender | Onset age | PMI | NPD | aSYN score | ABC level | Clinical diagnosis | Complications | Spinal cord | Cause of death from clinical notes | |
|---|---|---|---|---|---|---|---|---|---|---|---|---|
| Motor | Psychiatric | |||||||||||
| P01 | 89 | M | 86 | 16 | LBDL | 5 | Not | PD | High | No | Yes | Septicaemia/pneumonia |
| P02 | 76 | M | 66 | 10 | LBDBS | 3 | Not | PD | Low | No | No | Not recorded |
| P03 | 77 | M | 67 | 6 | LBDN | 6 | Low | PD | Low | Yes | Yes | Not recorded |
| P04 | 80 | M | 75 | 7 | LBDL | 5 | Low | PD | High | No | Yes | Not recorded |
| P05 | 78 | M | 73 | 5 | LBDN | 6 | Low | PDD | High | Yes | No | Not recorded |
| P06 | 80 | F | 67 | 10 | LBDL | 4 | Low | PD | High | Yes | Yes | Old age and PD |
| P07 | 86 | M | 78 | 3 | LBDL | 5 | Low | PD | High | Yes | Yes | Ischaemic bowel |
| P08 | 81 | F | 67 | 22 | LBDN | 6 | Low | PD | High | Yes | No | Not recorded |
| P09 | 82 | M | 72 | 10 | LBDN | 6 | Low | PD | Low | Yes | Yes | Pneumonia |
| P10 | 75 | M | 67 | 3 | LBDL | 5 | Low | PD | Low | Yes | No | Pneumonia |
| P11 | 72 | M | 66 | 9 | LBDL | 4 | Not | PD | High | Yes | No | Pneumonia |
| P12 | 61 | M | 58 | 12 | LBDN | 6 | Low | PD | Low | No | No | Myocardial infarction |
| P13 | 83 | F | 80 | 12 | LBDL | 5 | Low | PD | High | Yes | Yes | Not recorded |
| P14 | 76 | M | 72 | 26 | LBDN | 6 | Low | PD | High | Yes | Yes | Ischaemic heart disease |
| P15 | 73 | M | 67 | 5 | LBDL | 5 | Not | PD | High | Yes | No | PD |
| P16 | 86 | F | 78 | 5 | LBDBS | 3 | Low | PD | High | Yes | No | Not recorded |
| P17 | 74 | M | 72 | 10 | LBDN | 6 | Low | PD | Low | No | Yes | Bronchopneumonia |
| P18 | 83 | M | 67 | 26 | LBDL | 5 | Not | PDD | Low | Yes | Yes | Pneumonia |
| C01 | 84 | M | - | 49 | Control | nd | Low | None | - | - | Yes | Pancreatic carcinoma |
| C02 | 82 | F | - | 27 | Control | nd | Not | None | - | - | No | Not recorded |
| C03 | 71 | M | - | 52 | Control | nd | Not | None | - | - | Yes | Myocardial infarction |
| C04 | 93 | F | - | 22 | Control | nd | Low | None | - | - | Yes | Bronchopneumonia |
| C05 | 65 | M | - | 12 | Control | nd | Not | None | - | - | No | Lung carcinoma |
| C06 | 78 | F | - | 23 | Control | nd | Not | None | - | - | Yes | Unknown |
| C07 | 80 | F | - | 23 | Control | nd | Not | None | - | - | Yes | Breast/spine carcinoma |
| C08 | 84 | F | - | 11 | Control | nd | Not | None | - | - | Yes | Pancreatic cancer |
| C09 | 82 | M | - | 48 | Control | nd | Low | None | - | - | ||
PMI = post-mortem interval; NPD = neuropathological diagnosis; aSYN score = α-synuclein Braak stage; ABC level = Alzheimer’s disease neuropathological score; LBDBS = Lewy body disease brainstem variant; LBDL = Lewy body disease limbic variant; LBDN = Lewy body disease neocortical variant; PD = Parkinson’s disease; PDD = Parkinson’s disease with dementia.
Immunohistochemistry
Details of the antibodies used and their dilutions are provided in Table 2. Specificity of the CaV1 subtype antibodies was determined by the supplier (NeuroMab) by immunohistochemistry in brain tissue and by western blot. They have been used (http://neuromab.ucdavis.edu/) to label CaV1 subtypes expressed in vitro and in tissue sections (Hettiarachchi et al., 2009; Fossat et al., 2010). Our preliminary experiments used human and rat hippocampus to establish experimental conditions and validate staining (since there is high expression of CaV1 subtypes in hippocampus) and the staining obtained matched that found in rodents (Vacher et al., 2008). The antibodies for neuronal markers are all established experimental reagents purchased from reputable companies that have been used extensively in brain research. Preliminary experiments were conducted to optimize the concentration of antibodies used and determine the best antigen retrieval technique for the available tissue. Unless otherwise stated all chemicals and reagents were purchased from Sigma-Aldrich. Immunohistochemistry was conducted using standard techniques (Supplementary material). Briefly, sections were dewaxed, endogenous peroxidase was quenched and antigens retrieved at high pH and temperature (pH 9.2, 100°C for 30 min). Non-specific sites were blocked with serum and sections were incubated with primary antibody overnight. Sections were then washed and incubated with a biotinylated secondary antibody (1:250, 2 h), washed again and then incubated with a streptavidin peroxidase conjugate (1:250, 90 min) followed by further washes. Staining was visualized by incubation with diaminobenzidine. For immunofluorescence, sections were processed similarly and goat anti-rabbit Alexa Fluor® 546 and goat anti-mouse Alexa Fluor® 488 (Invitrogen) were used in place of the secondary antibody.
Details of reagents used for immunohistochemistry
| Antibody | Supplier | Type | Product number | Dilution |
|---|---|---|---|---|
| Primary | ||||
| CaV1.2 | Antibodies Incorporated* | Monoclonal, mouse | P15381 (clone L57/46) | 1:100 |
| CaV1.3 | Antibodies Incorporated* | Monoclonal, mouse | P27732 (clone N38/8) | 1:100 |
| Calbindin 28 kDa | Stratech** | Monoclonal, rabbit | 2946-1-EPI (clone EP3478) | 1:750 |
| Calmodulin | Stratech** | Monoclonal, rabbit | 5197-1-EPI (clone EPR5028) | 1:750 |
| Calreticulin | Stratech** | Monoclonal, rabbit | 2959-1-EPI (EPR3925) | 1:750 |
| Neuronal nuclei | Millipore (Temecula) | Monoclonal, mouse | MAB377 (clone A60) | 1:250 |
| Tyrosine hydroxylase | Pel-Freez Biologicals | Polyclonal, rabbit | P40101-0 | 1:500 |
| GAD65/67 | Millipore (Temecula) | Polyclonal, rabbit | AB1511 | 1:100 |
| vGlutT1 | Abcam | Polyclonal, rabbit | AB72311 | 1:100 |
| IBA1 | Abcam | Polyclonal, rabbit | AB108539 | 1:100 |
| Alpha-synuclein | BD Transduction Labs | Monoclonal, mouse | 610786 (42/α-synuclein) | 1:500 |
| Beta-amyloid 17-24 | Covance | Monoclonal, mouse | SIG-39220 (clone 4G8) | 1:1000 |
| Phospho-PHF-tau | Thermo Scientific | Monoclonal, mouse | MN1020 (clone AT8) | 1:1000 |
| Secondary | ||||
| Biotin-SP-goat anti-mouse | Stratech | IgG (H + L) | 111-065-144 | 1:250 |
| Biotin-SP- sheep anti-rabbit | Stratech | IgG (H + L) | 515-065-062 | 1:250 |
| Alexa Fluor® 546 goat anti-mouse | Invitrogen | IgG (H + L) | A11035 | 1:1000 |
| Alexa Fluor® 488 goat anti-rabbit | Invitrogen | IgG (H + L) | A11029 | 1:1000 |
| Peroxidase conjugate | ||||
| Streptavidin-POD | Roche | 12213700 | 1:250 |
*Antibodies Incorporated distribute antibodies made by the UC Davis/NIH NeuroMab Facility.
**Stratech distribute antibodies made by Epitomics. H = heavy; L = light.
In all brain regions examined, staining was evident in perikarya and neuropil, which was not present when primary antibody was omitted. Such staining was therefore considered to represent specific binding of the antibody to the respective protein in the tissue section.
Image acquisition
For stereological cell counts, light microscopic images of chromagen immunolabelled cells were captured with a three-chip colour CCD digital camera (JVC, model KY-F55BE) attached to an Eclipse E800 microscope (Nikon) equipped with a motorized (x–y axis) stage using Image-Pro® Plus stereology software v. 6.2 (Media Cybernetics) with appropriate filters and light source. Images of fluorescent dye-labelled cells were captured using a TCS-SP5 II confocal scanning microscope (Leica) and LAS AF imaging software v. 2.5.2.6939 (Leica). Photographs for figures were taken using a Micropublisher 5.0 RTV digital camera (Q-Imaging) attached to an Eclipse 50i microscope (Nikon) using Image-Pro® Plus software v. 5.1 (Media Cybernetics). Photoshop Elements v.9.0 (Adobe) was used to resize and adjust (automatically) the contrast and/or levels of images.
Cell counting
An estimate of the total cell density was obtained by unbiased design-based stereological cell-counting techniques using Image-Pro® Plus stereology software v. 6.2 (Media Cybernetics). Results were presented as cells/mm2 brain and not as a volume. Sections were tiled at ×10 magnification and a montage image created. The region of interest (Fig. 1) was delineated on this image and the counting area (A) calculated using Cavalieri’s principle and a 350 × 350 µm volume grid. Counting was conducted at ×200 magnification using a 200 ×200 µm systematic uniform random points experimental grid containing a 125 × 125 µm counting frame. All frames were counted. A cell was considered immunopositive if the diaminnobenzidine peroxidase reaction product was present in the perikarya of a neuron. The number of cells in the region of interest was estimated using the formula: N = (1/area sampling fraction) × total cell count. Where the area sampling fraction = the area of the number of frames counted/A. The cell density (cells/mm2) in the region of interest was obtained by dividing the estimated cell number (N) by the area of the region of interest for each case, then taking the mean across cases (Schmitz and Hof, 2005).
Densitometry
When performing the above immunohistochemistry it was evident that the antibody staining for the CaV1 channels and calcium-binding proteins was not homogenous, with some cells darkly stained whereas adjacent cells were only weakly stained. In addition, the neuropil was stained by all the antibodies used, with the exception of neuronal nuclei. Hence, in order to gain an overall perspective of global expression of a particular protein in a brain area, densitometric analysis across the brain region where cells were counted was conducted (Xavier et al., 2005). Stained sections were digitized using the same illumination and image capture parameters for each slide at ×40 magnification into numerous tiles that were combined to produce an 8-bit greyscale montage image using Image-Pro® Plus software v. 5.1 (Media Cybernetics). To determine the degree of staining in the neuropil the relative optical density was measured in the area of interest (Fig. 1) using ImageJ v. 1.45 s (NIH). A background measurement for each slide was subtracted from the measured relative optical densities. As ImageJ assigns a value of 0 to a black pixel and a value of 255 to a white pixel, to avoid confusion, the measured values were inverted (i.e. 0 = white and 255 = black) so that a darker image would have a higher relative optical density than a lighter one.
Data analysis
Data were analysed using SPSS™ statistics software v.19 (IBM) and were presented as mean ± standard error of the mean (SEM). Prism™ V (Graphpad) was used to plots graphs of means ± SEM. For analysis, cases with Parkinson’s disease were divided into either early (α-synuclein Braak stage 3 or 4, n = 4), late (α-synuclein Braak stage 5 or 6, n = 14), or those with a high (n = 11) or low (n = 7) incidence of motor complications (Table 1). The distribution of cell counts and relative optical densities were assessed with a normality test. Data with a normal distribution (Shapiro-Wilk, P > 0.05 = normal distribution) were analysed by one-way ANOVA (F) followed, where appropriate, by a Dunnett multiple comparison test. In cases where one or more data sets in a comparison failed normality testing, data were analysed by the Kruskal-Wallis one-way ANOVA by ranks (H) with multiple pair-wise comparisons. The significance level for all tests was taken to be P < 0.05.
Results
Cell count and staining intensity data are summarized in Tables 3 and 4, respectively. The percentage ratio of CaV1.2 to CaV1.3 expression are summarized in Table 5.
Stereological cell counts (cells/mm2)
| Control | Early PD (Braak 3 or 4) | Late PD (Braak 5 or 6) | Low motor complications | High motor complications | |
|---|---|---|---|---|---|
| DMV | n = 8 | n = 4 | n = 14 | n = 7 | n = 11 |
| CaV1.2 | 87 ± 13 | 101 ± 13 | 90 ± 9 | 96 ± 12 | 90 ± 11 |
| CaV1.3 | 66 ± 10 | 111 ± 18 | 74 ± 8 | 86 ± 13 | 79 ± 10 |
| CaB | 81 ± 11 | 101 ± 6 | 67 ± 6 | 73 ± 8 | 77 ± 8 |
| CaM | 51 ± 5 | 71 ± 14 | 45 ± 8 | 68 ± 12 | 40 ± 7 |
| CaR | 117 ± 16 | 124 ± 6 | 98 ± 9 | 104 ± 9 | 104 ± 11 |
| NeuN | 132 ± 10 | 125 ± 15 | 111 ± 10 | 134 ± 13 | 104 ± 9 |
| TH | 37 ± 9 | 35 ± 6 | 29 ± 4 | 29 ± 31 | 31 ± 3 |
| LC | n = 8 | n = 4 | n = 13 | n = 7 | n = 11 |
| CaV1.2 | 85 ± 7 | 58 ± 9 | 49 ± 6** | 54 ± 11** | 48 ± 6** |
| CaV1.3 | 66 ± 5 | 96 ± 23 | 122 ± 8*** | 110 ± 10* | 119 ± 12** |
| CaB | 54 ± 9 | 45 ± 9 | 37 ± 7 | 39 ± 11 | 39 ± 7 |
| CaM | 100 ± 16 | 75 ± 24 | 58 ± 7* | 68 ± 17 | 58 ± 6* |
| CaR | 128 ± 16 | 84 ± 26 | 60 ± 7** | 79 ± 16* | 56 ± 8*** |
| NeuN | 82 ± 11 | 89 ± 22 | 86 ± 9 | 85 ± 14 | 89 ± 10 |
| TH | 53 ± 10 | 39 ± 7 | 28 ± 4* | 34 ± 6 | 29 ± 4* |
| SNc | n = 9 | n = 4 | n = 14 | n = 7 | n = 11 |
| CaV1.2 | 111 ± 13 | 64 ± 10* | 76 ± 6* | 75 ± 5* | 72 ± 8* |
| CaV1.3 | 42 ± 8 | 23 ± 9 | 24 ± 4* | 21 ± 4* | 25 ± 5 |
| CaB | 72 ± 13 | 39 ± 9 | 22 ± 5*** | 25 ± 4** | 26 ± 7** |
| CaM | 61 ± 13 | 13 ± 2 | 10 ± 5*** | 7 ± 3** | 13 ± 6** |
| CaR | 129 ± 15 | 62 ± 19 | 70 ± 9** | 68 ± 13 | 68 ± 10* |
| NeuN | 104 ± 14 | 66 ± 8 | 70 ± 9 | 81 ± 15 | 62 ± 6 |
| TH | 77 ± 14 | 19 ± 6** | 30 ± 5*** | 18 ± 4*** | 34 ± 5 |
| NBM | n = 8 | n = 4 | n = 14 | n = 7 | n = 11 |
| CaV1.2 | 119 ± 11 | 59 ± 23** | 34 ± 6*** | 34 ± 9** | 43 ± 10** |
| CaV1.3 | 148 ± 16 | 59 ± 19*** | 47 ± 4*** | 55 ± 3* | 46 ± 8*** |
| CaB | 56 ± 10 | 18 ± 8 | 16 ± 6** | 15 ± 4* | 17 ± 3** |
| CaM | 62 ± 16 | 29 ± 8 | 32 ± 3 | 33 ± 6 | 31 ± 3 |
| CaR | 136 ± 7 | 95 ± 13 | 98 ± 11** | 92 ± 13* | 101 ± 3* |
| NeuN | 122 ± 8 | 81 ± 22* | 28 ± 4*** | 29 ± 6** | 43 ± 3*** |
| CgCx | n = 8 | n = 4 | n = 14 | n = 7 | n = 11 |
| CaV1.2 | 189 ± 19 | 224 ± 32 | 204 ± 8 | 198 ± 12 | 215 ± 12 |
| CaV1.3 | 55 ± 13 | 45 ± 16 | 106 ± 18* | 109 ± 24 | 82 ± 22 |
| CaB | 137 ± 9 | 131 ± 7 | 109 ± 9 | 113 ± 13 | 114 ± 10 |
| CaM | 106 ± 17 | 78 ± 14 | 66 ± 7* | 78 ± 11 | 63 ± 7* |
| CaR | 259 ± 12 | 265 ± 14 | 251 ± 7 | 266 ± 10 | 247 ± 8 |
| NeuN | 247 ± 18 | 213 ± 24 | 226 ± 11 | 219 ± 17 | 226 ± 12 |
| PMC | n = 9 | n = 4 | n = 14 | n = 7 | n = 11 |
| CaV1.2 | 109 ± 11 | 163 ± 23 | 138 ± 13 | 158 ± 24 | 134 ± 12 |
| CaV1.3 | 131 ± 10 | 176 ± 27 | 167 ± 17 | 200 ± 28* | 149 ± 12 |
| CaB | 57 ± 9 | 77 ± 9 | 72 ± 10 | 82 ± 15 | 67 ± 10 |
| CaM | 98 ± 14 | 64 ± 23 | 69 ± 6 | 61 ± 10 | 73 ± 9 |
| CaR | 158 ± 13 | 167 ± 10 | 166 ± 11 | 142 ± 11 | 181 ± 10 |
| NeuN | 251 ± 18 | 310 ± 40 | 238 ± 11 | 255 ± 28 | 254 ± 15 |
| SCv | n = 6 | n = 9 | n = 4 | n = 6 | |
| CaV1.2 | 58 ± 8 | - | 41 ± 5 | 44 ± 8 | 47 ± 10 |
| CaV1.3 | 49 ± 8 | - | 55 ± 8 | 69 ± 14 | 48 ± 6 |
| CaB | 23 ± 4 | - | 45 ± 6* | 49 ± 15 | 45 ± 4 |
| CaM | 61 ± 7 | - | 62 ± 7 | 61 ± 11 | 64 ± 8 |
| CaR | 63 ± 9 | - | 77 ± 8 | 74 ± 13 | 79 ± 9 |
| NeuN | 41 ± 3 | - | 53 ± 7 | 57 ± 7 | 52 ± 10 |
Stereological cell counts (cell/mm2) for brain regions in the medulla (DMV), pons (locus coeruleus, LC), midbrain (substantia nigra pars compacta, SNc), basal forebrain (nucleus basalis of Meynert, NBM), cerebral cortex (cingulate cortex, CgCx; primary motor cortex, PMC) and spinal cord (ventral horn of the lumbar spinal cord, SCv) from control individuals and patients with Parkinson’s disease. Data are mean ± SEM, *P < 0.05, **P < 0.01, ***P < 0.001.
Staining intensity (relative optical density) values
| Control | Early PD (Braak 3 or 4) | Late PD (Braak 5 or 6) | Low motor complications | High motor complications | |
|---|---|---|---|---|---|
| DMV | n = 8 | n = 4 | n = 14 | n = 7 | n = 11 |
| CaV1.2 | 21 ± 1 | 25 ± 3 | 26 ± 1* | 26 ± 2 | 25 ± 1 |
| CaV1.3 | 14 ± 2 | 25 ± 5 | 20 ± 1 | 21 ± 3 | 21 ± 2 |
| CaB | 32 ± 2 | 43 ± 2 | 35 ± 2 | 37 ± 3 | 36 ± 3 |
| CaM | 24 ± 1 | 23 ± 1 | 25 ± 1 | 25 ± 1 | 24 ± 1 |
| CaR | 24 ± 2 | 30 ± 3 | 30 ± 2 | 32 ± 2* | 28 ± 2 |
| TH | 16 ± 2 | 30 ± 5** | 25 ± 2** | 28 ± 2** | 25 ± 2* |
| LC | n = 8 | n = 4 | n = 13 | n = 7 | n = 11 |
| CaV1.2 | 26 ± 2 | 28 ± 3 | 28 ± 1 | 29 ± 2 | 27 ± 1 |
| CaV1.3 | 16 ± 2 | 25 ± 4 | 22 ± 2 | 23 ± 3 | 23 ± 2* |
| CaB | 27 ± 3 | 36 ± 4 | 35 ± 1* | 35 ± 3 | 35 ± 1* |
| CaM | 36 ± 2 | 29 ± 2 | 27 ± 1** | 27 ± 2* | 28 ± 1** |
| CaR | 24 ± 2 | 28 ± 2 | 26 ± 1 | 28 ± 2 | 26 ± 1 |
| TH | 21 ± 1 | 23 ± 4 | 22 ± 1 | 23 ± 2 | 21 ± 2 |
| SNc | n = 9 | n = 4 | n = 14 | n = 7 | n = 11 |
| CaV1.2 | 13 ± 2 | 18 ± 3 | 16 ± 1 | 17 ± 2 | 16 ± 1 |
| CaV1.3 | 14 ± 1 | 20 ± 2 | 21 ± 2* | 21 ± 2* | 21 ± 2* |
| CaB | 24 ± 2 | 27 ± 4 | 27 ± 2 | 27 ± 2 | 27 ± 2 |
| CaM | 27 ± 1 | 26 ± 1 | 26 ± 1 | 26 ± 2 | 27 ± 1 |
| CaR | 21 ± 2 | 22 ± 2 | 23 ± 1 | 24 ± 2 | 22 ± 1 |
| TH | 24 ± 3 | 20 ± 1 | 20 ± 1 | 19 ± 2 | 20 ± 1 |
| NBM | n = 8 | n = 4 | n = 14 | n = 7 | n = 11 |
| CaV1.2 | 16 ± 3 | 30 ± 2* | 27 ± 1* | 27 ± 2 | 28 ± 1** |
| CaV1.3 | 19 ± 2 | 22 ± 3 | 22 ± 1 | 22 ± 2 | 22 ± 1 |
| CaB | 34 ± 2 | 31 ± 2 | 31 ± 1 | 28 ± 1* | 33 ± 1 |
| CaM | 45 ± 2 | 41 ± 2 | 43 ± 1 | 43 ± 1 | 42 ± 1 |
| CaR | 16 ± 1 | 21 ± 3 | 26 ± 1*** | 25 ± 2*** | 24 ± 1*** |
| TH | 10 ± 1 | 12 ± 4 | 13 ± 2 | 17 ± 3** | 10 ± 1 |
| CgCx | n = 8 | n = 4 | n = 14 | n = 7 | n = 11 |
| CaV1.2 | 23 ± 2 | 25 ± 3 | 27 ± 1 | 28 ± 2 | 26 ± 1 |
| CaV1.3 | 15 ± 1 | 24 ± 4 | 23 ± 2* | 25 ± 3* | 22 ± 2* |
| CaB | 31 ± 1 | 37 ± 4 | 33 ± 1 | 35 ± 3 | 34 ± 2 |
| CaM | 27 ± 1 | 30 ± 3 | 30 ± 1 | 32 ± 2* | 29 ± 1 |
| CaR | 23 ± 1 | 30 ± 3* | 29 ± 1* | 30 ± 2* | 29 ± 1* |
| PMC | n = 9 | n = 4 | n = 14 | n = 7 | n = 11 |
| CaV1.2 | 23 ± 2 | 29 ± 3 | 27 ± 2 | 29 ± 2 | 26 ± 2 |
| CaV1.3 | 15 ± 2 | 28 ± 4** | 22 ± 2* | 27 ± 3** | 22 ± 2* |
| CaB | 16 ± 1 | 26 ± 4** | 23 ± 1* | 26 ± 3** | 22 ± 1* |
| CaM | 30 ± 1 | 39 ± 2* | 35 ± 2 | 36 ± 2 | 36 ± 2 |
| CaR | 24 ± 2 | 29 ± 2 | 31 ± 1* | 30 ± 3 | 31 ± 1* |
| SCv | n = 6 | n = 9 | n = 4 | n = 6 | |
| CaV1.2 | 20 ± 2 | - | 24 ± 2 | 28 ± 3* | 21 ± 1 |
| CaV1.3 | 14 ± 1 | - | 16 ± 1* | 17 ± 1 | 17 ± 1 |
| CaB | 22 ± 3 | - | 32 ± 2* | 33 ± 2* | 31 ± 3* |
| CaM | 41 ± 1 | - | 41 ± 1 | 40 ± 1 | 41 ± 1 |
| CaR | 24 ± 2 | - | 28 ± 2 | 28 ± 3 | 29 ± 2 |
Relative optical density values for brain regions in the medulla (DMV), pons (locus coeruleus, LC), midbrain (substantia nigra pars compacta, SNc), basal forebrain (nucleus basalis of Meynert, NBM), cerebral cortex (cingulate cortex, CgCx; primary motor cortex, PMC) and spinal cord (ventral horn of the lumbar spinal cord, SCv) from control individuals and patients with Parkinson’s disease (PD). Data are mean ± SEM, *P < 0.05, **P < 0.01, ***P < 0.001.
Comparison of percentage ratio of CaV1.2 to CaV1.3 expression
| Region | Control | Early PD (Braak 3 or 4) | Late PD (Braak 5 or 6) | Low motor complications | High motor complications |
|---|---|---|---|---|---|
| Cell count | |||||
| DMV | 57:43 | 48:52 | 55:45 | 53:47 | 53:47 |
| LC | 56:44 | 38:62 | 29:71 | 33:67 | 29:71 |
| SNc | 72:28 | 74:26 | 76:24 | 78:22 | 74:26 |
| NBM | 45:55 | 50:50 | 42:58 | 38:62 | 48:52 |
| CgCx | 78:22 | 83:17 | 66:34 | 65:35 | 72:28 |
| PMC | 45:55 | 48:52 | 45:55 | 44:56 | 47:53 |
| SCv | 54:46 | - | 43:57 | 39:61 | 50:50 |
| Mean | 58:42 | 57:43 | 51:49 | 50:50 | 53:47 |
| Optical density | |||||
| DMV | 59:41 | 50:50 | 57:43 | 56:44 | 55:45 |
| LC | 62:38 | 53:47 | 56:44 | 56:44 | 55:45 |
| SNc | 49:51 | 48:52 | 43:57 | 45:55 | 44:56 |
| NBM | 46:54 | 57:43 | 55:45 | 54:46 | 56:44 |
| CgCx | 61:39 | 51:49 | 54:46 | 53:47 | 54:46 |
| PMC | 61:39 | 50:50 | 55:45 | 52:48 | 55:45 |
| SCv | 60:40 | - | 59:41 | 63:37 | 55:45 |
| Mean | 57:43 | 52:48 | 54:46 | 54:46 | 53:47 |
LC = locus coeruleus; SNc = substantia nigra pars compacta; NBM = nucleus basalis of Meynert; CgCx = cingulate cortex; PMC = primary motor cortex; SCv = ventral horn of the lumbar spinal cord; PD = Parkinson’s disease; DMV = dorsal motor nucleus of the vagus nerve.
Dorsal motor nucleus of vagus
Normal brain
The CaV1.2 and CaV1.3 antibodies labelled the cell bodies and proximal dendrites of large multipolar neurons in the DMV with an estimated cellular density of 87 ± 13 and 66 ± 10 cells/mm2, respectively. The percentage ratio of cells that expressed CaV1.2 to CaV1.3 was 57:43. The DMV contained 37 ± 9 cells/mm2 tyrosine hydroxylase-positive (noradrenergic) neurons, which comprised 28% of the total neuronal population, some of them contained visible neuromelanin and most were concentrated along the medial edge of the nucleus. The total number of neurons was 132 ± 10 cells/mm2. CaV1.2 and CaV1.3 immunoreactivity was also evident in the neuropil of the DMV, where the percentage staining intensity ratio was 59:41. The calbindin, calmodulin and calreticulin antibodies also labelled the cell bodies and proximal dendrites of large multipolar neurons in the DMV with an estimated density of 81 ± 11, 51 ± 5 and 117 ± 16 cells/mm2, respectively and also stained the neuropil (Fig. 2, Tables 3, 4 and 5).
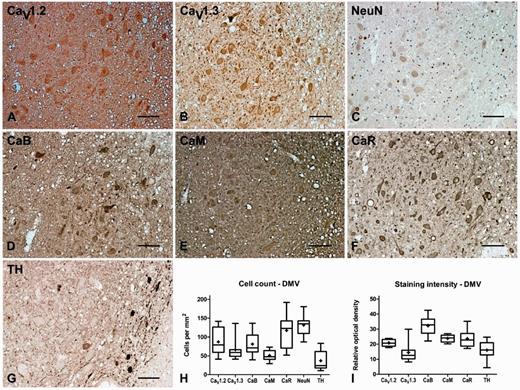
Representative immunohistochemistry staining and quantification in the dorsal motor nucleus of the vagus nerve of normal brain. Representative immunohistochemistry staining of CaV1.2 (A), CaV1.3 (B), neuronal nuclei (NeuN, C), calbindin (CaB, D), calmodulin (CaM, E), calreticulin (CaR, F) and tyrosine hydroxylase (TH, G) in the DMV of normal brain showing labelling of the cholinergic principal neurons in this region together with some tyrosine hydroxylase-positive neurons particularly around the medial edge of the nucleus. Box and whisker plots of stereological cell counts (H) and densitometry of relative staining intensity (I) in the DMV. Box = 25th and 75th percentiles; line = median; + = mean; whiskers = 5th and 95th percentiles. Scale bar = 100 µm.
Parkinson’s disease
Cell counts
The number of neurons that expressed all antibodies investigated was not significantly changed in the DMV of cases with Parkinson’s disease in comparison with controls. The percentage ratio of CaV1.2 to CaV1.3 expression in each experimental group was more equal in cases with Parkinson’s disease compared with control subjects (Tables 3 and 5).
Optical density
The staining intensity of CaV1.2 immunoreactivity in neuropil of the DMV increased by 23% in cases with late Parkinson’s disease, despite no change in the number of cells expressing CaV1.2, which indicated an increase in expression of CaV1.2. The percentage ratio of CaV1.2 to CaV1.3 staining was more even in Parkinson’s disease compared to controls. There was an increase in the intensity of tyrosine hydroxylase immunoreactivity in the DMV of 85% and 58% in the early and late Parkinson’s disease groups, respectively, which suggested an increase in cellular expression, since the number of tyrosine hydroxylase-positive neurons did not change (Tables 4 and 5).
Locus coeruleus
Normal brain
CaV1.2 and CaV1.3 immunoreactivity was present on multipolar cells within the locus coeruleus with an estimated density of 85 ± 7 and 66 ± 5 cells/mm2, respectively. The percentage ratio of CaV1.2 to CaV1.3 expression was 56:44. Most (66%) of the cells were tyrosine hydroxylase-positive (54 ± 10 cells/mm2) and the majority of them also contained visible neuromelanin. The total number of neuronal nuclei-positive neurons in the locus coeruleus was 82 ± 11 cells/mm2, which indicated that CaV1.3 was not expressed by every neuron. CaV1.2 and CaV1.3 immunoreactivity was also evident in the neuropil, where the staining intensity ratio was 62:38. Calbindin, calmodulin and calreticulin immunoreactivity was also present on large multipolar neurons within the locus coeruleus at an estimated density of 54 ± 9, 100 ± 16 and 128 ± 16 cells/mm2, respectively and was also evident in the neuropil (Fig. 3, Tables 3, 4 and 5).
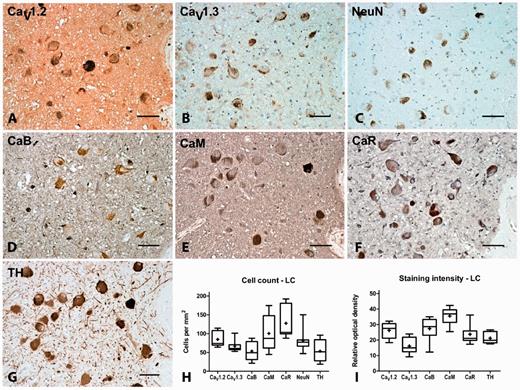
Representative immunohistochemistry staining and quantification in the locus coeruleus of normal brain. Representative immunohistochemistry staining of CaV1.2 (A), CaV1.3 (B), neuronal nuclei (NeuN, C), calbindin (CaB, D), calmodulin (CaM, E), calreticulin (CaR, F) and tyrosine hydroxylase (TH, G) in the locus coeruleus (LC) of normal brain showing labelling of the noradrenergic principal neurons in this region. Box and whisker plots of stereological cell counts (H) and densitometry of relative staining intensity (I) in the locus coeruleus. Box = 25th and 75th percentiles; line = median; + = mean; whiskers = 5th and 95th percentiles. Scale bar = 100 µm.
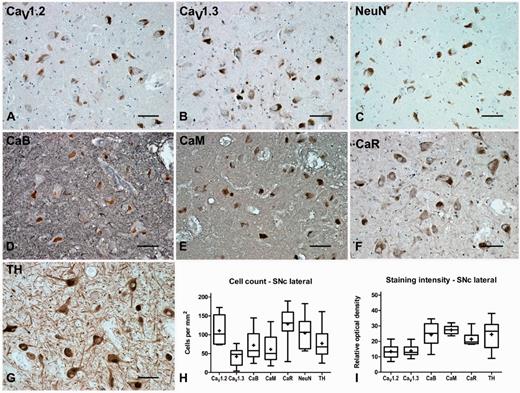
Representative immunohistochemistry staining and quantification in the substantia nigra pars compacta of normal brain. Representative immunohistochemistry staining of CaV1.2 (A), CaV1.3 (B), neuronal nuclei (NeuN, C), calbindin (CaB, D), calmodulin (CaM, E), calreticulin (CaR, F) and tyrosine hydroxylase (TH, G) in the substantia nigra pars compacta (SNc) of normal brain showing labelling of the dopaminergic principal neurons in this region. Box and whisker plots of stereological cell counts (H) and densitometry of relative staining intensity (I) in the substantia nigra pars compacta. Box = 25th and 75th percentiles; line = median; + = mean; whiskers = 5th and 95th percentiles. Scale bar = 100 µm.
Parkinson’s disease
Cell counts
The number of large CaV1.2 positive cells in the locus coeruleus was reduced by 43% in cases with late Parkinson’s disease. In contrast, the total number of cells that expressed CaV1.3 increased by 83% compared with controls in the locus coeruleus of cases with late Parkinson’s disease. The percentage ratio of CaV1.2 to CaV1.3 expression changed such that CaV1.3 was present in greater abundance than CaV1.2. The total number of cells that expressed calmodulin, calreticulin and tyrosine hydroxylase was reduced in late Parkinson’s disease by 42%, 53% and 47%, respectively in the locus coeruleus (Tables 3 and 5).
Optical density
Despite a reduction in the numbers of cells expressing CaV1.2 in the locus coeruleus, the intensity of CaV1.2 staining was unchanged, which suggested an increase in CaV1.2 expression in the neuropil or surviving cells in this area. Conversely, the overall intensity of CaV1.3 did not increase even though more cells expressed this channel in this area. The percentage ratio of CaV1.2 to CaV1.3 expression in each experimental group was more even than that of control cases. The staining intensity of tyrosine hydroxylase was unchanged in the locus coeruleus despite a marked fall in the numbers of cells expressing tyrosine hydroxylase, which indicated upregulation of tyrosine hydroxylase expression in surviving cells. The staining intensity of calbindin increased in the locus coeruleus by 27% in cases with late Parkinson’s disease, despite no changes in cell numbers expressing calbindin. The staining intensity of calmodulin decreased by 19% in late Parkinson’s disease. The staining intensity of calreticulin was unchanged in the locus coeruleus despite a marked fall in the numbers of cells expressing calreticulin, which indicated upregulation of calreticulin (Tables 4 and 5).
Substantia nigra pars compacta
Normal brain
In the substantia nigra pars compacta, CaV1.2 and CaV1.3 labelled large multipolar cells at a density of 111 ± 13 and 42 ± 8 cells/mm2, respectively, thus demonstrating a clear dominance of CaV1.2 expression over CaV1.3. The percentage ratio of CaV1.2 to CaV1.3 expression was 72:28. Of these the majority (74%) were tyrosine hydroxylase-positive dopamine neurons that contained visible neuromelanin. CaV1.2 and CaV1.3 immunoreactivity was also evident in the neuropil of the substantia nigra pars compacta, where the percentage ratio of staining intensity was 49:51. In the substantia nigra pars compacta, calbindin, calmodulin and calreticulin labelled large multipolar cells, with an estimated density of 72 ± 13, 61 ± 13, and 129 ± 15 cells/mm2, respectively. Calcium-binding protein immunoreactivity was also apparent within the neuropil of the substantia nigra pars compacta (Fig. 4, Tables 3, 4 and 5). Double immunofluorescence labelling with CaV1 subtype antibodies and either GAD65/67, vGlutT1, IBA1 or tyrosine hydroxylase indicated that the CaV1.2 and CaV1.3 were present on GABAergic and glutamatergic neurons and microglia as well as dopamine neurons in the substantia nigra pars compacta (Fig. 5).
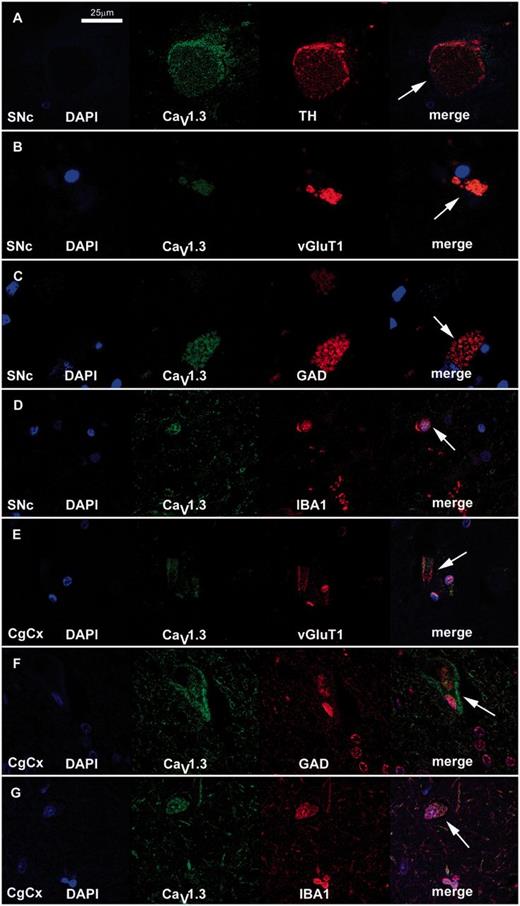
Representative immunofluorescent staining of CaV1.3 subtypes and neuronal markers in the substantia nigra pars compacta (SNc) and cingulate cortex (CgCx) of normal brain. Fluorescent double staining with the CaV1.3 antibody (green) and neuronal markers (red) for tyrosine hydroxylase (TH, A), vGluT1 (B and E), GAD (C and F) and IBA1 (D and G) identified (arrow) the types of cell (dopaminergic, glutamatergic, GABAergic and microglia, respectively) which expressed CaV1.3 in the substantia nigra pars compacta (A–D) and cingulate cortex (E–G). Similar results were obtained with the CaV1.2 antibody (data not shown). Scale bar = 25 µm.
Parkinson’s disease
Cell counts
The number of cells that expressed CaV1.2 in the substantia nigra pars compacta was reduced by 42% and 31% in cases with early and late Parkinson’s disease, respectively. Likewise, the number of cells that expressed CaV1.3 decreased by 44% in cases with late Parkinson’s disease. The percentage ratio of CaV1.2 to CaV1.3 expression in each experimental group was similar to that found in control cases. As expected in the substantia nigra pars compacta, tyrosine hydroxylase was significantly reduced (early, 75%; late, 61%) and so were the number of cells positive for the calbindin, calmodulin and calreticulin which decreased by 70%, 86% and 46%, respectively, in cases with late Parkinson’s disease (Tables 3 and 5).
Optical density
Unlike the reduction in cell numbers that expressed CaV1.2, the overall expression of CaV1.2 did not change in the substantia nigra pars compacta in Parkinson’s disease. The intensity of CaV1.3 staining increased by 53% in cases with late Parkinson’s disease. The maintenance of CaV1.2 expression and increased CaV1.3 immunostaining occurred despite a reduced number of cells positive for each CaV1 subtype, which suggested that the level of expression per cell or in the neuropil had increased. The percentage ratio of CaV1.2 to CaV1.3 expression in each experimental group changed to make CaV1.3 predominate. The staining intensity of calbindin, calmodulin and calreticulin was unchanged in all experimental groups in comparison with control cases in the substantia nigra pars compacta, which suggested upregulation in surviving cells (Tables 4 and 5).
Nucleus basalis of Meynert
Normal brain
In the nucleus basalis of Meynert, CaV1.2 staining was evident on the apical region of proximal dendrites and around the edge of the soma, whereas CaV1.3 staining was more evenly distributed throughout the cytoplasm of large multipolar neurons, at estimated densities of 119 ± 11 and 148 ± 17 cells/mm2, respectively, which indicated a dominance of CaV1.3 over CaV1.2. The percentage ratio of CaV1.2 to CaV1.3 expression was 45:55. The total number of neuronal nuclei-positive neurons was 122 ± 8 cells/mm2, which indicated that all neurons were immunopositive for CaV1.3. In the neuropil, CaV1.2 and CaV1.3 immunoreactivity was also evident and the ratio of CaV1.2 to CaV1.3 expression was 46:54. In the nucleus basalis of Meynert, approximately half of the large multipolar neurons stained intensely for calbindin (56 ± 10 cells/mm2) and calmodulin (62 ± 16 cells/mm2), whereas staining of the remaining neurons appeared similar to that found in the surrounding neuropil. In contrast all (135.7 ± 6.6 cells/mm2) large multipolar neurons stained intensely for calreticulin. Staining for the calcium-binding proteins was also present in the neuropil in the nucleus basalis of Meynert (Fig. 6, Tables 3, 4 and 5).
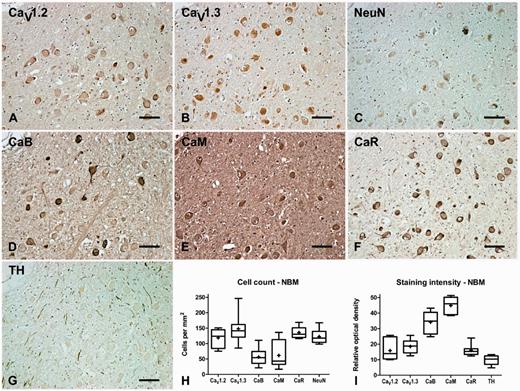
Representative immunohistochemistry staining and quantification in the nucleus basalis of Meynert of normal brain. Representative immunohistochemistry staining of CaV1.2 (A), CaV1.3 (B), neuronal nuclei (NeuN, C), calbindin (CaB, D), calmodulin (CaM, E), calreticulin (CaR, F) and tyrosine hydroxylase (G) in the nucleus basalis of Meynert (NBM) of normal brain showing labelling of the cholinergic principal neurons in this region. Box and whisker plots of stereological cell counts (H) and densitometry of relative staining intensity (I) in the nucleus basalis of Meynert (NBM). Box = 25th and 75th percentiles; line = median; + = mean; whiskers = 5th and 95th percentiles. Scale bar = 100 µm.
Parkinson’s disease
Cell counts
The number of large multipolar cells that expressed CaV1.2 in the nucleus basalis of Meynert decreased in early and late Parkinson’s disease by 51% and 71%, respectively. The number of cells that expressed CaV1.3 was also reduced in both Parkinson’s disease groups (early, 60%; late, 68%), The percentage ratio of CaV1.2 to CaV1.3 expression indicated that CaV1.3 was the dominant calcium channel on cell perikarya in the nucleus basalis of Meynert. There was a reduction of 72% in the total number of cells that expressed calbindin in the nucleus basalis of Meynert in cases with late Parkinson’s disease and the number of cells that expressed calreticulin decreased in early Parkinson’s disease by 28%. The number of cells that expressed calmodulin was not significantly altered. There was also a reduction in the number of cells that expressed neuronal nuclei in early (34%) and late (77%) Parkinson’s disease (Tables 3 and 5).
Optical density
In the nucleus basalis of Meynert, CaV1.2 staining intensity increased by 87% in cases with early Parkinson’s disease and 72% in cases with late Parkinson’s disease. The increased staining intensity of CaV1.2 contrasted with the observed reduction in the numbers of cells that expressed CaV1.2, which indicated increased expression in remaining cells and/or neuropil. There was no alteration in the staining intensity of CaV1.3 in any group despite a reduction in cell numbers in some Parkinson’s disease groups, which again signified upregulation of expression. The percentage ratio of CaV1.2 to CaV1.3 expression in the neuropil indicated that CaV1.2 predominanted over CaV1.3. The staining intensity of calreticulin in the nucleus basalis of Meynert increased by 59% in cases with late Parkinson’s disease, despite a reduction in the number of cells that expressed calreticulin, which suggested an upregulation of calreticulin expression (Tables 4 and 5).
Cingulate cortex
Normal brain
In cingulate cortex, CaV1.2 and CaV1.3 immunoreactivity was present on pyramidal cells in all layers. Most staining was found in layers II, III and IV, where the estimated density was 189 ± 19 and 55 ± 13 cells/mm2 for CaV1.2 and CaV1.3, respectively. The percentage ratio was 78:22, demonstrating a marked dominance in CaV1.2 utilization over CaV1.3 in the cingulate cortex. CaV1.2 and CaV1.3 immunoreactivity was also evident in the neuropil of the cingulate cortex, where the percentage ratio staining intensity was 61:39. Calbindin, calmodulin and calreticulin immunoreactivity was present on pyramidal cells in all layers of the cingulate cortex. Again, the highest numbers of stained cells were in layers II, III and IV, where the estimated density was 137 ± 10, 106 ± 18, and 259 ± 12 cells/mm2 for the calbindin, calmodulin and calreticulin antibodies, respectively. Calbindin and calmodulin were therefore only detectable in approximately half of the neuronal population, whereas calreticulin was present in all neurons. Calcium-binding protein immunoreactivity was also evident within the neuropil of the cingulate cortex (Fig. 7, Tables 3, 4 and 5).
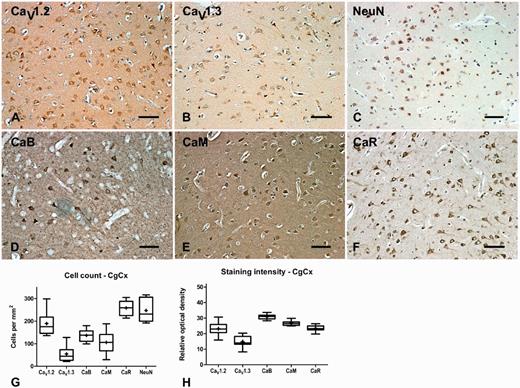
Representative immunohistochemistry staining and quantification in cingulate cortex of normal brain. Representative immunohistochemistry of CaV1.2 (A), CaV1.3 (B), neuronal nuclei (NeuN, C), calbindin (CaB, D), calmodulin (CaM, E) and calreticulin (CaR, F) in cingulate cortex of normal brain showing labelling of pyramidal and multipolar neurons in this region. Box and whisker plots of stereological cell counts (G) and densitometry of relative staining intensity (H) in the cingulate cortex (CgCx). Box = 25th and 75th percentiles; line = median; + = mean; whiskers = 5th and 95th percentiles. Scale bar = 100 µm.
Double staining experiments indicated that CaV1.2 and CaV1.3 were present on glutamatergic and GABAergic pyramidal neurons as well as microglia in the cingulate cortex (Fig. 5).
Parkinson’s disease
Cell counts
The number of pyramidal cells that expressed CaV1.3 was increased by 94% in cases with late Parkinson’s disease, while CaV1.2 cell numbers were unchanged. The percentage ratio of CaV1.2 to CaV1.3 expression in early and late Parkinson’s disease was 83:17 and 66:34, respectively. The number of pyramidal cells that expressed calmodulin in the cingulate cortex was reduced by 38% in cases with late Parkinson’s disease (Tables 3 and 5).
Optical density
The staining intensity of CaV1.3 in the cingulate cortex was increased by 55% in late Parkinson’s disease, which reflected the increase in cell counts in the region, whereas CaV1.2 did not significantly change. Again, this suggested that the individual cellular expression of CaV1.3, or that present in the neuropil had increased. The percentage ratio of CaV1.2 to CaV1.3 expression in each experimental group was more even than that found in normal brain. The staining intensity of calreticulin increased in the cingulate cortex in both early (30%) and late (22%) Parkinson’s disease (Tables 4 and 5).
Primary motor cortex
Normal brain
In primary motor cortex CaV1.2 and CaV1.3 immunoreactivity was present on pyramidal cells in all layers. Most positive cells were found in layers II, III and IV, where the estimated density was 109 ± 11 and 131 ± 10 cells/mm2 for CaV1.2 and CaV1.3, respectively (Fig. 8 and Table 3). The percentage ratio of CaV1.2 to CaV1.3 expression was 45:55. CaV1.2 and CaV1.3 immunoreactivity was also evident in the neuropil of the primary motor cortex, where the percentage ratio of staining intensity was 61:39. Calbindin, calmodulin and calreticulin immunoreactivity was also present on pyramidal cells in all layers of the primary motor cortex with an estimated density in layers II, III and IV of 57 ± 9, 98 ± 15 and 158 ± 13 cells/mm2 for calbindin, calmodulin and calreticulin antibodies, respectively. Calcium-binding protein immunoreactivity was also evident in the neuropil of the primary motor cortex (Fig. 8, Tables 3, 4 and 5).
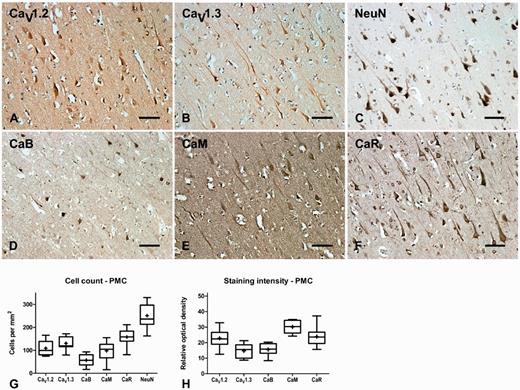
Representative immunohistochemistry staining and quantification in primary motor cortex of normal brain. Representative immunohistochemistry of CaV1.2 (A), CaV1.3 (B), neuronal nuclei (NeuN, C), calbindin (CaB, D), calmodulin (CaM, E) and calreticulin (CaR, F) in primary motor cortex (PMC) of normal brain showing labelling of pyramidal and multipolar neurons in this region. Box and whisker plots of stereological cell counts (G) and densitometry of relative staining intensity (H) in the primary motor cortex. Box = 25th and 75th percentiles; line = median; + = mean; whiskers = 5th and 95th percentiles. Scale bar = 100 µm.
Parkinson’s disease
Cell counts
The number of pyramidal cells that expressed all antibodies was unchanged in Parkinson’s disease and the percentage ratio of CaV1.2 to CaV1.3 expression remained similar (Tables 3 and 5).
Optical density
The intensity of CaV1.2 staining in the primary motor cortex was unaltered across all experimental groups, whereas the intensity of CaV1.3 staining increased in early (93%) and late (51%) Parkinson’s disease. The percentage ratio of CaV1.2 to CaV1.3 expression in cases with both early and late Parkinson’s disease was more even compared with control cases. Despite no change in the number of calbindin-positive cells, there was an increase in the staining intensity of calbindin in cases with early (68%) and late (47%) Parkinson’s disease. The intensity of calmodulin staining was increased by 18% in cases of early Parkinson’s disease and the intensity of calreticulin increased by 30% in cases with late Parkinson’s disease despite no alteration in the number of cells that expressed calmodulin or calreticulin in the primary motor cortex (Tables 4 and 5).
Spinal cord
Normal brain
In the ventral horn of the lumbar spinal cord CaV1.2 immunoreactivity was present throughout the cytoplasm and proximal processes of α-motor neurons, whereas CaV1.3 immunoreactivity was concentrated around the apical region of cell processes, with light staining surrounding the nucleus. The density of CaV1.2 and CaV1.3 positive α-motor neurons in the ventral horn of the lumbar spinal cord was 58 ± 8 and 49 ± 8 cells/mm2, respectively. The percentage ratio of CaV1.2 to CaV1.3 expression was 54:46. CaV1.2 and CaV1.3 immunoreactivity was also evident in the neuropil of the ventral horn of the lumbar spinal cord, where the ratio of CaV1.2 to CaV1.3 expression was 60:40. In the ventral horn of the lumbar spinal cord, α-motor neurons stained positive for calbindin, calmodulin and calreticulin with densities of 23 ± 4, 61 ± 7, and 63 ± 9 cells/mm2, respectively. Staining of α-motor neurons was light for calbindin and some α-motor neurons were negative for calbindin, but strong calbindin staining was evident in dendrites and in small round (non-nucleated) spots that were presumed to be transected neurons. The neuropil was lightly stained by the calbindin antibody. The α-motor neuron perikarya and main processes stained strongly for calmodulin and calreticulin as did the surrounding neuropil and dendrites with each of these antibodies (Fig. 9, Tables 3, 4 and 5).
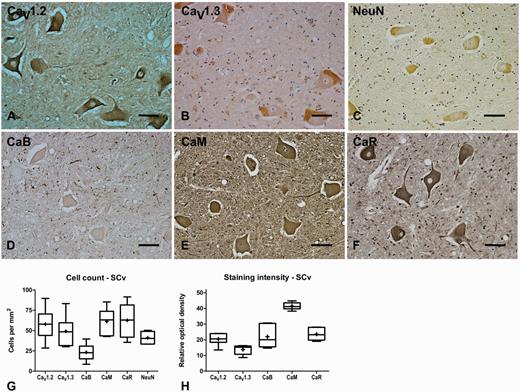
Representative immunohistochemistry staining and quantification in the ventral horn of normal spinal cord. Representative immunohistochemistry of CaV1.2 (A), CaV1.3 (B), neuronal nuclei (NeuN, C), calbindin (CaB, D), calmodulin (CaM, E) and calreticulin (CaR, F) in normal ventral horn of the lumbar spinal cord (SCv) showing labelling of α-motor neurons in this region. Box and whisker plots of stereological cell counts (G) and densitometry of relative staining intensity (H) in the ventral horn of the lumbar spinal cord. Box = 25th and 75th percentiles; line = median; + = mean; whiskers = 5th and 95th percentiles. Scale bar = 100 µm.
Parkinson’s disease
Cell counts
The number of α-motor neurons in the ventral horn of the lumbar spinal cord that expressed CaV1.2 and CaV1.3, was not significantly different in all experimental groups. However, the percentage ratio of CaV1.2 to CaV1.3 expression showed increased CaV1.3. The number of α-motor neurons in the ventral horn of the lumbar spinal cord that expressed calbindin was increased in late Parkinson’s disease by 94% (Tables 3 and 5).
Optical density
The staining intensity of CaV1.2 did not change in the ventral horn of the lumbar spinal cord, but the intensity of CaV1.3 staining increased by 19% in late Parkinson’s disease, despite no change in the numbers of cells expressing CaV1.3 in this area. The percentage ratio of CaV1.2 to CaV1.3 expression in each experimental group was similar to that found in control cases. Mirroring the increase in the number of cells that expressed calbindin, the intensity of calbindin staining increased in late Parkinson’s disease by 44% (Tables 4 and 5).
Motor complications and CaV1 subtype expression
There was little difference in the results obtained when the subjects with Parkinson’s disease were segregated into those with low or high levels of motor complications. That is, where significant changes between Parkinson’s disease and control values were observed, they most often occurred in both the low and high motor complication groups to the same extent (Tables 3 and 4). The only significant exception was in the nucleus basalis of Meynert where cases with low incidence of motor complications had 43% and 42% more tyrosine hydroxylase than was present in control and high motor complication cases, respectively. Furthermore, there was no overall difference in the ratio of CaV1.2 to CaV1.3 when considering the number of immunopositive neurons or the intensity of immunostaining (Table 5).
Discussion
This study quantified expression of the CaV1 subtypes found in brain in areas vulnerable and more resistant to neurodegeneration in Parkinson’s disease in normal and Parkinson’s disease brains. Unbiased cell counting and densitometry of brain sections stained by immunohistochemistry indicated that there are regional differences in the expression of CaV1 subtypes in normal brain, which altered significantly in Parkinson’s disease. Particularly, in Parkinson’s disease there was an increase in CaV1 subtype expression that precedes Parkinson’s disease pathology and throughout parkinsonian brain there was a change in the ratio of CaV1.2 versus CaV1.3 to favour a greater utilization of CaV1.3 channels, which could render neurons susceptible to excitotoxicity or oxidative stress.
The cell count data were comparable with previous studies that have quantified cell numbers in cortex, midbrain and brainstem using traditional and stereological cell counting techniques, which validates the cell counts obtained (Armstrong et al., 1990; Fearnley and Lees, 1991; Saper et al., 1991; Huang et al., 1993a, b; Muthane et al., 1998; Ma et al., 1999; Marner et al., 2005; Pedersen et al., 2005; Alladi et al., 2009; Eriksen et al., 2009). However, immunohistochemistry has limitations when coupled with stereological cell counting or densitometry measurements. For stereological counting a cell was considered positive if staining was darker than the surrounding neuropil. Thus, reduced expression may result in a cell being considered negative because it had similar staining to the neuropil, which would result in a reduced cell count, in the absence of actual cell loss. Reduced cell counts can therefore arise from actual cell loss (e.g. dead dopamine neuron) and decreased expression below the detection threshold. Likewise, increased expression could result in an increase in apparent cell number without actual neurogenesis having occurred. Similarly, in the case of optical density measurements, alterations in expression levels in perikarya and neuropil could result in seemingly conflicting data. This is exemplified for tyrosine hydroxylase in the substantia nigra, where despite a reduction in the number of tyrosine hydroxylase-positive cells, the intensity of staining did not significantly reduce. This was because there was increased staining (upregulated tyrosine hydroxylase expression) in perikarya and dendrites of surviving neurons. Another caveat of immunohistochemistry is that a proportion of staining could include nascent or internalized non-functional channels, since the epitope of the peptide used to generate the antibody was not dependent upon the conformation of a functioning channel. In addition, although cell counts are directly comparable between different antibodies, the nature of antibody protein interactions mean that the staining intensity values are not directly comparable between different antibodies.
In control brain there was no pattern of neurons utilizing CaV1 subtypes that correlates with neuronal vulnerability in Parkinson’s disease, indeed the highest density of neurons expressing CaV1.3 was in the cingulate cortex, which is only affected in the later stages of Parkinson’s disease. Furthermore, the relative neuronal utilization of CaV1.3 to CaV1.2 does not correlate with neuronal vulnerability; the substantia nigra pars compacta has one of the lowest CaV1.3 to CaV1.2 ratios, yet this area undergoes marked neurodegeneration.
However, in Parkinson’s disease brain as a whole, there was a generalized shift towards a greater expression and therefore presumably use of CaV1.3 channels, which could over time endanger neuronal survival. The findings in the Parkinson’s disease brain followed one of three patterns. First, in areas like the substantia nigra pars compacta and nucleus basalis of Meynert, that are affected in the early α-synuclein Braak stages of Parkinson’s disease, the reductions in CaV1.2- and CaV1.3-positive neurons reflects the loss of neurons. However, in the remaining neurons there was a greater expression and therefore presumed use of the CaV1 subtypes, particularly CaV1.3. Although such changes may reflect increased neuronal activity to compensate for the loss of adjacent neurons, they will leave the remaining neurons exposed to higher influxes of calcium. The second pattern of change in the Parkinson’s disease brain was an upregulation of CaV1.3 expression in the locus coeruleus, which occurred despite falling tyrosine hydroxylase-positive neuronal numbers. The third pattern of change observed in the Parkinson’s disease brain occurred in the cingulate cortex and primary motor cortex where the expression of CaV1.3 increased in the neuropil and a greater number of neurons became positive for CaV1.3. In all cases the net result would be increased calcium influx, which would result in an increased energetic burden on the cell. Importantly, the putative increase in calcium flux caused by altered CaV1 subtype expression is not always counteracted by increased expression of calcium-binding proteins, which will also render the neurons more vulnerable to calcium-mediated excitotoxic damage.
Because Parkinson’s disease pathology is first detected in the brainstem and then found in the neocortex as the disease progresses, the cases were divided for analysis into early (3 and 4) and late (5 and 6) α-synuclein Braak stages in order to determine whether changes in CaV1 subtypes were a consequence of the Parkinson’s disease pathology or preceded it. Consequently, regions where pathology was expected in early cases were contrasted with those that become affected late in Parkinson’s disease. Unfortunately, α-synuclein Braak stage 1 and 2 material was not available for use in this study. The finding that alterations in CaV1.3 and calcium-binding proteins occurred in cortex in cases with early Parkinson’s disease supports the view that disturbed calcium homeostasis is an early feature of the pathogenesis of Parkinson’s disease and not just a consequence of the neurodegenerative process. However, such a conclusion assumes that the cases with early Parkinson’s disease used in this study would have progressed to late stage Parkinson’s disease. Although the cases with early Parkinson’s disease would undoubtedly have had their disease progress had they lived, one could not predict what form of the disorder (i.e. pure Parkinson’s disease or Parkinson’s disease with dementia etc.) they would eventually suffer from, which is evident from the neuropathological scoring shown in Table 1. Altered CaV1.3 expression may, therefore, be related to the neurodegenerative process in Parkinson’s disease itself, rather than a consequence of the Parkinson’s disease pathology. In most instances the alterations in CaV1 subtype expression occurred in cases with both early and late stage Parkinson’s disease, that is the altered expression was not progressing with the disease. It is therefore possible that individuals expressing high levels of CaV1.3 channels are predisposed to Parkinson’s disease, a view that is supported by the examination of CaV1 subtype ratios (see below). Examination of α-synuclein Braak stage 1 and 2 or presymptomatic cases would shed some further light onto whether Parkinson’s disease is generally associated with increased expression of CaV1.3 or whether this is a consequence of the pathology. Additionally, CaV1 subtype channels have been implicated in Alzheimer’s disease and dihydropyridines have been posited as potential treatments for Alzheimer’s disease (Anekonda and Quinn, 2011). Although not specifically examined in this study, it would be of interest in future work to correlate the expression of CaV1 subtype channels and calcium-binding proteins with cell loss and phospho-tau, amyloid-β and α-synuclein immunoreactivity scores throughout the brain. As all cases with Parkinson’s disease were receiving l-DOPA and other anti-parkinsonian medication at the time of death it cannot be excluded that the changes observed were a consequence of these treatments. But this seems unlikely since some of the changes are not observed in the cases with early Parkinson’s disease despite these patients receiving several years of dopaminergic therapy, which suggests that Parkinson’s disease and not exposure to dopaminergic therapies caused the observed changes.
The view that the alterations in CaV1 expression relate to the pathogenesis of Parkinson’s disease and are not just compensatory changes to cell loss is supported by examination of the ratios of CaV1 subtype expression. The difference in the ratio of CaV1.2 to CaV1.3 in Parkinson’s disease compared to that found in normal brain appears independent of cell loss for it was found in regions where there was no overt cell loss observed and the ratios were maintained in those areas where there is cell loss. The original immunohistochemistry and radioligand binding experiments conducted using rat brain found the percentage of CaV1.3 to be ∼20% of the total number of CaV1 subtypes (Hell et al., 1993). Recently, using mouse knockout models and quantitative real-time reverse transcriptase PCR, Sinnegger-Brauns et al. (2009) found the percentage of CaV1.3 transcripts in brain to be 10.7%. In contrast, the average ratio of isoforms for principal neurons in control human brain in this study was 58:42 for cell counts and 57:43 for staining intensity measurements. The reason for this difference, other than species differences, could relate to the antibody detecting non-functional channels whereas the other studies used radioligands that would bind to a functional channel or examined messenger RNA. In Parkinson’s disease the average ratio became more even between CaV1 subtypes, thus favouring a greater utilization of CaV1.3 when the brain was taken as a whole or when divided into areas susceptible to cell loss and those where cell loss does not occur (Table 5). It seems therefore that CaV1.3 expression is relatively higher throughout the brain in Parkinson’s disease compared with CaV1.2, which adds credence to the theory that CaV1.3 is a critical factor in what makes neurons vulnerable to neurodegeneration in Parkinson’s disease (Chan et al., 2007). In pyramidal cortical neurons or striatal spiny neurons, which are not susceptible in Parkinson’s disease, CaV1.3 channels only activate episodically and do not exhibit autologous pacemaking (Surmeier et al., 2012). Such neurons therefore survive, despite having the comparatively higher level of CaV1.3 expression in Parkinson’s disease. If this altered ratio of CaV1.2 to CaV1.3 is indeed a general feature of all cells in patients with Parkinson’s disease, it may open the possibility of measuring CaV1.2:CaV1.3 ratios in for example lymphocytes (which express both channels) and using this as a biomarker of Parkinson’s disease. Clearly, further work, such as quantitative PCR of CaV1 subtypes in human brain neurons and other cell types, is required to confirm whether this is indeed the case.
This study cannot provide a reason why CaV1 subtypes are unpregulated in Parkinson’s disease, but one of the many functions of CaV1 subtypes is to allow calcium entry into dendrites to enable control of the initiation of an action potential (Higley and Sabatini, 2012). Increased CaV1 subtype expression may therefore be a means to compensate for the altered activity of neuronal circuits that results from the striatal denervation that occurs in Parkinson’s disease. Burst firing of basal ganglia output neurons increases in Parkinson’s disease, through NMDA receptor and calcium-activated non-selective cation current mechanisms, which renders dopamine neurons more susceptible to excitotoxicity and it is conceivable that CaV1 subtypes are also involved in this process (Johnson et al., 1992; Obeso et al., 2008; Mrejeru et al., 2011).
Studies that have examined the role of CaV1 subtypes in dyskinesia have indicated that although not effective at directly reducing established dyskinesia in rodent models, CaV1 subtype antagonists can reduce dyskinesia indirectly, if given early, through the prevention of dendritic spine loss (Schuster et al., 2009; Soderstrom et al., 2010). That CaV1 subtypes are not directly involved in the motor complications associated with the treatment of Parkinson’s disease with l-DOPA and directly acting dopamine agonists is supported by the data of this study when the cases were analysed with respect to motor complications. Namely, similar alterations in CaV1 subtypes were found in brain from cases with low or high levels of motor complications, suggesting that CaV1 subtypes are not a cause of motor complications, although this does not exclude them from a role in their manifestation.
The CaV1.2 subtype is subject to proteolysis, cleaving the C-terminal, resulting in modulation of channel expression, function and degradation (Abele and Yang, 2012). The main protease responsible is calpain-like and a member of the calpain protease family has been reported to be increased in dopamine neurons in Parkinson’s disease (Mouatt-Prigent et al., 1996). It is unknown whether CaV1.3 function is also regulated by calpain-like protease activity, but conceivably increased calpain proteases could be a mechanism that increases the cells reliance on CaV1.3 over CaV1.2. Cleaved CaV1.2 resembles the truncated CaV1.3 isoforms that are generated by alternative splicing. Novel short splice variants of the CaV1.3 have been described, which show differential expression in mouse brain and have different kinetics and/or signalling pathways to the full-length channel (Bock et al., 2011; Tan et al., 2011). The CaV1 subtype antibodies used in this study recognized the carboxy terminus region and would therefore not detect truncated forms of the channels. Studies that investigate the expression of alternative transcripts of CaV1.3 in human brain are therefore warranted to determine whether they are involved in Parkinson’s disease.
With regard to calcium-binding proteins, the rationale for examining them was based upon their putative role in buffering intracellular calcium concentrations to prevent excitotoxicity. However, they have other functions that could be relevant to Parkinson’s disease. Calmodulin and α-synuclein interact in cells in a calcium-dependent manner to regulate dopamine release (Martinez et al., 2003), whereas calreticulin in the endoplasmic reticulum plays a critical role in protein-folding and is associated with transglutaminase, which has been implicated in the formation of α-synuclein aggregates in Parkinson’s disease brain (Feng et al., 1999; Wilhelmus et al., 2011). The calbindin 1 gene has been identified as a risk factor for Parkinson’s disease in a Japanese population, but not in Caucasian patients with Parkinson’s disease (Mizuta et al., 2008; Soto-Ortolaza et al., 2010). This study found that calcium-binding proteins were reduced in cells bodies of neurons in areas where α-synuclein aggregates occur in Parkinson’s disease. Mosharov et al. (2009) demonstrated an interplay between CaV1 subtypes, cytoplasmic dopamine concentrations and α-synuclein in substantia nigra pars compacta dopamine neurons and suggested that this explained why some neurons are more vulnerable than others to neurodegeneration. In the absence of pathological mutations in α-synuclein, a decrease in the level of molecular partners required for normal function of α-synuclein (i.e. calcium-binding proteins), might explain the occurrence of α-synuclein aggregates in idiopathic Parkinson’s disease.
In summary this study has shown that (i) CaV1 subtype expression is altered in Parkinson’s disease before the appearance of pathology, which suggests a role in the disease process itself; and (ii) the relative expression of CaV1.3 to CaV1.2 is increased throughout the Parkinson’s disease brain. Both findings would result in increased calcium flux in cells and could therefore contribute to the oxidative stress and excitotoxicity that occurs in Parkinson’s disease.
Acknowledgements
Tissue samples and associated clinical and neuropathological data were supplied by the Parkinson's UK Tissue Bank, funded by Parkinson’s UK, a charity registered in England and Wales (258197) and in Scotland (SC037554).
Funding
The Cure Parkinson’s Trust UK (registered charity number 1111816) funded this work.
Supplementary material
Supplementary materialis available at Brain online.

