


Abstract
Huntington’s disease is a fatal human neurodegenerative disorder caused by a CAG repeat expansion in the HTT gene, which translates into a mutant huntingtin protein. A key event in the molecular pathogenesis of Huntington’s disease is the proteolytic cleavage of mutant huntingtin, leading to the accumulation of toxic protein fragments. Mutant huntingtin cleavage has been linked to the overactivation of proteases due to mitochondrial dysfunction and calcium derangements. Here, we investigated the therapeutic potential of olesoxime, a mitochondria-targeting, neuroprotective compound, in the BACHD rat model of Huntington’s disease. BACHD rats were treated with olesoxime via the food for 12 months. In vivo analysis covered motor impairments, cognitive deficits, mood disturbances and brain atrophy. Ex vivo analyses addressed olesoxime’s effect on mutant huntingtin aggregation and cleavage, as well as brain mitochondria function. Olesoxime improved cognitive and psychiatric phenotypes, and ameliorated cortical thinning in the BACHD rat. The treatment reduced cerebral mutant huntingtin aggregates and nuclear accumulation. Further analysis revealed a cortex-specific overactivation of calpain in untreated BACHD rats. Treated BACHD rats instead showed significantly reduced levels of mutant huntingtin fragments due to the suppression of calpain-mediated cleavage. In addition, olesoxime reduced the amount of mutant huntingtin fragments associated with mitochondria, restored a respiration deficit, and enhanced the expression of fusion and outer-membrane transport proteins. In conclusion, we discovered the calpain proteolytic system, a key player in Huntington’s disease and other neurodegenerative disorders, as a target of olesoxime. Our findings suggest that olesoxime exerts its beneficial effects by improving mitochondrial function, which results in reduced calpain activation. The observed alleviation of behavioural and neuropathological phenotypes encourages further investigations on the use of olesoxime as a therapeutic for Huntington’s disease.
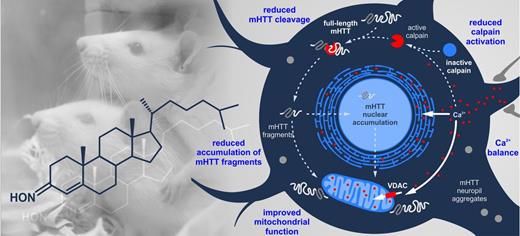
Clemens et al. investigate the therapeutic potential of the mitochondria-targeting drug candidate, olesoxime, in the BACHD rat model of Huntington’s disease. Treatment strongly reduces the calpain-mediated proteolytic cleavage of mutant huntingtin, a key event in the molecular pathogenesis of the disease, and mitigates neuropathological and behavioural abnormalities in rats.
Introduction
Huntington’s disease, a fatal human neurodegenerative disorder, results from a CAG repeat expansion in exon 1 of HTT (The Huntington’s Disease Collaborative Research Group, 1993). The mutation translates into an elongated polyglutamine tract close to the N-terminus of the mutant huntingtin protein (HTT) (Persichetti et al., 1995). Patients with Huntington’s disease suffer from a broad range of symptoms including motor, psychiatric, cognitive and metabolic disturbances (Vonsattel and DiFiglia, 1998), which are associated with neuronal dysfunction, and the selective degeneration of cortical and striatal projection neurons (Tabrizi et al., 2011; Poudel et al., 2014).
The intrinsic toxicity of mutant HTT has been linked to the formation of N-terminal protein fragments (Rigamonti et al., 2000; Nagai et al., 2007; Wang et al., 2008). These fragments interfere with important intracellular pathways (Zuccato et al., 2010), accumulate in the nucleus (Landles et al., 2010), and form protein aggregates in nucleus and cytoplasm (Cooper et al., 1998; Li and Li, 1998), which is a hallmark of Huntington’s disease (Gutekunst et al., 1999). Mutant HTT fragments derive from proteolytic cleavage of the full-length protein. Several classes of proteolytic enzymes have been identified to mediate this process, including calpains (Gafni and Ellerby, 2002), caspases (Goldberg et al., 1996), cathepsins (Kim et al., 2006) and matrix metalloproteinases (Miller et al., 2010). Calpains, which play a general role in neurodegenerative processes (Yang et al., 2013), are overactivated in Huntington’s disease (Gafni and Ellerby, 2002), and inhibition of the calpain-mediated cleavage of mutant HTT has been found to ameliorate Huntington’s disease-related pathologies (Gafni et al., 2004).
Calpains are activated in response to cytosolic Ca2+ currents (Goll et al., 2003), and Ca2+ homeostasis is disrupted at several levels in Huntington’s disease (Miller and Bezprozvanny, 2010). Moreover, Ca2+ derangements have been considered to be causal for the neuronal damage in Huntington’s disease, as the selective demise of vulnerable neurons is thought to result from their particular sensitivity to excitotoxicity, which is characterized by intracellular Ca2+ overload and subsequent cell death (Fan and Raymond, 2007). Mitochondria are particularly involved in this process, as they are crucial for maintaining low intracellular Ca2+ levels, and pivotal for triggering cell death programs when their buffering capacity is exhausted (Calì et al., 2012). Mutant HTT affects mitochondrial function by directly binding to the outer mitochondrial membrane (Panov et al., 2002; Choo et al., 2004; Rockabrand et al., 2007; Gellerich et al., 2008; Wang et al., 2009) and by disturbing the transcription of nuclear-encoded mitochondrial effector genes (Bae et al., 2005; Cui et al., 2006). As a consequence, mitochondrial Ca2+ handling ability is impaired, making cells more susceptible to excitotoxic insults (Panov et al., 2003; Tang et al., 2005).
The current study was designed to evaluate the therapeutic potential of the orphan drug candidate, olesoxime (Bordet et al., 2007), on disease-related phenotypes of the BACHD rat model of Huntington’s disease (Yu-Taeger et al., 2012). Olesoxime is a small cholesterol-like molecule that accumulates at the site of mitochondria (Bordet et al., 2010). Olesoxime’s mechanism of action is not fully understood, although it has been shown to inhibit mitochondrial permeability transition (Bordet et al., 2010; Gouarné et al., 2013, 2015), which is a Ca2+-sensitive process that can trigger cell death (Lemasters et al., 2009). Olesoxime has demonstrated therapeutic efficacy in several neurodegenerative diseases (Bordet et al., 2007; Sunyach et al., 2012; Eckmann et al., 2013; Richter et al., 2014) and peripheral neuropathies (Bordet et al., 2008; Xiao et al., 2009, 2012; Rovini et al., 2010), and just recently yielded impressive beneficial effects on motor function in a phase II clinical trial in patients with spinal muscular atrophy (Dessaud et al., 2014).
Here, we found that olesoxime treatment ameliorated psychiatric and cognitive abnormalities in the BACHD rat. The treatment further increased their frontal cortex thickness and improved mitochondrial function. Prominently, it appeared that the main effect of olesoxime was to reduce Huntington’s disease-related calpain overactivation. Thereby, the formation of mutant HTT fragments was drastically decreased. This yet undiscovered function opens a new view on olesoxime’s mechanism of action, and highlights it as a novel tool for reducing calpain activation and the accumulation of toxic mutant HTT fragments.
Materials and methods
Ethical statement
Behavioural experiments were performed at the University of Tuebingen, by individuals with appropriate training and experience. Experiments were approved by the local ethics committee at Regierungspraesidium Tuebingen, and carried out in accordance with the German Animal Welfare Act and the guidelines of the Federation of European Laboratory Animal Science Associations, based on European Union legislation (Directive 2010/63/EU).
The BACHD rat
The BACHD rat of line TG5 [Crl:CD(SD)-Tg(HTT*97Q)21.2Hpn/Hpn], hereafter referred to as the BACHD rat, overexpresses full-length HTT with 97 CAA/CAG repeats on a BAC (bacterial artificial chromosome) (Yu-Taeger et al., 2012). The construct has previously been used to generate the BACHD mouse (Gray et al., 2008).
General husbandry and genotyping
All rats were bred at the University of Tuebingen and study groups derived from a total of 24 different breedings to reduce possible litter bias. Male BACHD rats, hemizygous for mutant HTT, and male wild-type littermates from respective breedings were spread across study groups. The rats were weaned and genotyped at 21 days of age. Genotyping was confirmed at the end of the study when the animals were sacrificed, and followed established protocols (Yu-Taeger et al., 2012). From weaning onwards, the animals were kept in autoclavable plastic cages with high lids (38 cm × 55 cm wide × 24.5 cm high). Cages contained 3 l of autoclaved wooden bedding and were cleaned twice a week. Food (initially standard rat chow: Ssniff V1534-000, SSNIFF Germany, later changed to: Altromin C1000, Altromin; details in the next section) and tap water were delivered ad libitum. Housing conditions followed the European Convention for the Protection of Vertebrate Animals used for Experimental and other Scientific Purposes (ETS 123, Appendix A: Guidelines for accommodation and care of animals). The environmental conditions in the housing room were kept at 21–23°C ambient temperature, 55 ± 10% humidity and a 12/12 h light/dark cycle with lights off at 1:00 p.m. and lights on at 1:00 a.m. during winter, or with lights off at 2:00 p.m. and lights on at 2:00 a.m. during summer.
Olesoxime treatment and experimental groups
The study included two cohorts of rats. Cohort I served a longitudinal study to assess the treatment effect on relevant behavioural, neuropathological and molecular phenotypes (Supplementary Fig. 1). This cohort was composed of 30 wild-type (15 treated, 15 non-treated) and 30 BACHD rats (15 treated, 15 non-treated), kept in groups of four of mixed genotype (two wild-type rats and two BACHD rats per cage). Two weeks after weaning (5 weeks of age), food was changed from regular rodent chow (as stated above) to either control diet or the same diet loaded with 0.6 mg/g olesoxime (provided by Trophos SA). Behavioural characterization was carried out until the age of 13 months and was followed by MRI and post-mortem analyses.
Cohort II was used for the measurement of olesoxime concentration in plasma and brain as well as its distribution in different brain areas (nine olesoxime-treated and three non-treated control animals per genotype). These rats were kept in groups of three of the same genotype. Olesoxime-containing or control diet was administered for 2 weeks starting at the age of 4 months.
Body weight and food intake were measured as safety parameters for the olesoxime treatment. Body weight was measured weekly. For food intake measurements, the rats were housed individually for 70 h in an automated behavioural test system (PhenoMaster, TSE Systems) at 2, 4, 6, 8 and 12 months of age. Test protocol, system specifications and data analysis were the same as described in detail in Clemens et al. (2014).
Clasping behaviour
Clasping behaviour was investigated as a measure of a striatum-based motor dysfunction (Soll et al., 2013). To detect hind limb clasping, each animal was lifted on its tail for ∼2 s. The test was performed weekly from 5 weeks until the age of 10 months (33 observations). The clasping frequency in per cent of all observations was analysed.
Rotarod test
The animals were trained to walk on an accelerating rod (Rat Rotarod 7750, Ugo Basile) to assess fore limb/hind limb coordination at 2, 4 and 8 months of age as a measure of striatum-based motor dysfunction (Bergeron et al., 2014). Rats were given four daily trials at 2 months of age, or three daily trials at older ages, during a total of five consecutive days. Trials were separated by 1-h intervals. The experiments were run during the dark phase. During the first 3 days, the rats were trained to a stable performance. At this stage, the maximum rotation speed of the rod was set to 12 rpm (increasing from 2 to 12 rpm over 30 s), and trials lasted either 120 s, or until the rat had fallen off the rod a total of five times. The number of falls served as the performance readout. On the last 2 days, the rats’ maximum motor capacity was tested. For this, the rotation speed of the rod increased from 4 to 40 rpm over 240 s and the trials lasted either 300 s or until the rat had fallen off the rod for a total of five times. The total amount of time the animals spent on the rod (excluding the time spent not running during falls) was measured and analysed as the animals’ running capacity. The number of rats included in the analysis decreased, as an increasing number of particularly BACHD rats refused to stay on the rod at older ages (as discussed previously in Yu-Taeger et al., 2012; Abada et al., 2013b).
Simple swim test
At the age of 7 months, cognitive abilities were investigated using a simple swim test. The animals were trained to swim to a hidden platform placed at one end of a rectangular water tank of 150 × 25 × 40 cm (adapted from Van Raamsdonk et al., 2005). Training was carried out in dimmed red light during the dark phase, alternating between cages with placebo- and olesoxime-treated rats. During an initial training phase, the animals were placed into the middle of the tank facing away from the platform, forcing them to turn around to reach it. The training was carried out on two consecutive days in 3 × 3 trials on the first and three trials on the following day. On the third day, the platform was repositioned to the opposite side (‘reversal’) and the rats’ performance was measured again on two consecutive days. In this reversal training, the rats needed to swim straight ahead in order to reach the platform. The rats were trained in 3 × 3 trials on the first day and three trials on the second day. Individual blocks of trials were separated by 1 h. The water was kept at room temperature, and coloured with non-toxic black paint (Marabu Fingerfarbe). The water tank was virtually divided into four areas: the starting area, the area opposite to the platform, the area towards the platform, and the platform. The trials were videotaped and tracked using TSE VideoMot 2 equipment (TSE Systems). Raw data on time and distance covered before reaching the platform as well as swim speed were exported from the software, sorted according to genotype and treatment, and analysed as average values for each block of three trials, using a script for R statistics developed at the University of Tuebingen.
Elevated plus maze
The rats’ preference for exploring the closed rather than the open arms of an elevated plus maze was assessed as a measurement of anxiety-like behaviour at 13 months of age. The setup comprised four arms (12-cm wide and 42-cm long), connected by a 12 × 12 cm central area. Two of the arms were enclosed by 42-cm high walls (closed arms), while the other two arms had no walls (open arms). The arena was positioned 52 cm above ground. The experimental room was lit with white light, leaving the open arms exposed to light, while the closed arms remained substantially darker. The test was carried out for all rats on one day during the early dark phase, and cages with placebo- and olesoxime-treated rats were tested in an alternating order. At the start of each trial, a rat was placed inside the central area of the maze, facing one of the open arms, and allowed to freely explore the maze for a total of 5 min. The time spent in the open arms of the elevated plus maze was measured and subsequently analysed as per cent of the total trial duration.
Magnetic resonance imaging
MRI was performed at the Werner Siemens Imaging Center (Tuebingen, Germany). For this purpose, the rats were anaesthetized with 2% isoflurane and maintained at 1.2% vaporized in 100% O2 at a flow rate of 1.5 l/min. Body temperature and ventilation rate were monitored throughout the MRI acquisition, with body temperature kept in the stable range of 37 ± 0.5°C. Anatomical T2-weighted images were acquired with a rat brain surface coil using a 3D-spoiled turbo spin echo sequence (256 × 160 matrix, 25 × 25 mm2 field of view, repetition time = 3000 ms, echo time = 205 ms, slice thickness = 0.22 mm). For MRI data evaluation, image analysis was performed using Inveon Research Workplace software (Siemens Healthcare) and referring to the rat brain atlas (The Rat Brain in Stereotaxic coordinates, 6th edition, 2006). Size differences in whole brain, cerebellum and striatum were determined with high accuracy by measuring the respective volume, as these brain regions have a clear delimitation in MRI. By contrast, differences in the size of the cerebral cortex were evaluated more accurately by measuring the thickness of the frontal part at −1.56 mm relative to bregma at the most dorsal point of the corpus callosum.
Measurement of olesoxime concentration
The concentration of olesoxime in plasma and brain samples was measured via HPLC-MS at Trophos SA using the Alliance® HPLC System (Waters S.A.S.). Samples were collected as explained below and thawed at room temperature. Plasma was mixed with 150 µl of acetonitrile, vortexed for 10 s and centrifuged for 10 min at 13 200g. Brain tissue was first homogenized at a concentration of 1 g/ml in Hank’s balanced salt solution (10 mM HEPES, 141 mM NaCl, 4 mM KCl, 28 mM CaCl2, 1 mM MgSO4, 1 mM NaH2PO4). Homogenates were then mixed with 300 µl dichloromethane, vortexed for 10 s and centrifuged for 10 min at 13 200g. The organic phase was collected, evaporated at low pressure and 40°C and resolubilized in 110 µl acetonitrile. Assays were run once. Calculations were performed against a calibration curve prepared from olesoxime-spiked, normal rat plasma or brain homogenate, respectively.
Blood sampling
Blood was collected from rats of Cohort I during the longitudinal study at 3, 6, 9 and 13 months of age, and from rats of Cohort II after 2 weeks of olesoxime treatment at 4 months of age. For Cohort I, blood was collected by puncturing the animals’ tail veins (the procedure did not require anaesthesia), while for Cohort II, blood was sampled retro-orbitally post-mortem. In either case, sampling was carried out within 2 h during the late light phase to minimize variation based on circadian rhythms. Blood was collected into EDTA-coated tubes on ice. Samples were centrifuged at 1500g for 10 min, plasma was removed, transferred into cryotubes and stored at −80°C.
Brain tissue sampling
For immunohistochemical techniques, the rats were deeply anaesthetized with an intraperitoneal injection of ketamin/xylazin (100 mg/kg or 5–8 mg/kg, respectively) and perfused transcardially with 4% paraformaldehyde in phosphate-buffered saline (pH 7.4). Brains were removed and stored at 4°C in 0.5% paraformaldehyde in phosphate-buffered saline (pH 7.4).
For all other analyses, the animals were sacrificed by CO2 inhalation. Brains were immediately dissected on ice and whole brain, or brain regions, were sampled. Tissue was shock-frozen in liquid nitrogen and either stored at −80°C or immediately processed to obtain live mitochondria for high-resolution respirometry. Tissue sampling was performed within 2 h during the late light phase to minimize variation based on any circadian phase-related changes.
Isolation of mitochondria and high resolution respirometry
Mitochondria were isolated from the frontal brain and respiration was measured at the Department of Pharmacology, Goethe University Frankfurt, Germany. For this purpose, tissue samples were homogenized in respiration media (20 mM HEPES, 110 mM sucrose, 0.5 mM EGTA, 3 mM magnesium dichloride, 60 mM lactobionic acid, 20 mM taurine, 10 mM potassium dihydrogenphosphate and 1 g/l essentially fatty acid-free bovine serum albumin, pH 7.4) containing 4% protease inhibitors (Complete® Protease Inhibitor, Roche). Homogenates were centrifuged at 1400g for 7 min, supernatant was collected and centrifuged at 1400g for 3 min and finally recollected and centrifuged at 10 000g for 5 min to pellet the mitochondria-containing fraction. Pellets were gently resuspended in respiration media, aliquots for the determination of protein concentration and citrate synthase activity (procedure described below) were collected, frozen in liquid nitrogen and stored at −80°C, while respiration was recorded immediately.
Respiration was measured with the Oxygraph (Oroboros), which allows the measurement of mitochondrial respiration in two samples simultaneously. Analysis was made using sample pairs of different genotypes (wild-type and BACHD) but identical treatment (placebo or olesoxime). Data were acquired with DatLab software, version 4.3.2.7. The rate of mitochondrial respiration was monitored at 37°C according to a protocol by Prof. Dr Erich Gnaiger (University of Innsbruck, Austria) (Kuznetsov et al., 2002). A series of substrates and inhibitors were added to the samples in sequence to assess the function of different components of the mitochondrial respiratory chain. The capacity for OXPHOS (oxidative phosphorylation) was measured after addition of the complex I substrates (CIOXPHOS) glutamate (5 mM), malate (2 mM) and ADP (2 mM), followed by the addition of succinate, the substrate for complex II (CI + IIOXPHOS). Blocking the ATP synthase by addition of oligomycin, further allowed for the measurement of respiration driven by the mitochondrial proton leak only. Subsequent titration of the artificial uncoupler FCCP (trifluorocarbonylcyanide phenylhydrazone), injected in steps of 1 µM up to 4 µM until saturation occurred revealed the maximum capacity of the electron transport system (ETS). Afterwards, addition of the complex I inhibitor rotenone revealed uncoupled CII activity (CIIETS). Residual oxygen consumption (oxygen consumption caused by enzymes not belonging to the ETS) was measured after inhibition of complex III with 2.5 μM antimycin A, and subtracted from all measurements. Cytochrome C oxidase (complex IV) activity was determined after addition of 0.5 mM TMPD (tetramethylphenylenediamine), an artificial substrate and 2 mM ascorbate, which keeps TMPD in the reduced state. Complex IV respiration was corrected for the auto-oxidation rate of TMPD, determined by addition of azide (≥100 mM).
Respiration data were normalized to citrate synthase activity, a marker for mitochondrial mass (Kuznetsov et al., 2002). Citrate synthase activity was assessed spectrophotometrically. For this purpose, samples were thawed and diluted 1:2 in deionized water. Reaction media [0.1 M Tris-HCl, 0.1 mM DTNB (5,5-dithiobis-2-nitrobenzoic acid), 0.5 mM oxaloacetate, 50 μM EDTA, 0.31 mM acetyl coenzyme A, 5 mM triethanolamine hydrochloride] were warmed for 5 min at 30°C, samples were added, and the formation of TNB (5-thio-2-nitrobenzoic acid) was measured immediately via absorbance at 412 nm.
Immunohistochemistry
Paraformaldehyde-fixed brains were embedded in gelatin blocks (16 brains per block) and cut serially into 40-µm thick coronal sections (performed by NeuroScience Associates). Sections were stored in antigen-preserve solution (Fisher Scientific) at −20°C. Free-floating staining was performed at room temperature, as described previously (Osmand et al., 2006). Briefly, a series of 24 sections were warmed up at room temperature for 2 h and incubated for 30 min in 0.5% NaBH4 for blocking purpose. After washing, the sections were probed overnight with sheep polyclonal S830 antibody (1:20 000, kindly provided by Prof. Dr Gillian Bates, King’s College London, UK) for the detection of N-terminal mutant HTT. On the next day, the sections were incubated with biotinylated rabbit anti-sheep IgG secondary antibody (1:1000, BA-6000, Vector Laboratories) for 2 h and subsequently with avidin-enzyme complex (Vectastain® Elite ABC Kit Rabbit IgG, Linaris) for 1 h. To further enhance the signal, biotinylated thyramine plus 0.001% H2O2 was added for 10 min and the sections were once more incubated with avidin-biotin complex. Colour development was achieved with nickel-DAB-H2O2 (0.6% nickel, 0.01% DAB and 0.001% H2O2) dissolved in TI buffer (0.05 M Tris, 0.05 M imidazole). Nissl staining was performed using 1% thionine acetate to visualize nuclei. Sections were mounted and stored at room temperature.
Images were acquired using a Zeiss Axioplan microscope (Pl ×10 ocular, Plan-NEOFLUAR ×40/0.75 objective, AxioCam MRc) and Axiovision 4.8 software (Zeiss). Images were exported from Axiovision in tiff format, and imported into Corel Draw X5, where they were cropped to display the region of interest, and moderately adjusted in brightness, contrast and saturation to better visualize the structures of interest. The aforementioned adjustments did in no way change the information that was subject to analysis, namely the total number of S830-positive nuclei and cytoplasmic aggregates. The quantification, i.e. counting the number of cytoplasmic aggregates and the number of nuclei positive for mutant HTT staining, was performed manually.
Immunoblotting
Immunoblotting was performed with striatal and cortical tissue as well as mitochondrial membranes isolated from cerebral hemispheres.
Striata and cortices were thawed and homogenized on ice in TES buffer (50 mM Tris, 2 mM EDTA, 100 mM NaCl, pH 7.5) containing protease inhibitors (4% Complete® Protease Inhibitor, Roche). Homogenates were diluted 1:10 in TNES buffer (90% TES buffer, 10% Igepal CA630), incubated for 1 h at 4°C and centrifuged 2 × 30 min at 16 100g. Supernatant (cell lysates) were collected and stored at −80°C in 10% glycerin.
Mitochondria-enriched heavy membrane fractions were isolated from cerebral hemispheres (brain stem, cerebellum and olfactory bulbs had been removed). Tissue was homogenized on ice in HEPES buffer (10 mM HEPES, 0.32 M sucrose, 1 mM EDTA, pH 7.4) and centrifuged at 585g for 10 min. Supernatant was collected and further centrifuged twice at 17 400g for 20 min. Pellets were resuspended and layered over a Ficoll density gradient (7.5% and 13%, w/v). After 60 min of ultracentrifugation at 87 300g, the pellet, which at this point contained the mitochondrial fraction, was sampled, resuspended in 5 mM Tris-HCl and stored at −20°C.
At the time of immunoblotting, all samples were thawed on ice, and the protein concentration was measured spectrophotometrically using Bradford reagent. Western blot analysis was performed according to standard procedures. Briefly, 15 µg of mitochondrial protein or 30 µg of protein from tissue lysates were assayed using sodium dodecyl sulphate (SDS) polyacrylamide gel electrophoresis on Tris-glycine or purchased Tris-acetate gels (Life Technologies). Proteins were transferred on nitrocellulose or polyvinyl difluoride membranes, and probed overnight at 4°C with the primary antibody (Supplementary Table 1). One hour of incubation with a horseradish peroxidase-conjugated secondary or IRDye® antibody (Supplementary Table 1) at room temperature followed. Chemiluminescence and fluorescence signals were detected with the LI-COR ODYSSEY FC Imaging system (LI-COR Biosciences). Protein levels were quantified by densitometry using ImageJ (Abràmoff et al., 2004).
Filter retardation assay
For the detection of SDS-insoluble HTT species, 30 µg of cortical or striatal proteins were diluted in 100 µl DPBS (Life Technologies) with 2% SDS and incubated for 5 min at room temperature. A nitrocellulose membrane (0.45 µm; Bio-Rad) was equilibrated in 0.1% SDS in DPBS and samples were filtered through this membrane using a Minifold® II Slot Blot System (Schleicher & Schuell). The membrane was then washed twice with DPBS and blocked with 5% SlimFast (Unilever) in Tris-buffered saline for 1 h at room temperature. Retained SDS-insoluble HTT was detected using anti-HTT primary antibody (1:1000; clone 1HU-4C8, MAB2166, EMD Millipore) and the respective anti-mouse horseradish peroxidase-conjugated secondary antibody. Chemiluminescence signals were detected with the LI-COR ODYSSEY FC Imaging system and quantified using the ODYSSEY® Server software version 4.1 (both LI-COR Biosciences).
Calpain activation assays
In vitro calpain activation assays of brain lysates were performed as previously described (Hübener et al., 2013). Briefly, 30 µg of protein from TNES lysates were diluted in 40 µl calpain reaction buffer (20 mM HEPES/KOH pH 7.6, 10 mM KCl, 1.5 mM MgCl2, 1 mM dithiothreitol). The positive control was incubated with 20 ng of recombinant calpain-1 (EMD Millipore), and 2 mM CaCl2 for indicated times at room temperature, while the negative control was pretreated with 100 µM of the calpain inhibitor CI-III (carbobenzoxy-valinyl-phenylalaninal) (EMD Millipore) prior to calpain-1 addition. Calpain activity of all samples was quenched by addition of 4× NuPAGE LDS sample buffer (Life Technologies) and heat denaturation for 10 min at 70°C. Samples were subsequently assayed by immunoblotting, as described above.
Time-resolved fluorescence energy transfer for soluble mutant HTT detection
Time-resolved fluorescence energy transfer (TR-FRET) was performed with cortical and striatal lysates (sampled as described in the ‘Immunoblotting’ section), and conducted according to Baldo et al. (2012) at Novartis. Briefly, samples were ultracentrifuged at 80 000g for 90 min. Supernatant was transferred to 384-microtitre plates, diluted 1:5 in detection buffer (50 mM NaH2PO4, 400 mM NaF, 0.1% bovine serum albumin, and 0.05% Tween) and probed with fluorophore-labelled antibodies 2B7-Tb and MW1-d2 in a ratio of 1:10. TR-FRET was read with an EnVision Reader (PerkinElmer). After the excitation of the donor fluorophore Tb at 320 nm and a time delay of 100 ms, the resulting Tb and d2 emission signals were read at 620 nm and 665 nm, respectively.
Experimental design
Sample size estimation was based on behavioural data previously obtained for the BACHD rat. Fifteen animals per genotype and treatment group were assigned to the Rotarod test, 12 to the simple swim test, five to the elevated plus maze and 10 to MRI analysis. Ex vivo analyses were planned with five rats per group. The final assignment differed slightly from this, as one cage of placebo-treated rats originally intended for the elevated plus maze and mitochondrial respiration analysis was used in addition for MRI measurements. Furthermore, three animals died during the study (without any bias regarding genotype or treatment groups). For ex vivo analyses, a final number of three to five rats per group were used, as sample material was limited.
During behavioural studies, the experimenter was blind to the animals’ genotype, but not treatment, as the cages had to be labelled to ensure that the right kind of food, either placebo or olesoxime-loaded pellets, was provided at all times. Aggregate count was performed by one observer, who was blind to genotype and treatment group.
The n analysed, refers to the biological replicate of individual animals of a given genotype and treatment group, except for drug concentration analysis in brain regions, where samples from two to three individuals were pooled in order to reach a proper amount of sample material.
Statistical analysis
Data were analysed and graphed using GraphPad Prism 6.00 for Windows (GraphPad Software, San Diego California USA, http://www.graphpad.com). Values refer to group mean and standard error of the mean (SEM) for all figures, and group mean and standard deviation (SD) for Table 1. The α-level was set to 0.05. Complete data sets proved to be normally distributed. Longitudinal data were analysed using repeated measurements two-way ANOVA, with time (e.g. age or trial) as a within-group factor and group (e.g. genotype and treatment) as between-group factor. Single data sets were analysed using regular two-way ANOVAs to identify genotype and treatment effects. For both, two-way repeated measures ANOVA and two-way ANOVA, the results are implemented in each graph and specify the respective between-group factors. Fisher’s least significant difference (LSD) was performed as ANOVA post-test, and did not account for multiple comparisons, favouring false positive over false negative results in this first evaluation of olesoxime effects on Huntington’s disease-related phenotypes. There was one two-group comparison (treatment effects specific to BACHD rats), which was analysed using a Student’s t-test. Results from two-way ANOVAs and Fisher’s LSD post-test, and post-test as well as t-test results for the comparisons *wild-type versus BACHD rats; #untreated versus treated wild-type rats; and +untreated versus treated BACHD rats are indicated in respective figures, with ns = not significant, */#/+P < 0.05; **/##/++P ≤ 0.01; and ***/###/+++P ≤ 0.001.
Expression levels of mitochondrial proteins
| Cortex | Striatum | ||||||||
|---|---|---|---|---|---|---|---|---|---|
| WT | BACHD | WT | BACHD | ||||||
| Placebo | Olsx | Placebo | Olsx | Placebo | Olsx | Placebo | Olsx | ||
| MFN1 | Mean | 1.00 | 1.33## | 0.77* | 1.18++ | 1.00 | 1.66 | 1.10 | 0.96 |
| SD | 0.18 | 0.11 | 0.16 | 0.14 | 0.32 | 0.36 | 0.57 | 0.71 | |
| n | 4 | 4 | 4 | 4 | 3 | 4 | 4 | 3 | |
| MFN2 | Mean | 1.00 | 1.17 | 0.93 | 1.87++ | 1.00 | 2.41 | 1.63 | 1.63 |
| SD | 0.16 | 0.29 | 0.38 | 0.39 | 0.11 | 0.37 | 0.90 | 1.63 | |
| n | 4 | 4 | 4 | 4 | 3 | 4 | 4 | 3 | |
| OPA1 | Mean | 1.00 | 1.84## | 0.96 | 2.33+++ | 1.00 | 1.90 | 1.39 | 1.37 |
| SD | 0.40 | 0.30 | 0.29 | 0.52 | 0.49 | 0.55 | 0.60 | 0.88 | |
| n | 4 | 4 | 4 | 4 | 3 | 4 | 4 | 3 | |
| DRP1 | Mean | 1.00 | 0.92 | 0.84 | 0.52++ | 1.00 | 1.36 | 0.98 | 1.04 |
| SD | 0.06 | 0.14 | 0.14 | 0.05 | 0.04 | 0.52 | 0.15 | 0.27 | |
| n | 4 | 4 | 4 | 4 | 3 | 4 | 4 | 4 | |
| FIS1 | Mean | 1.00 | 1.40# | 1.23 | 1.17 | 1.00 | 2.16# | 2.08 | 1.31 |
| SD | 0.13 | 0.33 | 0.15 | 0.31 | 0.29 | 0.70 | 0.93 | 0.34 | |
| n | 4 | 4 | 4 | 4 | 3 | 4 | 4 | 3 | |
| CS | Mean | 1.00 | 1.95# | 1.23 | 1.86 | 1.00 | 1.64# | 1.11 | 0.94 |
| SD | 0.56 | 0.94 | 0.33 | 0.22 | 0.11 | 0.36 | 0.33 | 0.22 | |
| n | 4 | 4 | 4 | 4 | 3 | 4 | 4 | 3 | |
| ATP5A | Mean | 1.00 | 1.85 | 0.78 | 3.20++ | 1.00 | 1.51 | 1.68 | 1.68 |
| SD | 0.10 | 0.66 | 0.09 | 1.53 | 0.19 | 0.47 | 1.01 | 0.39 | |
| n | 4 | 4 | 4 | 4 | 3 | 4 | 4 | 3 | |
| TOM20 | Mean | 1.00 | 2.05 | 1.36 | 3.19+ | 1.00 | 1.36 | 1.34 | 8.24++ |
| SD | 0.30 | 0.99 | 0.51 | 1.42 | 0.78 | 1.26 | 0.88 | 4.68 | |
| n | 4 | 4 | 4 | 4 | 4 | 4 | 4 | 4 | |
The table contains group means, standard deviation (SD) and the number of animals analysed (n). Individual values were related to β-actin levels and normalized to the mean expression of placebo-treated wild-type (WT) rats. Significant differences from two-way ANOVA and Fisher LSD post-test are indicated in bold for the comparisons.
*wild-type versus BACHD rats.
#untreated versus treated wild-type.
+untreated versus treated BACHD rats with */#/+P < 0.05; **/##/++P ≤ 0.01 and ***/###/+++P ≤ 0.001. Fusion: MFN1, MFN2, OPA1; Fission: DRP1, FIS1; Matrix: citrate synthase (CS); Inner membrane: ATP synthase (ATP 5A); Outer membrane: translocase of the outer mitochondrial membrane (TOM20 encoded by TOMM20).
Some behavioural data were excluded from the analysis based on predefined criteria or technical problems. Concerning technical problems, the data could either not be properly acquired or the acquired data were inconclusive (as explained in detail below). We did not predefine exclusion criteria for outliers, or exclude data in order to reach a normal distribution. Moreover, the values we excluded were spread equally among groups, suggesting that it did not have a biological meaning or exclusion was skewing the results. Food intake measurements: nine of the 60 animals were excluded from the analysis because in at least one of the five measurements (at 2, 4, 6, 8 or 12 months of age), the food became stuck in the food basket leaving the animal unable to reach it and resulting in unreasonably low values for food intake during the respective night. Rotarod test: no data were excluded, but the number of rats available for analysis decreased with age, as an increasing number of mainly BACHD rats refused to stay on the rod at older ages (as discussed previously in Yu-Taeger et al., 2012; Abada et al., 2013b). Simple swim test: the tracking software produced a variety of errors, which made it necessary to exclude animals with individual erroneous runs. Elevated plus maze: one of the 20 animals was excluded from the analysis, as it did not move at all during the test. MRI: two of the 40 animals were excluded from the analysis, as they moved their heads during measurements and no sharp images could be acquired. Drug concentration analysis: two of the 16 samples were excluded as they had far higher drug concentrations than the rest of the rats. The high drug load in the two animals is considered to be due to food intake just prior to blood sampling, as we did not food deprive the animals. Ex vivo analyses: no data were excluded. Numbers of animals analysed in each experiment are listed in Supplementary Table 2.
Results
A timeline and overview of the parameters assessed in this study are given in Supplementary Fig. 1.
Olesoxime ameliorates cognitive and psychiatric phenotypes of BACHD rats
We previously reported that BACHD rats show a broad range of behavioural abnormalities reminiscent of the symptoms found in patients with Huntington’s disease (Yu-Taeger et al., 2012; Abada et al., 2013a, b). The cognitive phenotype of the BACHD rat is characterized by difficulties in strategy shifting (Abada et al., 2013a). Accordingly, we found that 7-month-old BACHD rats displayed reversal learning deficits in a simple swim test. Untreated, but not olesoxime-treated BACHD rats, needed longer to find a hidden platform after the platform had been relocated (Fig. 1A). Swim speed did not differ between groups (data not shown), suggesting that BACHD rats’ general ability to swim was not impaired.
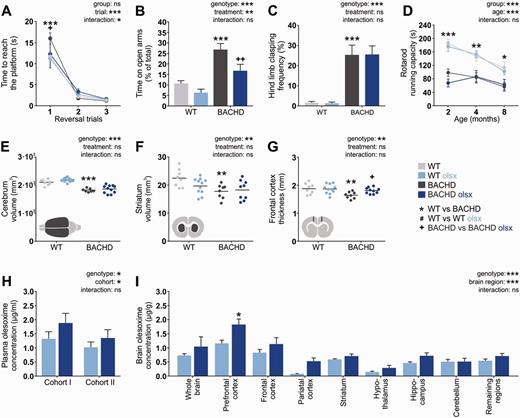
Olesoxime accumulates in the frontal cortex and exerts specific beneficial effects on behavioural and neuropathological phenotypes of the BACHD rat. (A) A simple swim test was used to assess cognitive flexibility at 7 months of age. The graph shows the time the animals needed to find a hidden platform after the position of the platform had been changed (reversal training). (B) Anxiety-related behaviour was assessed in an elevated plus maze at 13 months of age. The graph shows the time the animals spent on the open arms of the maze relative to trial duration. (C) Clasping behaviour was assessed weekly as an indicator for motor dysfunction. The graph displays the clasping frequency between the age of 1 and 10 months. (D) Motor abnormalities were further investigated longitudinally using a Rotarod test. The graph displays the mean running capacity during tests. (E–G) MRI was performed at 13 months of age. Images in the lower left corner illustrate the site of measurement. (H and I) Plasma olesoxime levels were measured in the main cohort of rats used for all in vivo and ex vivo analyses (Cohort I) at 3 months of age, after 7 weeks of treatment. In addition, plasma and brain olesoxime levels were determined in a second cohort of rats (Cohort II) at 4 months of age, after 2 weeks of treatment. Olsx = olesoxime, EPM = elevated plus maze; WT = wild-type; ns = not significant. */#/+P < 0.05; **/##/++P ≤ 0.01 and ***/###/+++P ≤ 0.001.
Anxiety-related changes were assessed by measuring the time spent on the open arms of an elevated plus maze at 13 months of age. In line with our previous findings (Yu-Taeger et al., 2012), BACHD rats spent a significantly longer amount of time on the open arms than wild-type rats. Olesoxime treatment clearly ameliorated this phenotype (Fig. 1B).
Longitudinal assessment of clasping behaviour and rotarod performance were carried out as common tests of striatum-based motor dysfunction (Soll et al., 2013; Bergeron et al., 2014). BACHD rats showed hind limb clasping, similar to previous cohorts (Yu-Taeger et al., 2012) (Fig. 1C). Furthermore, rotarod performance, which is among the earliest pathological phenotypes detected in the BACHD rat (Yu-Taeger et al., 2012), was found to be impaired at 2, 4 and 8 months of age (Fig. 1D). Olesoxime treatment, which started when the motor abnormalities were already manifest, did not reverse the pathology (Fig. 1C and D).
Olesoxime increases frontal cortex thickness
Olesoxime has been ascribed with neuroprotective properties, as it was found to increase the survival of neurons expressing disease proteins (Bordet et al., 2010; Gouarné et al., 2013, 2015). We performed MRI scans in 13-month-old rats to evaluate if olesoxime was able to ameliorate brain atrophy observed in BACHD rats (Yu-Taeger et al., 2012). BACHD rats had significantly smaller cerebra (Fig. 1E), striata (Fig. 1F) and prefrontal cortices (Fig. 1G) compared to their wild-type littermates. While olesoxime treatment did not significantly affect cerebral or striatal volume (Fig. 1E and F), frontal cortex thickness was significantly increased, pointing to a region-specific neuroprotective effect of olesoxime (Fig. 1G).
Olesoxime is enriched in prefrontal and frontal cortex
After finding significant beneficial, but apparently region-specific effects of olesoxime, we analysed the drug concentration in plasma and brain regions in a separate cohort of rats after 2 weeks of olesoxime treatment at 4 months of age (Cohort II). Analysis revealed similar plasma levels as found for the main cohort at 3 months of age (Cohort I) (Fig. 1H), which were presumed to lie in the pharmacologically active range of olesoxime based on the results of previous studies (Bordet et al., 2007, 2010; Richter et al., 2014). Furthermore, BACHD rats tended to have higher plasma (Fig. 1H) and brain (Fig. 1I) olesoxime levels than wild-type rats. In addition, we detected significant differences in the olesoxime concentration among brain regions, with highest concentrations measured in prefrontal and frontal cortex (Fig. 1I). The general trend to higher olesoxime concentrations in BACHD rats was not the result of increased food intake (data not shown) and there was no difference in body weight between genotype or treatment groups, thus the results might point to altered pharmacokinetics of olesoxime in the BACHD rat.
Olesoxime reduces mutant HTT aggregates and nuclear accumulation
Aggregation and nuclear accumulation of mutant HTT are prominent neuropathological features of Huntington’s disease (Gutekunst et al., 1999). Consistent with our previous results (Yu-Taeger et al., 2012), 13-month-old BACHD rats show mutant HTT aggregates (reflected by distinct S830-positive punctae) and nuclear accumulation (reflected by S830-positive nuclei) in variable magnitude throughout the brain (Figs 2, 3A and B). Aggregates were found predominantly in cortex, hypothalamus and amygdala. Mutant HTT nuclear accumulation prevailed in the cortex, lateral striatum and hippocampus. Similar to patients with Huntington’s disease (Gutekunst et al., 1999), cerebral cortex hosted a high amount of mutant HTT aggregates and nuclear accumulation of mutant HTT, while neither form was abundant in the central caudate putamen, the major part of the striatum. Olesoxime-treated BACHD rats showed a significant reduction in both aggregate load and nuclear mutant HTT accumulation (Figs 2, 3A and B). Moreover, not only the number of aggregates and mutant HTT-positive nuclei was reduced due to olesoxime treatment, but also aggregate size and the density of mutant HTT in the nuclei of olesoxime-treated BACHD rats seemed to be lowered.
![Effects of olesoxime on mutant huntingtin aggregates and nuclear accumulation in different brain regions. Aggregation and nuclear accumulation of mutant HTT were investigated in coronal brain sections from 13-month-old rats, stained with S830 N-terminal mutant HTT antibody. Images were taken from prefrontal, frontal and parietal brain areas. Columns display series of images from individual rats [wild-type (WT) n = 1, BACHD, n = 4]. Distinct punctae represent mutant HTT cytoplasmic aggregates and large circular staining represents mutant HTT nuclear accumulation. Black–purple staining = S830 huntingtin signal; blue staining = thionine nuclear signal. Magnification: ×400; Scale bar = 10 µM. Olsx = olesoxime; PL = prelimbic cortex; M1 = motor cortex 1; Cg = cingulate cortex; CPu = caudate putamen; S = somatosensory cortex; Th = thalamus; Hyp = hypothalamus; VMH = ventro-medial hypothalamus; Hip = hippocampus; DG = dentate gyrus; Am = amygdala.](https://oup.silverchair-cdn.com/oup/backfile/Content_public/Journal/brain/138/12/10.1093_brain_awv290/3/m_awv290f2p.jpeg?Expires=1716523653&Signature=BhyynQqUMs92IpwyLL-dWH3KK7CH~l9PdDLskLXpqTPL4aZreoy5RHB7NPMc29rUZC68q021cZ3LGV5GVOTANLaoaqXdypFIo10qRDeYyzW~8I86Fhq21XLYX~v9KM8oIHc3MW4gW8p7~DLUZb7Gd0cdWqq5lJ73gjfV6fOPwnxM0HXNSD3dMgYi517ZnCj05P7AGC4qjxIHQFiiy8P8ygJ20-q0AGlSZ9hCsyfpZ4jBlF8q2uCEvmI0EoKyA9RnicfqgkIy8wBaYlyXE4h-MLOCMbJDmrnZF4XsmeqdkkDUUZAFai2B7s4ikDNDf4Clu9bcWWo~nnBSwiT84ztb4w__&Key-Pair-Id=APKAIE5G5CRDK6RD3PGA)
Effects of olesoxime on mutant huntingtin aggregates and nuclear accumulation in different brain regions. Aggregation and nuclear accumulation of mutant HTT were investigated in coronal brain sections from 13-month-old rats, stained with S830 N-terminal mutant HTT antibody. Images were taken from prefrontal, frontal and parietal brain areas. Columns display series of images from individual rats [wild-type (WT) n = 1, BACHD, n = 4]. Distinct punctae represent mutant HTT cytoplasmic aggregates and large circular staining represents mutant HTT nuclear accumulation. Black–purple staining = S830 huntingtin signal; blue staining = thionine nuclear signal. Magnification: ×400; Scale bar = 10 µM. Olsx = olesoxime; PL = prelimbic cortex; M1 = motor cortex 1; Cg = cingulate cortex; CPu = caudate putamen; S = somatosensory cortex; Th = thalamus; Hyp = hypothalamus; VMH = ventro-medial hypothalamus; Hip = hippocampus; DG = dentate gyrus; Am = amygdala.
The results from immunohistochemical staining were validated using a filter retardation assay to detect the amount of non-soluble, and thus aggregated, mutant HTT in cortical and striatal lysates from untreated and olesoxime-treated BACHD rats. In both cortical and striatal samples, aggregated mutant HTT was significantly reduced due to olesoxime treatment (Fig. 3C).
![Olesoxime reduces mutant HTT aggregation, nuclear accumulation and fragmentation, and increases soluble full-length forms of mutant HTT. (A and B) Total numbers of S830-positive punctae [mutant HTT (mHTT) aggregates] and nuclei (nuclear accumulation of mutant HTT) were counted manually from the brain regions displayed in Fig. 2. Images on the right illustrate the structures counted, with arrows pointing to mutant HTT aggregates or mutant HTT-positive nuclei, respectively. Nc = not counted; np = not present; PL = prelimbic cortex; M1 = motor cortex 1; Cg = cingulate cortex; CPu = caudate putamen; S = somatosensory cortex; Th = thalamus; Hyp = hypothalamus; VMH = ventro-medial hypothalamus; Hip = hippocampus; DG = dentate gyrus; Am = amygdala. (C) SDS-insoluble proteins from cortical and striatal lysates were trapped on a nitrocellulose membrane and probed with the HTT-specific 4C8 antibody to quantify the amount of aggregated mutant HTT. (D) Levels of soluble mutant HTT were measured in cortical and striatal lysates from untreated and olesoxime-treated BACHD rats via TR-FRET analysis. (E–G) Full-length and fragment forms of mutant HTT were assessed in cortical and striatal lysates using the HTT-specific D7F7 and the polyglutamine-specific 1C2 antibodies. Black arrowheads = full-length mutant HTT; grey arrowhead = full-length endogenous rat HTT; red arrowheads = HTT fragments (1C2-positive bands in wild-type rats label polyglutamine-containing proteins other than mutant HTT); VCP/p97 = loading control; Olsx = olesoxime; ns = not significant. */#/+P < 0.05; **/##/++P ≤ 0.01 and ***/###/+++P ≤ 0.001.](https://oup.silverchair-cdn.com/oup/backfile/Content_public/Journal/brain/138/12/10.1093_brain_awv290/3/m_awv290f3p.jpeg?Expires=1716523653&Signature=oX6YwBfZiU1QD97hA6Z0xVNVxVmLmdN0Wz9DO6hkqCrggGOwnFzcFYDw7Bq~~rA4p5iASQ4LwOidjqf9ggYqGAIUZWTGeU61a816eunhnj26UBz2zABvMykcntDbarLTCu~RSNh7UukxjX5kaOyNGKEiVK3fkRLSL2R4EkTGNBi9JP9MhkM2oMjhUzwTlkWd9YDEO~KxIvdieZFCmGqSiS8OiLl2jmrG3ylSDGX1BhDzkEUGJxn8QWUHXUOyTgq7aS8VkyENFVvG2PlSB2q17kROJJj-UQNr5rO3hFJHQec0Me0TR42PtvJ7szNVRXPTOMHkl57SNs4QgGMoAnNz0g__&Key-Pair-Id=APKAIE5G5CRDK6RD3PGA)
Olesoxime reduces mutant HTT aggregation, nuclear accumulation and fragmentation, and increases soluble full-length forms of mutant HTT. (A and B) Total numbers of S830-positive punctae [mutant HTT (mHTT) aggregates] and nuclei (nuclear accumulation of mutant HTT) were counted manually from the brain regions displayed in Fig. 2. Images on the right illustrate the structures counted, with arrows pointing to mutant HTT aggregates or mutant HTT-positive nuclei, respectively. Nc = not counted; np = not present; PL = prelimbic cortex; M1 = motor cortex 1; Cg = cingulate cortex; CPu = caudate putamen; S = somatosensory cortex; Th = thalamus; Hyp = hypothalamus; VMH = ventro-medial hypothalamus; Hip = hippocampus; DG = dentate gyrus; Am = amygdala. (C) SDS-insoluble proteins from cortical and striatal lysates were trapped on a nitrocellulose membrane and probed with the HTT-specific 4C8 antibody to quantify the amount of aggregated mutant HTT. (D) Levels of soluble mutant HTT were measured in cortical and striatal lysates from untreated and olesoxime-treated BACHD rats via TR-FRET analysis. (E–G) Full-length and fragment forms of mutant HTT were assessed in cortical and striatal lysates using the HTT-specific D7F7 and the polyglutamine-specific 1C2 antibodies. Black arrowheads = full-length mutant HTT; grey arrowhead = full-length endogenous rat HTT; red arrowheads = HTT fragments (1C2-positive bands in wild-type rats label polyglutamine-containing proteins other than mutant HTT); VCP/p97 = loading control; Olsx = olesoxime; ns = not significant. */#/+P < 0.05; **/##/++P ≤ 0.01 and ***/###/+++P ≤ 0.001.
Olesoxime decreases mutant HTT fragments and increases full-length mutant HTT by reducing calpain-mediated cleavage
To further investigate the cause and consequences of reduced mutant HTT aggregate formation and nuclear accumulation, we analysed the levels of soluble full-length and truncated forms of mutant HTT in cortical and striatal lysates from 13-month-old BACHD and wild-type rats.
Total levels of soluble mutant HTT were measured by TR-FRET analysis as described previously (Baldo et al., 2012). Consistent with the reduction of aggregated mutant HTT throughout the cortex, soluble mutant HTT levels were highly increased in the cortices but not striata from olesoxime-treated BACHD rats (Fig. 3D).
As mutant HTT fragments are particularly prone to aggregate formation (Cooper et al., 1998; Li and Li, 1998; Martindale et al., 1998) and nuclear accumulation (Davies et al., 1997; DiFiglia et al., 1997; Zhou et al., 2003), we further quantified the levels of truncated mutant HTT by western blot analysis (Fig. 3E–G). By using the HTT-specific D7F7 antibody (epitope around proline 1220 of human HTT) to detect mutant HTT, as well as endogenous rat HTT, and the polyglutamine-specific 1C2 antibody to detect mutant HTT only, we obtained a variety of protein fragments in cortex and striatum of both wild-type and BACHD rats (Fig. 3E). Untreated BACHD rats showed clearly enhanced fragmentation of mutant HTT in cortex (Fig. 3E and F) but not striatum (Fig. 3E and G). In addition, the cortex samples from untreated BACHD rats contained a variety of shorter HTT fragments that were not detectable in cortical samples from wild-type rats, or striatal samples of either genotype (Fig. 3E). Olesoxime treatment reduced HTT fragmentation in BACHD rats below wild-type level in both cortex and striatum (Fig. 3E–G). Similar to the TR-FRET analysis, olesoxime-treated BACHD rats showed a significant increase in full-length mutant HTT, specifically in cortex (Fig. 3E and F).
Based on the apparent influence of olesoxime on mutant HTT proteolysis, we then investigated the origin of mutant HTT fragments by analysing the activity of calpains and caspases, the main contributors to proteolytic cleavage of mutant HTT (Goldberg et al., 1996; Gafni and Ellerby, 2002). We did not find marked differences between genotype or treatment groups in the expression levels of caspase-3, or the activation status of caspase-6 in either cortex or striatum (data not shown). On the other hand, strong activation of the calpain system was detected specifically in cortex (Fig. 4A) but not striatum (Fig. 4B) of untreated BACHD rats. While the expression levels of full-length calpain-1, calpain-2 and calpain-10 were unchanged (data not shown), overactivation of the calpain system was evidenced by a distinct increase in processed calpain-1, elevated levels of the cleaved form of the calpain substrate α-spectrin, and decreased levels of the endogenous calpain inhibitor calpastatin (Fig. 4A). Olesoxime treatment reversed the dysregulation by decreasing active calpain-1, increasing calpastatin levels, and reducing α-spectrin cleavage (Fig. 4A). Even though calpain activity was not increased in the striata of untreated BACHD compared to wild-type rats, olesoxime reduced calpain-1 activation and spectrin cleavage also in this brain region, while no significant effects on calpastatin levels were detected (Fig. 4B).
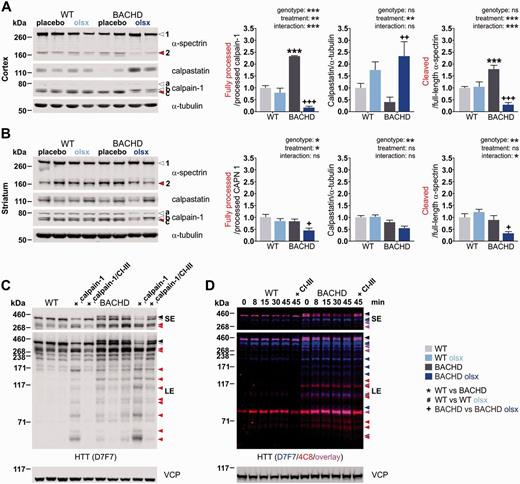
Olesoxime reduces the calpain-mediated cleavage of HTT, the major source of HTT fragments in the BACHD rat. (A and B) Calpain activation was investigated by western blot analysis of the protease calpain-1, its endogenous inhibitor calpastatin and cleavage substrate α-spectrin, in cortical and striatal lysates from 13-month-old rats. Arrowhead 1 = full-length α-spectrin; arrowhead 2 = α-spectrin fragment; arrowhead a = full-length calpain-1; arrowhead b = processed calpain-1; arrowhead c = further processed calpain-1 (active calpain1 refers to the ratio c/b); α-tubulin = loading control. (C) The dependency of HTT cleavage on calpain activity was assessed qualitatively in a calpain activation assay performed with cortical lysates from untreated, 13-month-old wild-type (WT) and BACHD rats. Samples were treated with recombinant calpain-1 and CaCl2 (rcalpain-1) for 15 min, or additionally pretreated with calpain inhibitor III (CI-III) to demonstrate calpain-1 specificity. HTT fragments were detected with the HTT-specific D7F7 antibody. Black arrowhead = full-length mutant HTT; grey arrowhead = full-length endogenous rat HTT; red arrowheads = HTT fragments. Shorter exposure of the membrane was used to distinguish high molecular weight bands, while longer exposure revealed low molecular weight HTT fragments. (D) Another calpain activation assay was performed with cortical lysates from one untreated, 13-month-old wild-type and one BACHD rat, respectively, to illustrate the variety of N-terminal and more C-terminal HTT fragments. For this, the samples were first treated with recombinant calpain-1 and CaCl2 (rcalpain-1) for an increasing amount of time or pretreated with calpain inhibitor III (CI-III) to demonstrate calpain-1 specificity. Samples were then probed with the HTT-specific D7F7 antibody as well as the HTT-specific 4C8 antibody, labelling central and N-terminal mutant HTT, respectively. The figure shows the overlay of the two detections with exclusive staining of HTT with D7F7 in blue, exclusive staining of HTT with 4C8 in red and double-staining of HTT with both antibodies in pink. Black arrowhead = full-length mutant HTT; grey arrowhead = full-length endogenous rat HTT; blue, red and pink arrowheads = HTT fragments; ns = not significant. Shorter exposure of the membrane was used to distinguish high molecular weight bands, while longer exposure revealed low molecular weight HTT fragments. */#/+P < 0.05; **/##/++P ≤ 0.01 and ***/###/+++P ≤ 0.001.
To validate that the cortical mutant HTT fragments reduced by olesoxime treatment were calpain-derived, we performed in vitro calpain cleavage assays on cortical lysates (Fig. 4C and D). Incubation with recombinant calpain-1 resulted in increased fragmentation accompanied by a decrease in the levels of both full-length HTT and mutant HTT (Fig. 4C). The accumulation of calpain-derived wild-type and mutant HTT fragments was time-dependent, and concerned a variety of N-terminal and C-terminal fragments as detected by double-immunostaining with D7F7 and the N-terminal 4C8 antibody (epitope between amino acids 181 and 810) (Fig. 4D). Calpain dependency was further confirmed by addition of the specific calpain inhibitor CI-III, which abolished the fragmentation. In vitro calpain activation resulted in a clear fragmentation of HTT in wild-type rats, resembling the fragmentation pattern found in BACHD rats. Fragmentation was also enhanced in BACHD rats, although the effect was less strong due to high basal fragmentation of mutant HTT. These results suggest that calpain cleavage constituted the major contributor to proteolytic cleavage in the BACHD rat and that the additional small fragments found in BACHD rat cortex, which were cleared by olesoxime treatment, derived from enhanced calpain-mediated cleavage.
Olesoxime reduces mitochondria-associated HTT fragments and improves mitochondrial function
Given that olesoxime accumulates at the site of mitochondria (Bordet et al., 2010), we investigated the impact of olesoxime on mitochondrial properties.
First, we analysed the activation status of the calpain system in mitochondria-enriched heavy membrane fractions isolated from the cerebra of 13-month-old, placebo- and olesoxime-treated, wild-type and BACHD rats (Fig. 5A), as calpains are also located in mitochondria (Arrington et al., 2006; Badugu et al., 2008; Smith and Schnellmann, 2012). Enrichment in mitochondrial protein in the mitochondrial fractions is demonstrated by higher citrate synthase levels compared to whole cell lysate (Fig. 5A and B). Calpain activation was not increased in the mitochondrial fractions of untreated BACHD rats (Fig. 5A). However, olesoxime treatment repressed mitochondrial calpain activity in both BACHD and wild-type rat samples, as indicated by a reduced amount of active calpain-1 and cleaved α-spectrin, as well as increased amounts of calpastatin (Fig. 5A).
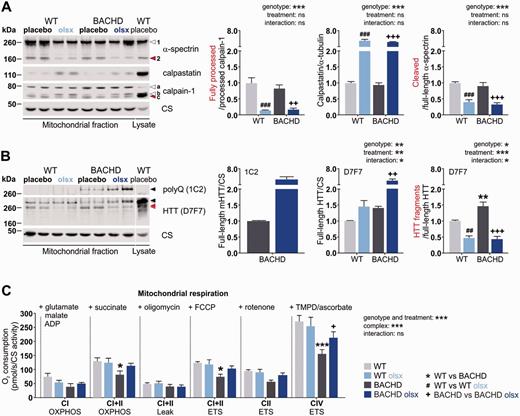
Olesoxime reduces the activation of mitochondrial calpains and mitochondria-associated HTT fragments and restores mild respiratory deficits in BACHD rats. (A) Calpain activation was investigated in cerebral mitochondria-enriched heavy membranes (mitochondrial fraction) from 13-month-old rats by western blot analysis of the protease calpain-1, its endogenous inhibitor calpastatin and cleavage substrate α-spectrin, in cortical and striatal lysates. Arrowhead 1 = full-length α-spectrin; arrowhead 2 = α-spectrin fragment; arrowhead a = full-length calpain-1; arrowhead b = processed calpain-1; arrowhead c = further processed calpain-1 (active calpain-1 refers to the ratio c/b); citrate synthase (CS) = loading control. (B) Full-length and fragment forms of mutant HTT were assessed in cortical and striatal lysates from 13-month-old rats using the HTT-specific D7F7 and the polyglutamine-specific 1C2 antibodies. Black arrowheads = full-length mutant HTT; grey arrowhead = full-length endogenous rat HTT; red arrowheads = HTT fragments. One sample of wild-type cortex lysate was loaded to demonstrate the enrichment of the mitochondrial marker citrate synthase in the mitochondrial fraction. (C) Mitochondrial respiratory chain activity was assessed by measuring oxygen consumption of isolated cerebral mitochondria from 13-month-old rats. Addition of substrates and inhibitors was performed as indicated in the figure and described in detail in the ‘Materials and methods’ section. CIOXPHOS = complex I-fueled respiration; CI + IIOXPHOS = complex I- and II-fueled respiration; CI+IILEAK = membrane leakage; CI+IIETS = maximum respiratory capacity; CIIETS = maximum capacity dependent on complex II; CIVETS = maximum capacity dependent on complex IV; ns = not significant. Oxygen consumption rates were normalized to citrate synthase activity. */#/+P < 0.05; **/##/++P ≤ 0.01 and ***/###/+++P ≤ 0.001.
As HTT and mutant HTT are known to associate with mitochondria (Choo et al., 2004; Gellerich et al., 2008; Orr et al., 2008), we further investigated their presence and cleavage in the mitochondrial fractions from wild-type and BACHD rats (Fig. 5B). Full-length protein as well as truncated forms of endogenous rat HTT and mutant HTT were detected. More mitochondria-associated fragments of HTT were found in untreated BACHD compared to wild-type rats. Olesoxime treatment reduced the amount of HTT fragments associated with mitochondria, in both wild-type and BACHD rats. In the BACHD rat, olesoxime additionally increased mitochondria-associated full-length endogenous rat HTT and mutant HTT. Together with the results on whole cell lysate, these findings indicate that olesoxime mediates a genotype-independent reduction in mitochondrial calpain activation, and reduces tissue-specific, whole cell calpain overactivation in the Huntington’s disease context of the BACHD rat.
To test if olesoxime affected mitochondrial function, we further investigated mitochondrial respiratory chain activity (Fig. 5C) and the expression of mitochondrial proteins (Table 1). Mitochondrial function has not been assessed in the BACHD rat previously. Mitochondria isolated from 13-month-old untreated BACHD rat cerebra showed an overall lower oxygen consumption rate compared to wild-type rats, and olesoxime treatment reduced this respiration deficit (Fig. 5C). Expression levels of mitochondrial proteins were not strikingly altered in 13-month-old untreated BACHD compared to wild-type rats, but olesoxime strongly affected the protein expression in BACHD and wild-type rats in a differential manner (Table 1). While we observed a general increase in the expression of many mitochondrial proteins in cortex and striatum of olesoxime-treated wild-type rats, indicative of an overall increase in mitochondrial mass, we detected more specific effects in BACHD rats with olesoxime treatment. In cortex, olesoxime increased the expression of ATP synthase and the fusion-promoting proteins MFN1, MFN2 and OPA1, while the expression of fission-promoting proteins was either unaffected (FIS1) or decreased (DRP1), suggesting a higher capacity for respiration and fusion processes in this tissue due to olesoxime treatment. Olesoxime further dramatically increased the expression of the outer mitochondrial membrane transporter TOMM20, in both cortex and striatum of the BACHD rat. This finding led us to consider a general effect of olesoxime on transport across the mitochondrial membrane, and particularly the exchange of Ca2+, as the overactivation of calpain found in BACHD rat cortex might be due to a mitochondrial Ca2+ buffering deficit.
Olesoxime affects the expression of proteins involved in Ca2+ homeostasis
It had been demonstrated that calpain-derived fragments of mutant HTT are formed in response to Ca2+ stress (Gafni et al., 2004). Olesoxime might influence Ca2+ homeostasis, as it interacts with voltage-dependent anion channels (VDACs) (Bordet et al., 2007), which are involved in intracellular Ca2+ translocation (Gincel et al., 2001; Szabadkai et al., 2006; Min et al., 2012). Western blot analysis revealed no alteration in VDAC1/VDAC2 expression in 13-month-old untreated BACHD rats compared to wild-type rats, but a dramatic increase in the expression of both isoforms in cortex (Fig. 6A) and striatum (Fig. 6B) from olesoxime-treated BACHD rats. The strong effect on VDAC expression was also seen in the cortex of wild-type rats (Fig. 6A).
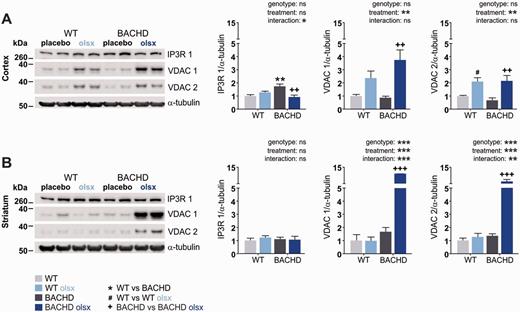
Olesoxime affects the expression of proteins involved in Ca2+ homeostasis. (A and B) Expression levels of the endoplasmic reticulum Ca2+ transporter IP3R1, and the outer mitochondrial membrane channels VDAC 1 and VDAC 2, which are also involved in Ca2+ transport, were assayed in cortical and striatal lysates from 13-month-old rats. α-tubulin = loading control; ns = not significant. */#/+P < 0.05; **/##/++P ≤ 0.01 and ***/###/+++P ≤ 0.001.
We further analysed the levels of the endoplasmic reticulum-associated Ca2+-transporter IP3R1, as it is implicated in neurodegenerative diseases (Stutzmann and Mattson, 2011). Specifically, IP3R1 (encoded by ITPR1) protein expression is upregulated in response to elevated Ca2+ levels (Genazzani et al., 1999), and excessive IP3R1-mediated Ca2+-release into the cytosol primes apoptosis (Stutzmann and Mattson, 2011). Furthermore, both interaction with mutant HTT and calpain cleavage have been shown to facilitate IP3R1 activity upon stimulation, and render neurons more vulnerable to excitotoxic stimuli (Tang et al., 2003; Kopil et al., 2012). We found the levels of IP3R1 to be increased in cortex (Fig. 6A) of untreated BACHD compared to wild-type rats. While no significant effect of olesoxime treatment on IP3R1 was found in wild-type rats, olesoxime normalized IP3R1 expression in the cortex from BACHD rats (Fig. 6A and B).
Discussion
Olesoxime is a mitochondria-targeting neuroprotective compound (Bordet et al., 2007, 2010) that has shown potential as a treatment for several neurodegenerative diseases (Bordet et al., 2008; Xiao et al., 2009, 2012; Rovini et al., 2010; Sunyach et al., 2012; Eckmann et al., 2013; Richter et al., 2014). We show here that olesoxime exhibited highly beneficial effects on disease-related phenotypes in a Huntington’s disease animal model. Importantly, the treatment effects appeared to be conveyed through a previously unknown function of olesoxime, to reduce proteolysis. In Huntington’s disease, proteolytic cleavage of mutant HTT results in the generation and accumulation of toxic mutant HTT fragments (Goldberg et al., 1996; Gafni and Ellerby, 2002; Kim et al., 2006; Miller et al., 2010), which are thought to be crucial for disease pathogenesis (Rigamonti et al., 2000; Nagai et al., 2007; Wang et al., 2008). Consistent with this, olesoxime-treated BACHD rats showed reduced activation of the calpain system, reduced amounts of mutant HTT fragments, aggregates and nuclear mutant HTT accumulation, as well as behavioural and neuropathological improvements. Inhibition of mutant HTT cleavage has previously been targeted in Huntington’s disease models by genetic manipulations (Gafni et al., 2004; Graham et al., 2006; Miller et al., 2010), or the use of protease inhibitor (Bizat et al., 2003), revealing beneficial effects (Bizat et al., 2003; Gafni et al., 2004; Graham et al., 2006; Miller et al., 2010). However, olesoxime is the first small molecule identified to reduce the level of mutant HTT fragments in a safe and simple approach: the compound can be administered orally, has been shown to be safe and well-tolerated clinically (Lenglet et al., 2014), and its neuroprotective activity has recently been demonstrated in a pivotal clinical trial in patients with spinal muscular atrophy (Dessaud et al., 2014). Thus, our findings highly encourage further investigations of olesoxime for use as a therapeutic for Huntington’s disease. Still, some questions arose from the present study, which need to be addressed further.
Are the beneficial effects of olesoxime restricted to specific brain regions?
The current results indicate that olesoxime reaches higher concentrations in the frontal and prefrontal cortex compared to other brain regions, when given orally. In line with this, both in vivo and ex vivo analyses indicated a predominant cortical effect of olesoxime treatment. MRI results revealed increased frontal cortex thickness, while atrophy of other brain areas such as the striatum was not alleviated. Further, olesoxime-treated BACHD rats showed a selective improvement of reversal learning and anxiety deficits, while motor phenotypes remained. Important in this regard is that lesion studies have tied attentional set shifting difficulties and reduced anxiety in the elevated plus maze to the prefrontal and frontal cortex (Birrell and Brown, 2000; Shah and Treit, 2003), while motor performance crucially involves the striatum (Soll et al., 2013; Bergeron et al., 2014). Thus, it is possible that the apparent selective effect on behaviour was a result of the uneven distribution of olesoxime. However, it is important to note that olesoxime still exerted strong effects on mutant HTT fragmentation and nuclear accumulation in striatum, despite its lower concentration. The reason for olesoxime not mitigating more striatum-based phenotypes could thus be that neuronal pathologies differ among brain regions. Most notably, the overactivation of the calpain system seemed to be a cortex-specific phenotype in the BACHD rat, and appeared to play a major role in olesoxime’s beneficial effects. It is possible that striatal neurons suffer more from other mutant HTT-mediated deficits, and that neuronal dysfunction thus persisted, despite sufficient olesoxime concentrations.
An alternative hypothesis on the selective effects of olesoxime might be that some deficits, such as the rotarod phenotype, were already manifest prior to the start of olesoxime treatment in the current study. Similar results have been obtained in a recent study on the effect of cholesterol oximes on the pathological phenotypes of Parkinson’s disease mice. The compounds ameliorated non-motor phenotypes and gene expression changes in mitochondrial genes, but were not able to reverse motor dysfunction with onset prior to the start of treatment (Richter et al., 2014). The fact that olesoxime treatment did not generally ameliorate brain atrophy in BACHD rats could have the same cause, as we recently reported that smaller body and brain sizes among BACHD rats derive from growth impairment rather than progressive degeneration (Jansson et al., 2014).
What is the primary target of olesoxime?
It has previously been proposed that the presence of mutant HTT might initiate a vicious cycle, in which mitochondrial dysfunction leads to reduced Ca2+ buffering, subsequent protease activation and generation of mutant HTT fragments that further enhance the cytotoxic events (Petersén et al., 1999; Bizat et al., 2003). Accordingly, we observed a respiratory chain deficit, along with increased calpain activation and mutant HTT fragmentation in BACHD rats, pathologies which were all alleviated by olesoxime (Fig. 7). Thus, we suggest that olesoxime interfered with the vicious cycle by stabilizing mitochondria.
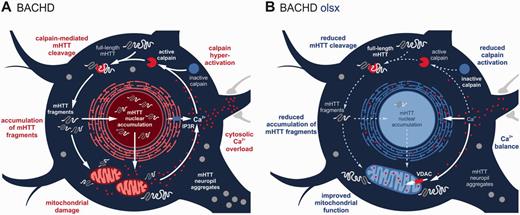
Schematic of the hypothetical Huntington’s disease-related pathology and beneficial effects of olesoxime, in a BACHD rat cortical neuron. (A) The presence of mutant HTT (mHTT) provokes an increase in cytosolic Ca2+, leading to the overactivation of calpain, a major executer of mutant HTT cleavage in the BACHD rat. Enhanced calpain-mediated cleavage generates large amounts of mutant HTT fragments, which accumulate in cytosol and nucleus, and are recruited to form cytosolic and neuropil aggregates. Mutant HTT fragments impair mitochondrial function by transcriptional dysregulation and direct interaction, thereby reducing mitochondrial Ca2+-buffering capacity, further elevating cytosolic Ca2+-levels and fuelling the vicious cycle. (B) Olesoxime interrupts this by improving mitochondrial function, reflected in increased respiratory activity, fusion protein and outer membrane transporter expression. This can in turn improve Ca2+ buffering, explaining the reduced calpain activation, mutant HTT cleavage and accumulation of mutant HTT fragments, as well as the decrease in cytosolic and neuropil aggregates seen in the current study.
It is conceivable that mitochondria were the primary effectors of olesoxime treatment, as olesoxime concentrates at this site (Bordet et al., 2010), and cholesterol-oximes have been shown to affect the expression of genes important for mitochondrial function (Richter et al., 2014). Such gene expression changes include the upregulation of MFN1 and downregulation of DRP1, consistent with our findings on a protein level. Importantly, abnormally increased fission activity has recently been shown to contribute to the cellular pathology in Huntington’s disease (Costa and Scorrano, 2012). Counteracting this by inhibiting fission or enhancing fusion, further, has been found to ameliorate Huntington’s disease-related phenotypes (Wang et al., 2009; Costa et al., 2010; Song et al., 2011). This is possibly due to improved mitochondrial Ca2+ handling, as suppressing fission or enhancing fusion generally renders neurons less susceptible to excitotoxic stress (Jahani-Asl et al., 2011; Nguyen et al., 2011; Grohm et al., 2012; Kushnareva et al., 2013).
Another interesting effect of olesoxime is a modulation of mitochondrial membrane fluidity. We reported earlier that olesoxime was able to reverse an increase in mitochondrial membrane fluidity observed in the BACHD rat and two other Huntington’s disease models (Eckmann et al., 2014). We further showed that olesoxime-treated BACHD rats had significantly higher mitochondrial membrane cholesterol levels than untreated BACHD rats, which might be causal for the reduction in membrane fluidity (Eckmann et al., 2014). Here, we demonstrate that olesoxime dramatically increased the levels of the outer mitochondrial membrane transporter VDAC, which is involved in mitochondrial cholesterol import (Rone et al., 2009). The additional increase in the levels of the outer mitochondrial membrane import component TOMM20 suggests that olesoxime exerted a general beneficial effect on transport processes across the mitochondrial membrane. It had been argued before that energetic deficits and impaired Ca2+ homeostasis might be the result of impaired communication between mitochondria and cytoplasm due to the accumulation of mutant HTT on the outer mitochondrial membrane (Gellerich et al., 2008, 2010). A recent study specifically demonstrated that mutant HTT impairs mitochondrial protein import by interaction with the inner membrane transport complex TIMM23, and that overexpression of TIMM23 leads to restoration of protein import and prevention of cell death (Yano et al., 2014). Thus, there are several indications that the mitochondrial membrane environment is modulated by olesoxime, which might connect to its beneficial effects.
We hypothesized that the compound had exerted its beneficial effects by improving mitochondrial function, thereby stabilizing Ca2+ homeostasis, decreasing Ca2+-related calpain-1 activation and aborting the generation of toxic HTT fragments as well as their exaggerated negative influence on mitochondria (Fig. 7). As Ca2+ levels, Ca2+ handling or the effects of olesoxime on Ca2+ balance could not be directly evaluated in this study, the proposed mechanism remains hypothetical. However, the finding of overactive calpain-1 itself and the increased protein levels of IP3R1 in untreated BACHD rats, as well as the restorative effects of olesoxime on these parameters, strongly support the idea of improved Ca2+ homeostasis, if not as primary effect then at least as part of olesoxime’s mechanism of action.
Nonetheless, lacking a clear mechanism of action, it will be difficult to develop pharmacodynamic biomarkers, which will be crucial for conducting successful clinical efficacy trials. This has for instance been proven true for well-tolerated antioxidant molecules such as cysteamine (CYTE-I-HD study), creatine (CREST-E study), ethyl-EPA (TREND-HD study), and coenzyme Q10 (2CARE study). While these small molecules targeting mitochondrial function showed efficacy in some rodent models (Ferrante et al., 2000; Yang et al., 2009; Hickey et al., 2012) (although there is also conflicting data: Menalled et al., 2010), they mainly yielded negative findings in the clinics, emphasizing the urgent need for pharmacodynamic biomarkers. However, olesoxime is the first small molecule to modulate soluble levels of mutant HTT, which can be quantified in CSF, plasma and other tissues from animal models and patients with Huntington’s disease using a TR-FRET (Baldo et al., 2012; Weiss et al., 2012) or mutant HTT immunoassay (Wild et al., 2015), and could therefore potentially serve as a biomarker.
Can it be beneficial to reduce mutant HTT aggregation?
We observed a reduction in mutant HTT aggregation in olesoxime-treated BACHD rats. It is widely accepted that aggregates are not the most toxic species of mutant HTT, and reducing aggregation has even been found to enhance Huntington’s disease-related pathologies (Arrasate and Finkbeiner, 2012). However, it is likely that in these cases, reduced aggregation was accompanied by an increase in mutant HTT fragments, as truncated mutant HTT, not its full-length form, is thought to mediate mutant HTT toxicity (Arrasate et al., 2004). This is different from our study, as olesoxime specifically reduced mutant HTT fragments, but led to an increase in soluble full-length mutant HTT and endogenous rat HTT. There is evidence that not only mutant HTT but also wild-type HTT fragments have cytotoxic properties (Nasir et al., 1995; Hackam et al., 1998; Kim et al., 1999), while the full-length form of wild-type HTT exerts protective effects (Leavitt et al., 2001; Tanaka et al., 2006). Our results further support the idea that soluble full-length mutant HTT is non-toxic, as we did not detect any adverse effects of olesoxime treatment in vivo. Suppression of mutant HTT cleavage and aggregation might also exert secondary beneficial effects by increasing wild-type HTT levels.
It should be noted that the reduction of mutant HTT aggregates in olesoxime-treated BACHD rats might not only derive from reduced cleavage, but could be an effect of increased protein degradation. Calpain activation has been shown to interfere with autophagic degradation processes (Yousefi et al., 2006; Xia et al., 2010), and inhibiting calpain activity enhances autophagy (Kuro et al., 2011; Kim et al., 2013; Menzies et al., 2014). The increase in soluble mutant HTT that paralleled the decline in aggregation in the BACHD rat might, however, argue against a strong increase in mutant HTT degradation.
Is it relevant and safe to suppress calpain activity in neurodegenerative diseases?
The calpain proteolytic system has been recognized as an important player in neurodegenerative diseases (Haacke et al., 2007; Samantaray et al., 2008; Getz, 2012; Stifanese et al., 2014), including Huntington’s disease (Gafni and Ellerby, 2002). The pivotal role is underpinned by current studies addressing the mechanistic link between calpains and Ca2+ dysbalance (Gladding et al., 2012), mitochondrial dysfunction (Wang et al., 2014), axonal degeneration (Yang et al., 2013), inflammation (Zhang et al., 2014), and apoptosis (Sobhan et al., 2013). A variety of calpain inhibitors have been developed to counteract the detrimental effects of calpain activation, but unspecific inhibitors and strong inhibition might exert off-target and side effects (Donkor, 2014). Such effects are less likely to arise from olesoxime treatment, as this probably affects calpains indirectly, and only lowers their activation. In this regard, we recently demonstrated that decreasing calpain activity in a mouse model of Parkinson’s disease by cross-breeding with calpastatin-overexpressing mice, ameliorates Parkinson’s disease-related pathologies (Diepenbroek et al., 2014). These, as well as other data (Menzies et al., 2014), suggest that long-term reduction of calpain activity does not have deleterious effects in mice in vivo.
Conclusion
Our study reveals behavioural and neuropathological improvements in olesoxime-treated BACHD rats due to improved mitochondrial function, which halts a vicious cycle of mitochondrial defects and calpain-mediated cleavage of mutant HTT. The current findings once more emphasize the connection between mitochondrial dysfunction and the generation of calpain-derived mutant HTT fragments, which underlies the molecular pathogenesis of Huntington’s disease, and constitutes a pivotal therapeutic target. As safety, tolerance and neuroprotective properties of olesoxime have been demonstrated, both clinically and in several neurodegenerative disease models, the compound represents a promising candidate for the treatment of Huntington’s disease.
Acknowledgements
We are grateful to all MitoTarget members for helpful discussions and further want to thank Therese Stanek and Celina Tomczak for support in animal caretaking, Jean Axfanatidis for analytical chemistry, Adriana Rathore for assisting immunohistochemical staining and microscopy, Dr Nicolas Casadei for advice on aggregate quantification, and Julian Clemens for illustration support.
Funding
L.E.C., M.M., S.H.E., J.G., G.P.E., T.B., R.M.P., O.R. and H.P.N. received grants by the European Union 7th Framework Program for RTD, Project MitoTarget, Grant Agreement HEALTH-F2-2008-223388, and J.J.W. was funded by the Baden-Wuerttemberg Foundation, Research Grant Number P-BWS-SPII/3-08.
Conflict of interest
R.M.P. is employed by, and holds stock and stock options on Trophos; R.M.P. and T.B. are named as an inventor on patents covering the use of olesoxime assigned to Trophos; M.M. is currently employed by Trophos; T.B. has been, at the time the study was conducted, employed by Trophos, and is currently employed by AFM Téléthon; L.E.C. is currently employed by QPS Austria, J.G. is currently employed by Merz Pharmaceuticals; A.W. has been, at the time the study was conducted, employed by Novartis, and is currently employed by Evotec.
Supplementary material
Supplementary material is available at Brain online.
Abbreviation
- BACHD rat
Huntington’s disease rat model expressing full-length mutant huntingtin from a bacterial artificial chromosome
References
Author notes
*These authors contributed equally to this work.
#Present address: QPS Austria, Research and Development, Parkring 12, 8074 Grambach, Austria
ɸPresent address: Paediatric Nephrology Division, Heidelberg University Hospital, Im Neuenheimer Feld 430, 69120 Heidelberg, Germany
ΨPresent address: Merz Pharmaceuticals, Eckenheimer Landstraße 100, 60318 Frankfurt am Main, Germany
†Present address: Evotec AG, Manfred Eigen Campus, Essener Bogen 7, 22419 Hamburg, Germany
‡Present address: AFM Téléthon, Biotherapies Institute for Rare Diseases, 1 Rue de l’Internationale, Evry 91002, France

