


Abstract
See Hohlfeld and Schulze-Koops (doi: ) for a scientific commentary on this article.
Inclusion body myositis and T cell large granular lymphocytic leukaemia are rare diseases involving pathogenic cytotoxic CD8+ T cells. After encountering four patients with both disorders, we prospectively screened 38 patients with inclusion body myositis for the presence of expanded large granular lymphocyte populations by standard clinical laboratory methods (flow cytometry, examination of blood smears, and T cell receptor gene rearrangements), and performed muscle immunohistochemistry for CD8, CD57, and TIA1. Most (22/38; 58%) patients with inclusion body myositis had aberrant populations of large granular lymphocytes in their blood meeting standard diagnostic criteria for T cell large granular lymphocytic leukaemia. These T cell populations were clonal in 20/20 patients and stably present on follow-up testing in 15 patients a median of 350 days later. T cell aberrant loss of CD5 or gain of expression of CD16 and CD94 were common (19/42, 45%). In comparison, 2/15 (14%) age-matched patients with dermatomyositis, polymyositis, or necrotizing myopathy, and 0/20 (0%) age-matched healthy subjects had large granular lymphocyte expansions, with none of these patients having T cell aberrant expression of CD5, CD16 or CD94. Reduced blood CD4/CD8 ratio, increased blood CD8 count, and lymphocytosis were additional biomarkers highly correlated with flow cytometry-measured large granular lymphocyte expansions. Cross-sectional data suggested more aggressive disease in patients with such expansions than without. Muscle immunohistochemistry demonstrated invasion of large granular lymphocytes into muscle in 15/15 inclusion body myositis patients but in only 1/28 patients with dermatomyositis or polymyositis. The extent of CD8+ and CD57+ cells in inclusion body myositis muscle correlated with the size of blood large granular lymphocyte populations. Myofibre-invading cells expressed CD57, a marker of persistent T cell exposure to antigen and T cell aggressiveness. In many patients with inclusion body myositis, the autoimmune T cell expansion has evolved into a neoplastic-like or overtly neoplastic disorder, perhaps contributing to its relative refractoriness to immune-directed therapies previously reported.
See Hohlfeld and Schulze-Koops (doi: ) for a scientific commentary on this article.
Inclusion body myositis (IBM) and T cell large granular lymphocytic (T-LGL) leukaemia involve cytotoxic CD8+ T cells. Greenberg et al . report that, in 22 out of 38 IBM patients, the T cell expansion meets diagnostic criteria for T-LGL. These findings suggest an explanation for the refractoriness of IBM to immunomodulation.
Introduction
Inclusion body myositis (IBM) is a late onset progressive inflammatory disease of skeletal muscle. A characteristic feature of IBM muscle pathology is the presence of large numbers of clonally expanded CD8+ cytotoxic T cells infiltrating and destroying muscle ( Arahata and Engel, 1984 ; Salajegheh et al. , 2007 ). This intramuscular T cell expansion might be antigen-driven, though no specific T cell antigen has been identified. However, a B cell antigen, NT5C1A to which serum autoantibodies are present in 60–76% of patients with IBM, has been identified ( Salajegheh et al. , 2011 ; Larman et al. , 2013 ; Pluk et al. , 2013 ).
Another disorder of clonally expanded CD8+ cytotoxic T cells is T cell large granular lymphocytic leukaemia (T-LGL leukaemia). T-LGL leukaemia is a late onset clonal disorder of CD8+ cytotoxic T cells involving blood, bone marrow, spleen and liver, and frequently accompanied by an autoimmune disease ( Lamy and Loughran, 2011 ). Circulating T cells containing cytotoxic granules (large granular lymphocytes; LGLs) are visible on blood smears, and these cells can be detected by flow cytometry based on cell surface expression of CD8 and CD57 and typically aberrant decreased expression of CD5 or increased expression of CD16 or CD94 ( Morice et al. , 2003 ; Lundell et al. , 2005 ). The disease may be at an extreme end of the spectrum of cytotoxic T cell responses to antigen ( Koskela et al. , 2012 ). One hypothesis regarding its nature is that initial autoimmunity leads to expansion in the CD8+ cytotoxic population and some expanded clone escapes normal regulation and becomes neoplastic ( Rajala et al. , 2015 ). However, the optimal definition of ‘neoplasia’ for a cell type that normally proliferates in autoimmunity is uncertain and some authors have suggested the term ‘T cell immunoclones’ rather than T-LGL leukaemia for many patients ( Singleton et al. , 2015 ).
Here we report on studies of the frequent association of IBM with circulating expanded populations of LGLs, the presence of these LGLs in muscle, and related biomarkers.
Materials and methods
Patients
Patients with IBM met European Neuromuscular Centre criteria for probable or definite IBM ( Badrising et al. , 2000 ). No patients with IBM were receiving any immunotherapy. Diagnostic criteria for polymyositis were as previously reported ( Chahin and Engel, 2008 ). Diagnostic criteria for necrotizing myopathy included an immunoresponsive myopathy with muscle biopsy evidence for multifocal myofibre necrosis in the absence of endomysial inflammation and invasion of non-necrotic myofibres. Criteria for dermomyositis were the presence of a characteristic skin rash, subacute predominantly proximal weakness, and muscle biopsy evidence for perifascicular atrophy or perivascular and perimysial inflammation without endomysial inflammation.
All patient muscle samples were collected after informed written consent was obtained and under protocols approved by the Partners Human Research Committee Institutional Review Board (IRB) overseeing Brigham and Women's Hospital human research activities. Muscle strength was assessed according to the Medical Research Council (MRC) scoring system, from 0 (weakest) to 5 (strongest).
Flow cytometry
Six-colour flow cytometric immunophenotypic analysis of peripheral blood samples was performed using a Becton-Dickinson FACSCantoII flow cytometer and fluorochrome conjugated antibodies to CD2, CD3, CD4, CD5, CD7, CD8, CD14, CD16, CD19, CD45, CD56, CD57, CD94, T cell receptor αβ, and T cell receptor γδ. Results were analysed using FACS Diva software.
T cell clonality
DNA was isolated from blood and analysed by a PCR technique using primers conjugated with fluorescent dyes that hybridize to T cell receptor gamma chain ( TRG ) gene V segments 1–8, 9, 10, 11 (Vg1–8, Vg9, Vg10, Vg11) and joining regions (Jg1 and Jg2) (InVivoScribe Technologies, BIOMED). The DNA was also amplified with control primers to multiple gene segments (64 to 600 bp in length) to assess the integrity and quality of the isolated DNA. The PCR products were analysed by capillary gel electrophoresis.
STAT3 mutation testing
STAT3 deep sequencing was performed on DNA purified from whole blood from 12 patients as previously described ( Kristensen et al. , 2014 ).
Immunohistochemistry
Immunoperoxidase immunohistochemsitry was performed on 8 µm frozen muscle sections from patients with IBM using the following antibodies: monoclonal mouse CD8 (labelling human surface expressed CD8, 1:40 dilution, 1.25 µg/ml, 1 h incubation, clone DK25, cat. no. M0707, Dako), monoclonal mouse CD57 (labelling human surface expressed CD57, 1:25 dilution, 0.6 µg/ml, 1 h incubation, clone NK-1, cat. no. 157M-96, Cell Marque), monoclonal mouse TIA-1 (labelling intracellular TIA1, 1:1000 dilution, 1.0 µg/ml, 1 h incubation, clone 2G9A10F5, cat. no. 6604593, Beckman Coulter, Inc.), and mouse IgG1 negative control antibody (1:500, 1.0 µg/ml, 1 h incubation, cat. no. MAB002, R&D Systems). Secondary antibodies used were horseradish peroxidase-conjugated goat anti-mouse immunoglobulins. CD8 and CD57 immunohistochemistry were performed on muscle from 15 patients and TIA1 immunohistochemistry performed on six patients.
Results
Detection of blood clonal LGLs in patients with IBM and stability over time
Four patients, two previously reported ( Beck et al. , 2014 ), developed symptoms of muscle weakness first, and then blood cytopaenias (anaemia, neutropaenia, or thrombocytopaenia), leading first to oncologist-diagnosed T-LGL leukaemia and then to a diagnosis of IBM ( Table 1 ; Patients 1–4). These four patients had expanded populations of clonal CD8+ CD57+ T cells (LGLs).
Patients previously diagnosed or prospectively screened for T-LGL leukaemia
| Patient | Age at IBM symptoms (years) | Duration at LGL testing (years) | Lymphocytes that are LGLs (%) | Number of LGLs per µl | T cell clonality | CD4/CD8 ratio | NT5C1A antibody |
|---|---|---|---|---|---|---|---|
| 1 | 57 | 1.7 | 75 | 2165 | Oligoclonal | 0.5 | + |
| 2 | 44 | 0.4 | 34 | 431 | Clonal | 0.4 | − |
| 3 | 43 | 4.4 | 38 | 284 | Clonal | 0.9 | − |
| 4 | 59 | 0.2 | 45 | 743 | Clonal | 0.6 | + |
| 5 | 63 | 10.0 | 53 | 1600 | Clonal | 0.3 | + |
| 6 | 55 | 12.4 | 43 | 862 | Clonal | 0.6 | + |
| 7 | 63 | 8.1 | 42 | 958 | Clonal | 0.3 | + |
| 8 | 65 | 1.7 | 41 | 2106 | Oligoclonal | 0.5 | + |
| 9 | 46 | 14.9 | 39 | 380 | Clonal | 0.9 | − |
| 10 | 50 | 23.4 | 36 | 568 | Oligoclonal | 1.1 | + |
| 11 | 69 | 10.4 | 34 | 938 | Oligoclonal | 0.6 | + |
| 12 | 58 | 2.0 | 34 | 614 | Oligoclonal | 0.7 | + |
| 13 | 55 | 5.0 | 33 | 1275 | Clonal | 0.9 | N/A |
| 14 | 46 | 6.4 | 32 | 687 | Clonal | 0.6 | + |
| 15 | 74 | 2.5 | 31 | 1269 | Clonal | 0.7 | − |
| 16 | 52 | 2.2 | 30 | 315 | Clonal | 0.8 | + |
| 17 | 75 | 6.4 | 24 | 476 | Oligoclonal | 1.3 | − |
| 18 | 48 | 10.7 | 22 | 660 | Clonal | N/A | + |
| 19 | 69 | 5.0 | 22 | 236 | N/A | 1.3 | N/A |
| 20 | 66 | 7.8 | 21 | 338 | Oligoclonal | 0.8 | + |
| 21 | 49 | 9.0 | 20 | 510 | Clonal | 1.3 | + |
| 22 | 56 | 10.0 | 19 | 503 | Clonal | 1.4 | N/A |
| 23 | 56 | 18.9 | 18 | 205 | Clonal | 1.0 | + |
| 24 | 47 | 16.1 | 18 | 196 | Clonal | 1.1 | − |
| 25 | 68 | 3.6 | 18 | 358 | Biclonal | 2.2 | + |
| 26 | 57 | 11.5 | 16 | 381 | N/A | 1.5 | − |
| 27 | 48 | 7.7 | 15 | 166 | Clonal | 1.8 | + |
| 28 | 74 | 10.0 | 12 | 185 | N/A | 1.8 | N/A |
| 29 | 51 | 3.6 | 12 | 91 | Indeterminate | 2.6 | + |
| 30 | 64 | 3.5 | 10 | 156 | Polyclonal | 2.3 | + |
| 31 | 58 | 6.3 | 10 | 235 | Indeterminate | 5.0 | − |
| 32 | 64 | 9.2 | 10 | 277 | Polyclonal | 3.5 | − |
| 33 | 42 | 4.0 | 9 | 212 | N/A | 2.1 | N/A |
| 34 | 40 | 9.4 | 9 | 108 | Polyclonal | 1.5 | N/A |
| 35 | 50 | 15.9 | 9 | 142 | Indeterminate | 4.2 | N/A |
| 36 | 61 | 20.0 | 8 | 114 | Polyclonal | 3.7 | − |
| 37 | 68 | 4.8 | 7 | 98 | Clonal | 6.2 | − |
| 38 | 39 | 24.7 | 5 | 88 | Clonal | 2.1 | − |
| 39 | 41 | 8.3 | 4 | 86 | Clonal | 1.9 | + |
| 40 | 59 | 6.0 | 4 | 41 | Polyclonal | 4.6 | + |
| 41 | 44 | 24.9 | 3 | 35 | Indeterminate | 2.9 | + |
| 42 | 63 | 12.0 | 2 | 46 | Clonal | 2.4 | + |
Patients 1–4 had diagnoses of T-LGL leukaemia made by oncologists. Patients 5–42 had no suspicion for a haematological disorder and were screened prospectively for T-LGL leukaemia. N/A = not available.
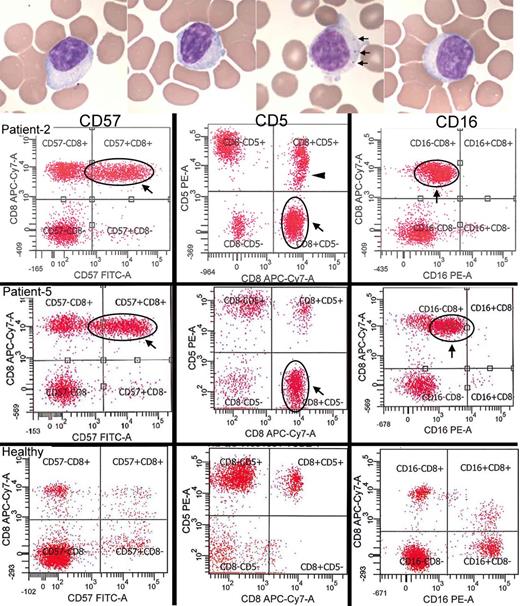
As the co-occurrence of IBM with T-LGL leukaemia seemed beyond chance, we prospectively screened 38 unselected patients with IBM for T-LGL leukaemia by blood flow cytometry and blood TRG chain gene rearrangement studies indicative of T cell clonality ( Table 1 ; Patients 5–42). Abnormal LGL expansions (>15% of total lymphocytes; Lima et al. , 2001 ) were found in 22/38 (58%) of IBM patients ( Fig. 1 ). Blood smear examination confirmed the presence of LGLs in all 22 patients ( Fig. 1 A). The mean age of these 38 patients was 66 years (range 46–84). We prospectively performed flow cytometry on an age-matched healthy subject cohort of 20 patients (mean age 64, range 38–83); no healthy subject had an LGL count >15% of total lymphocytes.
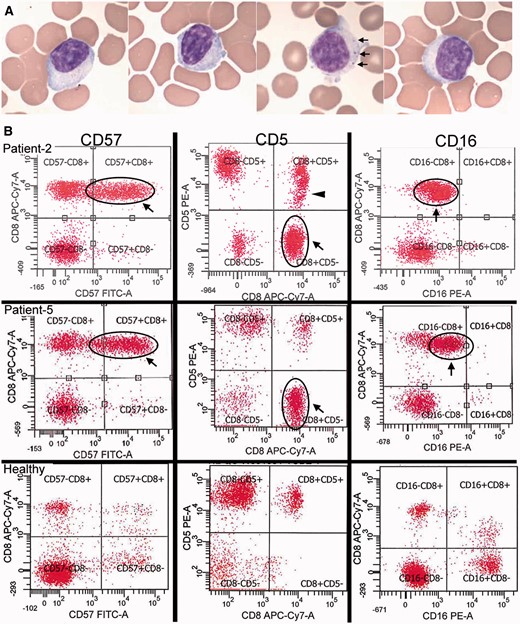
Detection of large granular lymphocytes by blood smears and flow cytometry. ( A ) Blood smears from four patients demonstrating large lymphocytes with eccentric nuclei and sometimes visible cytotoxic granules (seen in one of the patients, arrows). ( B ) Two IBM patients (Patients 2 and 5) with large CD8+ CD57+ expansions of T-LGLs that are aberrant with CD5-negative ( middle ) and CD16-dim ( right ) expression. Patient 2 additionally has a CD5-dim population (arrowhead). In comparison, healthy patient flow cytograms. With permission, Inclusion Body Myositis Foundation.
Clonality of these LGL expansions was examined in 34 of 38 patients. All 20/20 (100%) tested patients with LGL expansions had single clones (clonal) or several clones (oligoclonal) of T cells. In patients without LGL expansions, clonal populations were present in 5/14 (36%) patients.
LGL populations were stably present on longitudinal studies. On follow-up in 15 patients (10 with and five without abnormal expansions) a median of 350 days (range 103–1048) after initial testing, all patients with an initial T-LGL expansion (>15% of lymphocytes) continued to have an expansion on follow-up, while all patients without an initial T-LGL expansion remained without an expansion on follow-up ( Supplementary Fig. 1 ).
Aberrant expression of surface markers of aggressiveness by IBM blood T-LGLs
These CD8+ CD57+ T cell expansions frequently showed abnormally altered expression of surface molecules associated with neoplastic or aggressive T cell behaviour. Aberrant expression of cell surface markers CD5, CD16, or CD94 on CD8+ CD57+ cells was present in 19/26 (85%) of screened IBM patients who had LGL expansions, or 22/42 (52%) of all IBM patients. Loss of CD5 expression, a molecule typically expressed on all T cells and a subset of B cells, seen in 8/42 (19%) patients, was particularly remarkable ( Fig. 2 ). The gain of CD56 expression on CD8+ T cells was prominent in 5/42 patients and these sometimes constituted only a subpopulation of the CD8+ CD57+ cells ( Supplementary Fig. 2 ).
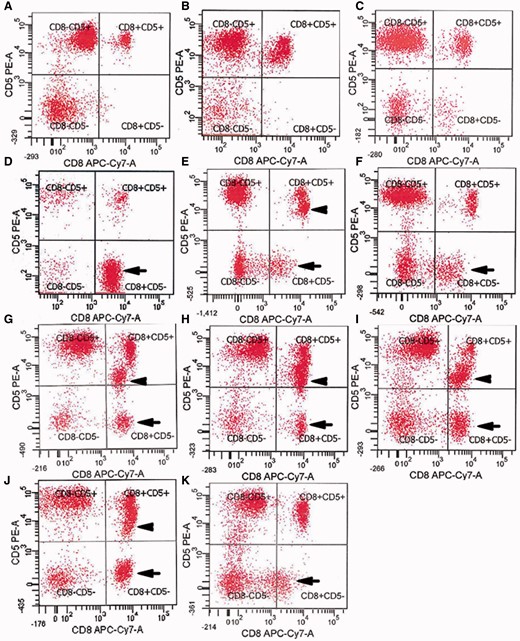
Aberrant loss of expression of CD5 by CD8+ T cells in IBM blood. ( A – C ) Normal expression of CD5 on essentially all CD8+ T cells in ( A ) healthy subject, ( B ) patient with dermomyositis, ( C ) patient with polymyositis. ( D – K ) Loss of CD5 in a subpopulation of CD8+ T cells (arrows) in patients with IBM (Table 1, Patients 5, 25, 31, 21, 14, 12, 2, 19). Some of these patients have both CD5-dim (arrowheads) and CD5− populations. x -axes: CD8; y -axes: CD5.
Most IBM patients met criteria for a diagnosis of T-LGL leukaemia
These T-LGL expansions met oncologist-defined criteria for a diagnosis of T-LGL leukaemia in most patients. Criteria of an expanded LGL population with an associated autoimmune disease ( Bareau et al. , 2010 ) were met by 22 of 38 screened patients (58%). Criteria of an LGL count of >500 LGLs/µl clonality by TRG chain rearrangement, and the presence of an autoimmune disease (IBM) ( Lamy and Loughran, 2011 ) was met by 13 of 38 screened patients (34%).
T-LGL leukaemia is associated with somatic mutations in STAT3 that are present in 21–75% of patients in reported cohorts ( Jerez et al. , 2012 ; Koskela et al. , 2012 ; Qiu et al. , 2013 ; Ishida et al. , 2014 ; Kristensen et al. , 2014 ; Rajala et al. , 2015 ). We therefore performed deep sequencing of STAT3 from whole blood in 10 patients ( Table 1 , Patients 2, 3, 5, 8, 10, 11, 14, 15, 17, 23) with IBM and T-LGL expansions and two patients without T-LGL expansions (Patients 27 and 30); no STAT3 mutations were detected.
Clonal responses were identified in some patients with very low levels of LGLs (2–5% LGLs). Criteria for the diagnosis of T-LGL leukaemia involving the abundance of LGLs present may not fully reflect the pathogenic implications of clonal LGL responses in IBM, as has also been noted in T-LGL leukaemia, with small clones resulting in immune mediated cytopaenias ( Singleton et al. , 2015 ).
Specificity of blood clonal LGL expansions in IBM compared to other inflammatory myopathies
T-LGL leukaemia is associated with a variety of autoimmune diseases and LGL expansions may be age-related ( Lamy and Loughran, 2011 ). To understand the specificity of LGL expansions to IBM amongst the inflammatory myopathies and the older population, screened IBM patients ( n = 38, mean age 66) were compared with elderly healthy controls ( n = 20, mean age 64) and other patients with inflammatory myopathies ( n = 15, six with dermatomyositis, five with polymyositis, and four with necrotizing myopathy; mean age 61). LGL expansions by flow cytometry were present in 22/38 (58%) of IBM patients, 2/15 (14%; P = 0.0005) of other inflammatory myopathies, and 0/20 (0%; P < 0.0001) of healthy subjects ( Fig. 3 ). Aberrant expression of cell surface markers CD5, CD16, or CD94 on CD8+ CD57+ cells was present in 17/38 (45%) of all screened IBM patients compared with 0/15 (0%; P < 0.0001) of age-matched patients with other inflammatory myopathies and 0/20 (0%; P < 0.0001) of age-matched healthy subjects.
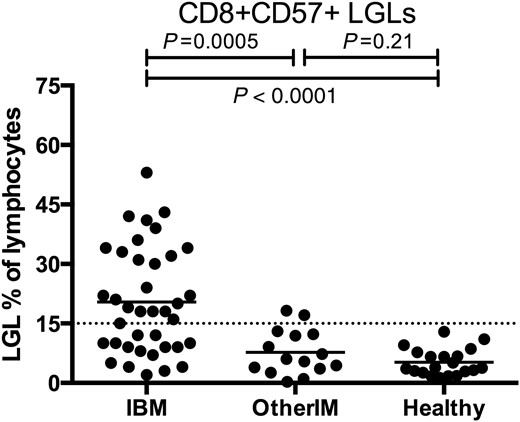
LGL expansions in prospectively screened IBM and age-matched other inflammatory myopathy and healthy subjects. Comparison of IBM ( n = 38, mean age 66 years) with other inflammatory myopathies (OtherIM) ( n = 15, mean age 61) and healthy subjects ( n = 20, mean age 64) shows increased proportions of IBM patients with LGL expansions.
Blood biomarkers of IBM and LGL expansions: reduced CD4/CD8 ratios, expanded CD8 counts and lymphocytosis
T-LGL expansions in patients with IBM were detected by flow cytometry as standardized in a hospital clinical laboratory. We assessed the capability of the CD4/CD8 ratio and CD8 count, less expensive standard laboratory tests, to substitute for flow cytometry. All patients except for one with T-LGL expansions by flow cytometry had CD4/CD8 ratios of ≤1.5, while all patients without expanded populations had CD4/CD8 ratios of ≥1.5 ( Fig. 4 A). The reduction in the CD4/CD8 ratio was not due to reductions in CD4 counts (699 versus 770 µl/l, P = 0.27) but instead to expansions in absolute numbers of blood CD8 cells (886 versus 269 μl/l, P < 0.0001) ( Fig. 4 B and C). Less commonly, the CD8 expansion was reflected in the CBC differential as a lymphocytosis (9/26 patients with T-LGL expansions, 35% versus 0/16 patients, 0% without T-LGL expansions). Neutropaenia (4/26, 15% versus 0/16, 0%) and thrombocytopaenia (7/26, 27% versus 0/16, 0%) were also seen with increased frequency.
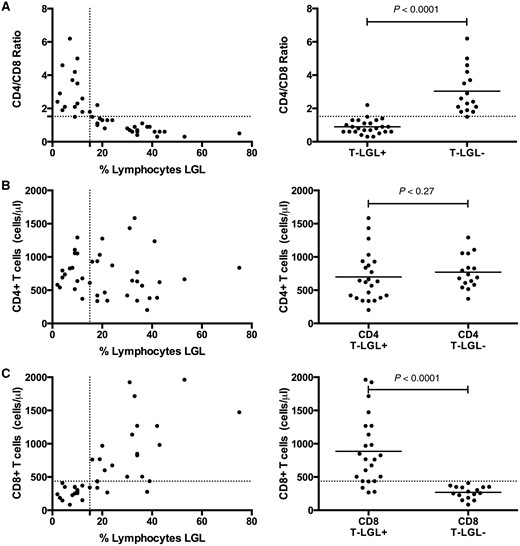
Reduced CD4/CD8 ratios due to expanded CD8 counts in patients with LGL expansions. ( A ) A CD4/CD8 threshold ratio of 1.5 was an excellent classifier for absence (ratio > 1.5) or presence (ratio ≤ 1.5) of LGL expansion (defined by > 15% of lymphocytes being LGLs). The reduction in CD4/CD8 ratio is not due to reduction of ( B ) CD4 count but rather due to expansion of the ( C ) CD8 count.
Clinical associations in patients with and without blood LGL expansions
Screened patients with or without T-LGL expansions did not differ in age at onset of IBM symptoms (mean 58 versus 54 years, P = 0.24), age at LGL testing (mean 67 versus 65 years, P = 0.44), or duration of IBM symptoms at time of LGL testing (mean 9.0 versus 10.6 years; P = 0.68) ( Supplementary Fig. 3 ). Patients diagnosed with T-LGL leukaemia by oncologists did have presenting findings of cytopaenias, and underwent diagnostic testing for LGL with shorter duration of IBM symptoms compared to screened patients found to have T-LGL expansions (mean 1.7 versus 9.0 years; P = 0.003). There was no difference in the presence of serum anti-NT5C1A antibodies ( P = 1.0, Fisher’s exact test) between patients with or without T-LGL expansions.
Using cross-sectional data, we looked at whether patients with T-LGL expansions had more aggressive disease by examining the aggregate rate of decline in strength in three commonly affected muscle groups (finger flexors, quadriceps, and ankle dorsiflexion). Strength decline over time was steeper in patients with T-LGL expansions compared to those without T-LGL expansions ( Fig. 5 ), suggesting T-LGL expansions are associated with more aggressive disease.
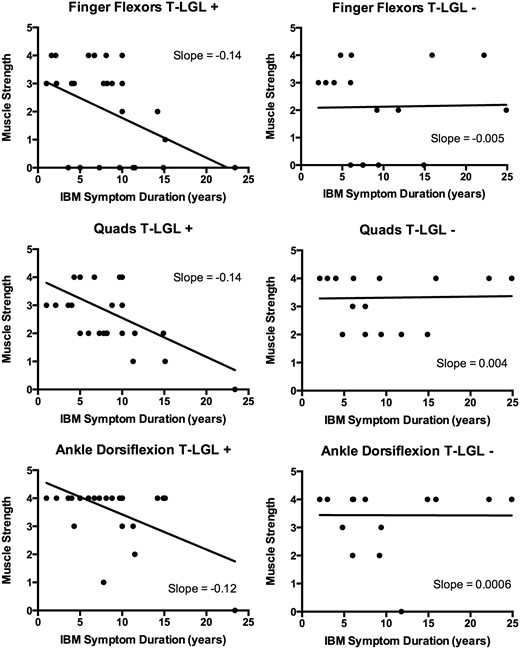
Cross-sectional relationships between muscle strength and symptom duration in patients with ( left ; T-LGL+) and without ( right ; T-LGL−) T-LGL expansions. For each patient, the MRC strength score (scale 0–5, with 0 complete paralysis and 5 full strength) of the weakest finger flexor, weakest quadriceps, and weakest ankle dorsiflexor at a defined time in their course is plotted. More negative slopes are present for all three muscle groups in T-LGL+ patients compared with T-LGL− patients.
IBM muscle tissue infiltration by LGLs
Patients with T-LGL leukaemia typically have tissue invasion of LGLs into bone marrow, spleen, liver or other organs. In patients with IBM, we wondered if LGLs were invading muscle. Commonly studied immunohistochemical markers of LGLs in bone marrow are CD8, CD57, and TIA1. Muscle immunohistochemistry from 15 patients demonstrated abundant CD8+ and CD57+ ( Fig. 6 ), and from six patients, TIA1+ (data not shown) cell infiltration into skeletal muscle. CD57 marked aggressive T cells densely surrounding and invading myofibres ( Fig. 6 B).
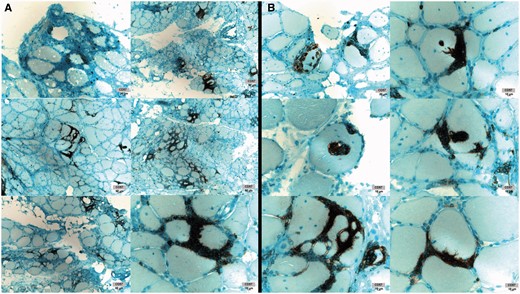
IBM muscle CD57+ cell infiltration. ( A ) Dense T cell infiltrates containing CD57+ cells. ( B ) Myofibre invasion by CD57+ cells. Images from six patients shown. With permission, Inclusion Body Myositis Foundation.
We also performed immunohistochemical staining for CD8 and CD57 in 28 patients with polymyositis ( n = 11) and dermatomyositis ( n = 17), mean age 49 years (range 31–73). A few CD57+ cells were seen in only one patient with polymyositis, with no other polymyositis or dermomyositis patients showing any CD57+ cells ( Supplementary Fig. 4 ).
Relationship between muscle large granular lymphocyte infiltration and blood biomarkers of LGLs
We correlated numbers of CD8+ and CD57+ infiltrating cells, measured using a qualitative scale of 0 (no endomysial cells) to 5 (most number of endomysial cells), with the size of blood LGL expansions and CD4/CD8 ratios. Muscle biopsies and blood LGL measurements were not generally simultaneous. Higher muscle CD8 ( P = 0.004; Spearman rank correlation) and CD57 ( P = 0.003) inflammatory grades were associated with larger blood LGL expansions ( Fig. 7 ). Muscle CD8 ( P = 0.0005; Spearman rank correlation) and CD57 ( P = 0.006) were also associated with lower CD4/CD8 ratios. The blood measurement of the CD4/CD8 ratio was predictive of the degree of inflammatory cell infiltrate in muscle.
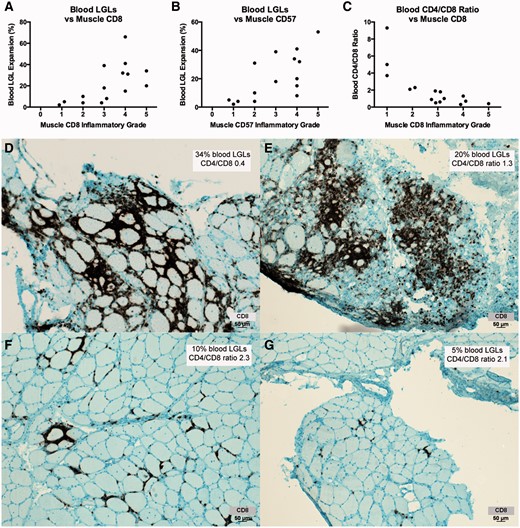
Blood LGL expansions and reduced CD4/CD8 ratios are associated with muscle CD8 and CD57 inflammatory grade. ( A – C ) Increased numbers of muscle CD8+ cells and CD57+ cells is correlated with increased numbers of CD8+ CD57+ blood LGLs and reduced CD4/CD8 ratios. ( D – G ) CD8 immunohistochemistry of muscle from four patients ( D , Patient 2; E , Patient 21; F , Patient 30, G , Patient 38) illustrates relationships between blood LGL and muscle CD8 expansions. With permission, Inclusion Body Myositis Foundation.
Discussion
The pathogenesis of IBM has been recognized to include CD8+ T cell cytotoxicity since 1984 ( Arahata and Engel, 1984 , 1988 a , b ). These muscle-invading cytotoxic T cells have proliferated into sets of T cell clones ( Lindberg et al. , 1994 ; O'Hanlon et al. , 1994 ; Fyhr et al. , 1996 , 1997 ; Amemiya et al. , 2000 ; Muntzing et al. , 2003 ; Dimitri et al. , 2006 ; Salajegheh et al. , 2007 ), some of which can also be detected in blood ( Fyhr et al. , 1996 ; Dimitri et al. , 2006 ; Salajegheh et al. , 2007 ). T cells are proliferating within muscle, given their expression of the proliferation marker Ki-67 ( Lindberg et al. , 1995 ) and the greater degree of clonality in muscle than in blood in paired samples from the same patients ( Fyhr et al. , 1996 ; Salajegheh et al. , 2007 ). Clonality of myofibre-invading T cells but not endomysial interstitial T cells has been demonstrated by immunohistochemistry in one patient ( Bender et al. , 1998 ). Whether or what antigens are recognized by these T cell clones are unknown.
Here we have further defined aspects of IBM T cell pathogenesis and the relationship of IBM to the clinical entity T-LGL leukaemia. Specifically, we found that in most patients with IBM in this study: (i) blood clonal CD8+ T cell populations were present and readily detectable by standard clinical laboratory tests; (ii) the size of the blood CD8+ CD57+ T cell populations frequently exceeded clinical upper limits of normal; (iii) the phenotype of these T cells, using cell surface markers routinely used in hospital clinical pathology services, indicates heightened aggressiveness and is routinely diagnosed as T-LGL leukaemia; (iv) expanded blood T-LGL populations have moderate but imperfect correlation with more aggressive disease; (v) these LGL phenotype T cells are present in endomysial locations in muscle and constitute the most aggressive myofibre-invading cells; and (vi) abundance of muscle invading LGLs is correlated with abundance of blood LGLs. Collectively, these findings have implications for the diagnosis, pathogenesis, management of, and drug development for IBM.
The expression of the natural killer cell marker CD57 on CD8+ T cells is widely believed to indicate persistent antigenic stimulation. CD8+ CD57+ T cells secrete higher levels of cytokines and have higher cytotoxic potential than CD8+ T cells lacking CD57 expression ( Strioga et al. , 2011 ). We found that IBM muscle contains large numbers of myofibre invading CD57+ cells and that in most patients expanded numbers of these cells could also be found in blood.
Another relevant marker of antigen-experienced CD8+ T cells is CD28, which has previously been studied in two publications for IBM ( Pandya et al. , 2010 ; Allenbach et al. , 2014 ). As CD8+ T cells differentiate in response to antigen, they lose expression of CD28 and gain expression of CD57 ( Strioga et al. , 2011 ). The loss of CD28 appears to precede that of the gain of CD57 ( Strioga et al. , 2011 ), so that CD57 marks T cells that are almost always also CD28−, but may be a more differentiated subset of the CD28 population ( Weekes et al. , 1999 ; Onyema et al. , 2015 ). The CD8+ CD28− population has been previously reported to be expanded in IBM blood compared to healthy controls but with considerably more overlap than we have found with the CD8+ CD57+ population; these differences could be due to lack of age-matched controls (median age for IBM 76 years versus 54 years for healthy controls) and treatment effects (53% of IBM patients treated with immunosuppressive medications) in those previous studies ( Pandya et al. , 2010 ). Previously reported immunohistochemical studies attempting to define the CD8+ CD28− population in IBM, polymyositis, and dermomyositis muscle have used detection of a surrogate marker CD244, rather than loss of CD28 ( Fasth et al. , 2009 ; Pandya et al. , 2010 ).
The current studies suggest that in many patients with IBM, the autoimmune process has evolved into a neoplastic-like process. T-LGL leukaemia is typically recognized when the expanded LGL T cells cause cytotoxic autoimmunity on blood cells, resulting in anaemia, neutropaenia, or thrombocytopaenia ( Rose and Berliner, 2004 ; Lamy and Loughran, 2011 ). In IBM, LGL populations are exerting autoimmunity against muscle fibres. Exactly how to define the distinction between an autoimmune expansion of clonal antigen-directed cytotoxic T cells, as seen in IBM and other autoimmune diseases, and a neoplastic expansion, as implied by the term T-LGL leukaemia, is an area of uncertainty ( Schrenk et al. , 2013 ; Singleton et al. , 2015 ). Some authors have suggested the terminology ‘T cell immunoclones’ to describe expansions resulting in immune-mediated effects (e.g. cytopaenias; organ autoimmunity) and reserve the term ‘leukaemia’ for expansions resulting in disease from other properties of these cells ( Singleton et al. , 2015 ).
The refractoriness of IBM to the few immune therapies that have been reported has suggested to many that IBM may primarily be a degenerative disorder with inflammation having a secondary role. Alternatively, the refractoriness of IBM may instead be related to the more aggressive and neoplastic nature of muscle invading T-LGL clones. In T-LGL leukaemia, T cell clones have escaped normal immune control mechanisms that limit autoimmune expansions, such as Fas-related apoptosis ( Lamy et al. , 1998 ; Liu et al. , 2002 ; Shah et al. , 2008 ). The appearance of these CD57+ cells in IBM muscle, with its slowly progressive phenotype, suggests that they are long-lived and difficult to eradicate, in agreement with a similar view of the longevity of the CD8+ CD57+ population in blood ( Strioga et al. , 2011 ). Both CD57+ and CD28− cells have been reported as highly resistant to apoptosis and activation-induced cell death ( Posnett et al. , 1999 ; Vallejo et al. , 2000 ), and their likely role in IBM refractoriness previously noted ( Pandya et al. , 2010 ). Current immunotherapies are unable to eradicate T-LGL leukaemic clones in blood ( Rajala et al. , 2015 ). The aberrant expression of CD5, CD16, and CD94 on these cells all confer heightened autoimmunity and escape from immune regulation. CD5 is a negative regulator of T cell receptor signalling ( Dalloul, 2009 ) and loss of CD5 on human T cells, as seen in eight patients with IBM with LGL expansions in this series, results in increased T cell activation, responsiveness to cytokines, and inflammation ( Herndler-Brandstetter et al. , 2011 ). We are unaware of any autoimmune diseases in which loss of CD5 on CD8+ T cells has been reported. The T cell expression of CD16, the Fcγ receptor III expressed by natural killer cells ( Cooper et al. , 2001 ) and of CD94, a receptor that can under some circumstances provide T cells with a ‘license to kill’ independently of T cell CD3 receptor engagement with antigen ( Groh et al. , 2003 ; Sollid, 2004 ), suggest a reprogramming of T cells into an autoaggressive phenotype ( Meresse et al. , 2006 ). Expression of CD56 by CD8+ T cells correlates with increased cytotoxic effector function including increased IFNγ production and cytolytic activity ( Pittet et al. , 2000 ; Ohkawa et al. , 2001 ).
Separate from pathophysiological implications of these findings, here we have identified several IBM biomarkers in blood that may ultimately be of value for diagnosis and monitoring of treatment responses in patients. Until the recent identification of circulating anti-NT5C1A antibodies in IBM ( Salajegheh et al. , 2011 ; Larman et al. , 2013 ; Pluk et al. , 2013 ), no blood biomarker for IBM was available. Here we found that manually reviewed blood smears of patients with IBM frequently demonstrate increased populations of LGLs, routine complete blood counts may demonstrate a lymphocytosis, which always went unrecognized in our patients, and flow cytometry studies may demonstrate expanded populations of CD8+ CD57+ cells. The CD4/CD8 ratio or the CD8 count, routine laboratory tests, are likely excellent surrogates for flow cytometry for screening for expanded IBM LGL blood populations. These blood biomarkers are tied to the pathophysiology of IBM, so that their measurement could be useful in early stage drug development.
Lastly, further characterization of potential phenotypic differences between IBM patients with and without T-LGL expansions might be revealing. Here we found that patients with blood LGL expansions have greater degrees of T cell inflammation in muscle, likely reflecting the same population of expanded T-LGLs present in muscle and blood. Patients with LGL expansions may on average have more aggressive progression of weakness but longitudinal correlation with disease severity would be required to adequately address this possibility.
Funding
No funding was received towards this work.
Supplementary material
Supplementary material is available at Brain online.
Abbreviations
References
Author notes
See Hohlfeld and Schulze-Koops (doi: ) for a scientific commentary on this article.

