


Abstract
Reduced cerebral blood flow impairs cognitive function and ultimately causes irreparable damage to brain tissue. The gliovascular unit, composed of neural and vascular cells, assures sufficient blood supply to active brain regions. Astrocytes, vascular smooth muscle cells, and pericytes are important players within the gliovascular unit modulating vessel diameters. While the importance of the gliovascular unit and the signals involved in regulating local blood flow to match neuronal activity is now well recognized, surprisingly little is known about this interface in disease. Alzheimer’s disease is associated with reduced cerebral blood flow. Here, we studied how the gliovascular unit is affected in a mouse model of Alzheimer’s disease, using a combination of ex vivo and in vivo imaging approaches. We specifically labelled vascular amyloid in living mice using the dye methoxy-XO4. We elicited vessel responses ex vivo using either pharmacological stimuli or cell-specific calcium uncaging in vascular smooth muscle cells or astrocytes. Multi-photon in vivo imaging through a cranial window allowed us to complement our ex vivo data in the presence of blood flow after label-free optical activation of vascular smooth muscle cells in the intact brain. We found that vascular amyloid deposits separated astrocyte end-feet from the endothelial vessel wall. High-resolution 3D images demonstrated that vascular amyloid developed in ring-like structures around the vessel circumference, essentially forming a rigid cast. Where vascular amyloid was present, stimulation of astrocytes or vascular smooth muscle cells via ex vivo Ca2+ uncaging or in vivo optical activation produced only poor vascular responses. Strikingly, vessel segments that were unaffected by vascular amyloid responded to the same extent as vessels from age-matched control animals. We conclude that while astrocytes can still release vasoactive substances, vascular amyloid deposits render blood vessels rigid and reduce the dynamic range of affected vessel segments. These results demonstrate a mechanism that could account in part for the reduction in cerebral blood flow in patients with Alzheimer’s disease.
Alzheimer’s disease is associated with reduced cerebral blood flow. Using a mouse model of the disorder, Kimbrough et al. examine how vascular amyloid affects the regulation of blood flow by the gliovascular unit. Results reveal that amyloid deposits render blood vessels rigid, reducing their dynamic range.
Introduction
The brain consumes 20% of the body’s total energy, a demand that can only be met through oxidative phosphorylation. Because the brain lacks significant fuel reserves, an uninterrupted supply of oxygen and glucose is essential. Any reduction in cerebral blood flow results in near-immediate cognitive impairment and irreparable ischaemic damage of brain tissue within just a few minutes.
Alzheimer’s disease is a devastating condition that poses a major threat to healthcare delivery systems given the ageing population. Reduced cerebral blood flow to the cortex is well documented in patients with Alzheimer’s disease (Smith et al., 1999; Bookheimer et al., 2000; Ruitenberg et al., 2005) and cerebrovascular disease is a known co-morbidity of Alzheimer’s disease (Shi et al., 2000; Iadecola, 2004; Zlokovic, 2011). The reduction of cerebral blood flow in patients with Alzheimer’s disease may thus cause ischaemic damage to neurons, suggesting that neurovascular dysfunction may contribute to Alzheimer’s disease initiation and progression (Iadecola, 2004; Takano et al., 2007; Zlokovic, 2011).
Amyloid-β deposits are a pathological hallmark of Alzheimer’s disease and non-invasive amyloid PET imaging indicates that amyloidosis precedes cognitive decline by many years (Morris et al., 2009). In addition to its toxicity to neurons, amyloid-β may also influence the cerebral vasculature; amyloid-β accumulates in the walls of cerebral vessels (Mandybur, 1975; Vinters, 1987), a pathology termed cerebral amyloid angiopathy or vascular amyloid, and these deposits can narrow the lumen of vessels and induce vasoconstriction (Crawford et al., 1997). Mouse models of Alzheimer’s disease replicate this amyloid pathology, both in parenchymal plaques and vascular amyloid deposits (Gotz and Ittner, 2008).
In the normal brain, glial, neural, and vascular cells cooperate as a functional system called the gliovascular unit (GVU) to ensure continuous blood supply that correlates with neuronal activity. Already high during rest, oxygen and glucose demands increase even further in active brain regions. These constantly occurring spatial fluctuations in energy demand require a similarly flexible adjustment of the cerebral blood flow. This process is called ‘functional hyperaemia’ or neurovascular coupling and is regulated by the GVU (Iadecola and Nedergaard, 2007).
Astrocytes, glial cells in the brain and spinal cord, are ideally positioned within the GVU to mediate functional hyperaemia. They have two types of processes: large perivascular end-feet that cover the entire cerebral vasculature and finer processes enwrapping neuronal synapses. Astrocytes respond to neuronal activity by increases in intracellular calcium ([Ca2+]i). This causes the release of vasoactive factors that act on the contractile cells within the GVU, vascular smooth muscle cells (VSMC) or pericytes, to modulate blood vessel diameter.
In a recent study, we showed that invading primary brain tumours intercalate between astrocyte end-feet and blood vessels and in so doing disrupt the ability of vascular cells to respond to vasoactive molecules released from the astrocyte end-feet (Watkins et al., 2014).
In Alzheimer’s disease, the anatomy of the GVU is altered. Specifically, ultrastructural studies show endothelial cell degeneration, capillary distortions, blood–brain barrier abnormalities, thickening of the basement membrane, degenerating pericytes, and perivascular neuroinflammation (Shi et al., 2000; Iadecola, 2004; Zlokovic, 2011). In light of the prominent vascular amyloidosis seen in pathological specimens (Farkas and Luiten, 2001) we hypothesized that vascular amyloid may physically interfere with gliovascular signalling and this may contribute to cerebral hypoperfusion in Alzheimer’s disease.
Using a combination of in vivo and ex vivo imaging of the GVU in the hAPPJ20 mouse model of Alzheimer’s disease, we found abundant amyloid deposits on blood vessels, age-dependent cortical reactive gliosis, and loss of astrocyte polarity. Ultrastructural electron microscopy studies and high-resolution confocal and multi-photon images showed the amyloid deposits directly attached to the vessel wall, disrupting the normal contact of astrocytic end-feet with the vessel. Direct stimulation of astrocytes produced limited functional responses in segments of vessels affected by vascular amyloid. Furthermore, even direct smooth muscle stimulation failed to elicit normal vascular responses when amyloid deposits were present. Closer examination of individual vessels showed that amyloid deposits formed a physical cast making the blood vessels more rigid and unable to constrict and dilate to the same extent as vessel areas free of amyloid.
Material and methods
Animals
The hAPPJ20 line overexpresses the hAPP (human APP) minigene with Swedish (K670M/N671L) and Indiana (V717F) mutations under control of the PDGFB promoter (Mucke et al., 2000). Mice were on a congenic C57BL/6 J background (>15 backcrosses). Hemizygote males were bred with C57BL/6 females to produce hAPPJ20 mice used for experiments and littermate non-transgenic controls. Male and female mice were used for all experiments (Supplementary Table 1). Mice were kept on a 12-h light/ 12-h dark cycle and had ad libitum access to food and water. The studies were approved by the Institutional Animal Care and Use Committees of the University of Alabama at Birmingham and were conducted in compliance with the National Institutes of Health’s ‘Guide for the Care and Use of Laboratory Animals.’
Electron microscopy
hAPPJ20 and control animals were transcardially perfused with phosphate-buffered saline (PBS) followed by a fixation solution of 2.5% glutaraldehyde and 4% paraformaldehyde in 0.1 M sodium cacodylate buffer, pH 7.4. After fixation, the brain was removed and sectioned into 500–1000 μm slices. Under a dissection microscope, tissue punches were taken to capture cortical grey matter. Punches were placed in fixation solution overnight at 4°C. Samples were washed twice for 15 min in 0.1 M sodium cacodylate buffer, pH 7.4 and then immersed in 1% osmium diluted in 0.1 M sodium cacodylate buffer, pH 7.4 for 50 min at room temperature on a rotator in the dark. Samples were then washed four times in 0.2 M sodium cacodylate buffer, pH 7.4. Samples were dehydrated in 50%, 80%, and 95% acetone for 5 min each. Four washes in 100% acetone for 15 min were performed. Samples were equilibrated for embedding in a solution containing equal parts of 100% acetone and Epon® 812 with accelerator on a rotator overnight at room temperature. Samples were embedded in 100% Epon® 812 with the accelerator at 60–70°C overnight. Ultrathin sections were cut and imaged on a Tecnai T12 120 kV Transmission Electron Microscope (FEI).
For 3,3'-diaminobenzidine (DAB) immunoelectron microscopy, paraformaldehyde-fixed 40-μm thick brain slices were incubated in 0.1% glutaraldehyde/ 4% paraformaldehyde in PBS for 2 h at room temperature followed by wash with PBS. This was followed by incubation in 1% sodium borohydride for 15 min at room temperature. The tissue was prepared, stained, and developed using the Mouse On Mouse kit combined with a DAB stain by Vector Laboratories according to manufacturer’s instructions [primary antibody: mouse amyloid-β, clone W0-2 (Millipore; Cat. # MABN10)]. The tissue was then processed for electron microscopy as described above.
Immunohistochemistry
Tissue of hAPPJ20 and control mice was fixed in 4% paraformaldehyde in PBS. Thirty to fifty micrometre coronal slices were sectioned at the vibratome. Slices were incubated in primary antibody solution diluted in staining solution (10% normal goat serum and 0.5 % Triton™ X in PBS) overnight at 4°C. Primary antibodies used included rabbit aquaporin-4 (Sigma Aldrich; Cat. # A5971; 1:400), chicken GFAP (Abcam; Cat. # ab4674, 1:1000) or mouse GFAP (Millipore; Cat. # MAB360, 1:1000), rabbit S100 (Dako; Cat. # Z0311, 1:100), mouse amyloid-β, clone W0-2 (Millipore; Cat. # MABN10, 1:250) and rat CD31 (BD Biosciences; Cat. # 550274; 1:150). Slices were washed in PBS for at least 10 min twice and stained with secondary antibodies for 1 h at room temperature. Secondary antibodies used included goat anti-rat Alexa Fluor® 647, goat anti-rabbit Cy3, goat anti-rabbit Alexa Fluor® 488, and goat anti-mouse Alexa Fluor® 488. The nuclei stain DAPI (4',6-diamidino-2-phenylindole) was added to the secondary antibody solution. Slices were washed with PBS and mounted on glass slides with Aqua-Poly/Mount (Polysciences). Images were acquired using an Olympus FluoView FV1000 laser scanning microscope equipped with four diode lasers (405, 473, 559, 635 nm) using 20× air, 40× air, or 40× oil objectives (Olympus). Experiments were successfully repeated in at least three different animals per group; limitations in repeatability of immunohistochemistry or the described results were not encountered.
Quantification of GFAP and AQ4 (encoded by Aqp4) was performed as follows: three or four confocal images were taken per genotype and time point in the cortical grey matter of three different tissue slices using a 20× objective. Images were imported into ImageJ (NIH). Background was subtracted using a rolling ball radius of 50 pixels. Binary images were made and the area covered by AQ4 or GFAP signal was determined using the ‘create selection’ and ‘make measurement’ functions in ImageJ. Values for area measurements are plotted in per cent area. To determine the ratio of polarized (end-foot) to cytoplasmic AQ4 we followed the method described in (Kress et al., 2014). In short, plot profiles of regions of interest (5 μm × 50 μm) were placed such that the long side was oriented perpendicularly to the measured vessel. Signal intensities of the signal at the end-foot and of the surrounding cytoplasm were determined and a ratio between these values was calculated for every vessel.
Drugs and solutions
All chemicals were obtained from Sigma Aldrich unless otherwise specified. 9,11-dideoxy-9α,11α-methanoepoxy prostaglandin F2α (U-46619) was obtained from Cayman Chemical and diluted with dimethyl sulphoxide. (±)-1-Aminocyclopentane-trans-1,3-dicarboxylic acid (t-ACPD) was obtained from Tocris Bioscience.
Acute brain slice drug application experiments
Animals were sacrificed and brains were placed in ice-cold artificial CSF (cutting artificial CSF) bath solution (135 mM N-methyl-D-glucamine, 1.5 mM KCl, 3.5 mM MgSO4, 0.5 mM CaCl2, 1.5 mM KH2PO4, 23 mM choline bicarbonate, 25 mM D-glucose and 0.4 mM ascorbic acid, bubbled with 95% O2/5% CO2 to maintain pH at 7.4). Two hundred-micrometre coronal slices were sectioned and allowed to recover for 45 min to 1 h at 28°C in recording artificial CSF (125 mM NaCl, 3.0 mM KCl, 1.25 mM NaH2PO4, 25 mM NaHCO3, 25 mM D-glucose, 2.0 mM CaCl2, 2.0 mM MgSO4) bubbled with 95% O2/5% CO2 to maintain pH at 7.4. For t-ACPD experiments, vessels were preconstricted in 125 nM U-46619 for 30 min in recording artificial CSF bubbled with 20% O2/5% CO2 at 37°C. Slices remained in 20% O2/5% CO2 for the duration of the experiment. All other pharmacological experiments were performed without preconstriction in 95% O2/5% CO2 . Acute brain slices were transferred to a Leica DM LFSA upright DIC-IR fluorescence microscope using a Zeiss Hm digital camera at 1000× magnification (Leica Microscopy). Slices were continually perfused with recording artificial CSF heated to 32°C and bubbled with 20% O2/5% CO2. Time lapse images of vessels were acquired using AxioVision 4.7 software (Carl Zeiss Microscopy). Vessel diameter was measured as the cross-section of the vessel using FIJI (ImageJ) software.
Acute brain slice calcium uncaging experiments
After obtaining slices as described above, slices were allowed to recover for 1 h in artificial CSF bubbled with 95% O2/5% CO2 at room temperature to maintain pH at 7.4. Slices were loaded with 20 μM Alexa Fluor® 633 Hydrazide (Invitrogen), 10 μM Rhod-2 AM cell permeant Ca2+ indicator (Invitrogen), and 10 μM DMNPE-4 caged Ca2+ (Ellis-Davies and Barsotti, 2006) in artificial CSF containing 0.02% pluronic acid for 60 min at room temperature. Slices were then transferred to regular artificial CSF for 30 min to allow for stabilization before recording. Alexa Fluor® 633 Hydrazide and Rhod-2 AM fluorescence were detected by laser scanning confocal microscopy using an Olympus FV1000 and a 60× /1.1 NA water immersion objective (Olympus). Single plane confocal images of 800 × 800 pixels were obtained about every 3 s. Ca2+ uncaging was achieved using a 405 nm laser in region of interest tornado scanning mode at 40% power for 800 ms that was directed at astrocytic end-feet associated with arterioles identified by Alexa Fluor® 633 Hydrazide dye. The effect of laser scanning on caged Ca2+ and arteriole response during confocal image capture was assessed by recording vessel diameter and Ca2+ changes in the presence and absence of the higher powered uncaging pulse (Supplementary Fig. 1). Vessel diameter was measured as the cross-section of the vessel using FIJI (ImageJ) software and validated with a motion tracking system (After Effects, Adobe Systems Inc.) that automated vessel wall tracking and calculated the changes in lumen diameter (Supplementary Video 1).
In vivo multi-photon imaging through a cranial window
Before surgery, animals were anaesthetized with 2–5% isoflurane and given preoperative analgesics and antibiotics. After surgical plane anaesthesia was achieved, the hair and skin of the skull was removed. A metal bar was secured to the skull behind lambda by dental cement. Removal of the skull anterior to lambda and posterior to bregma was performed on one hemisphere and a round cover glass was affixed and sealed with dental cement. After a recovery period, animals were injected retro-orbitally with 100 µl of 5 mg/ml 70 000 MW tetramethylrhodamine dextran (Invitrogen) with a 28-gauge, 0.5-inch long needle (BD Biosciences) before commencing visualization. During multi-photon imaging, animals were kept under light anaesthesia [∼100 beats per minute (bpm)] and their vitals were constantly monitored (MouseOx, Starr Life Sciences Corp.). To visualize amyloid, methoxy-XO4 (2 mg/kg) was administered to hAPPJ20 and non-transgenic animals 12 h before the imaging experiment via intraperitoneal injection. Animals were placed on a custom built apparatus with a heating pad, and the metal bar was secured to immobilize the animal’s skull. Arterioles were identified by retro-orbitally administering 100 µl of 200 µM Alexa Fluor® 633 Hydrazide (Invitrogen). Optical sections were acquired using a four-channel multi-photon laser scanning fluorescence microscope (Olympus FV1000MPE) equipped with a XLPLN25X/1.05 NA water-immersion objective (Olympus). Z projections were created using FIJI (ImageJ) software and 3D reconstructions were created using Imaris 7.5.2 software (Bitplane Scientific Software). When necessary, channel unmixing was done using FIJI (ImageJ) software. Vessel diameter was measured as the cross-section of the vessel lumen at the area of maximum response. Two micrometre cross-section slices at the area of maximum response were converted to binary images and then analysed and measured using particle analysis and Feret’s diameter (FIJI).
In vivo vascular smooth muscle cell activation
Arterioles, identified by retro-orbitally administered Alexa Fluor® 633 Hydrazide (Invitrogen), with lumen diameters of 15–35 µm were selected only if they ran parallel to the cortical surface. This allowed for comprehensive imaging of vessel dynamics across larger parts of the vessel. Imaging took place at subsurface depths of up to 200 µM. The VSMC-containing media layer of the arterial wall was targeted for laser irradiation by measuring 4 µm from the luminal surface (labelled by retro-orbital injection of 70 000 MW tetramethylrhodamine dextran). VSMC stimulation was achieved using a 5 µm2 region of interest in tornado mode for 100 ms at 7–10× imaging power levels. The optical path and laser source for VSMC activation were the same as those used in the two-photon fluorescence imaging (modified from a technique previously described; Choi et al., 2010).
Statistical analysis
Statistical tests were performed using GraphPad Instat or GraphPad Prism 6.0. All measurements are reported with standard error of mean. Statistical data are reported in the figure legends or results. The Kolmogorov–Smirnov normality test was performed for each data group. If normality was not achieved, the appropriate non-parametric test was performed. The specific test is stated in the results or figure legends. Outliers were excluded from the analysis where noted. The number of replicates is reported in the results or figure legends.
Results
Patterns of vascular amyloid in hAPPJ20 mice
In patients with Alzheimer’s disease, amyloid-β accumulates around the cerebrovasculature (Mandybur, 1975; Vinters, 1987). This vascular amyloid deposition is replicated in mouse models of the disease (Yang et al., 2011; Park et al., 2014). To visualize vascular amyloid in the brains of aged hAPPJ20 mice, we injected methoxy-XO4 (Klunk et al., 2002) intraperitoneally before in vivo imaging by multi-photon microscopy. Multi-photon optical slice data were captured through a chronic cranial window in live hAPPJ20 mice using TRITC-Dextran to label the lumen of the cerebrovasculature. Similarly to previous studies in other models, we found a close relationship between amyloid-β and the cerebral vasculature in hAPPJ20 mice (Fig. 1 and Supplementary Video 2).
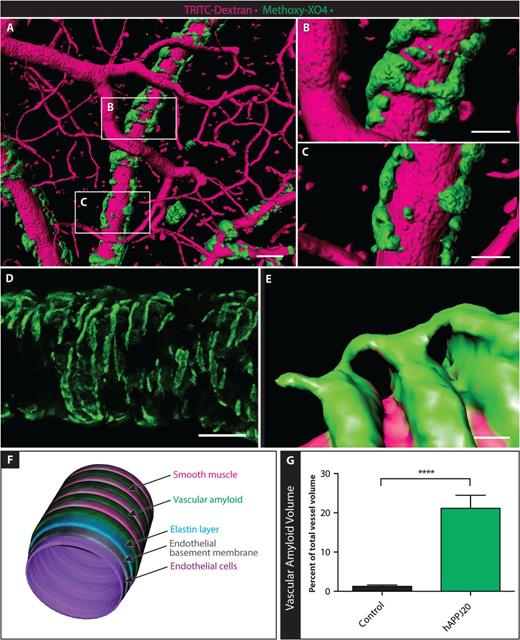
Vascular amyloid in hAPPJ20 mice. Vascular amyloid was imaged in the cortex of hAPPJ20 mice using TRITC-Dextran (magenta) to label vessels and methoxy-XO4 (green) to label vascular amyloid. (A) High-resolution 3D rendering created from in vivo multi-photon optical sections of a 15-month-old hAPPJ20 mouse. Scale bar = 40 µm. (B and C) Magnification of areas indicated in A showing vascular amyloid either partially covering vessels or wrapping around the entire vessel circumference. Scale bar = 20 µm. (D) High-resolution confocal z-projection showing vascular amyloid in ring-like structures around a vessel in a 27-month-old hAPPJ20 mouse. Scale bar = 40 µm. (E) High-resolution 3D reconstruction of a 15-month-old hAPPJ20 mouse showing vascular amyloid rings, likely between VSMCs, very close to the vascular lumen suggesting close contact of the amyloid with endothelial cells. Some vascular amyloid rings were connected by bridges on top of VSMCs. Scale bar = 2 µm. (F) Cartoon depicting an arteriole with vascular amyloid. The vascular wall is composed of endothelial cells, the endothelial basement membrane, and an elastin layer (which can be visualized by the dye Alexa Fluor 633 Hydrazide). VSMCs normally form ring-like contractile elements that wrap around the vessel perpendicular to its axis. Vascular amyloid can fill the gaps between VSMCs, sometimes building up and completely covering VSMCs. (G) Quantification of vascular amyloid in 15–19-month-old animals, expressed as per cent of total vessel volume. The total volume of vascular amyloid was measured by quantifying methoxy-XO4 signal in a 3D volumetric reconstruction, and the total vascular volume was measured by quantifying TRITC-dextran signal in the same 3D reconstruction (n = 9–10 images from three mice per genotype; unpaired two-sided t-test, ****P < 0.0001.).
To better understand the physical relationship between vascular amyloid and its associated vessels we created high-resolution 3D reconstructions and volumetric optical section projections from in vivo and ex vivo multi-photon and confocal data. Three dimensional reconstructions illustrate how the bands of amyloid can span the entire circumference of vessels in some areas (Fig. 1B) but not others (Fig. 1C). In other Alzheimer’s disease models, vascular amyloid forms a banding pattern between established VSMCs (Domnitz et al., 2005), and we observed a similar pattern in hAPPJ20 mice (Fig. 1D–F). As the disease progresses, the gaps shrink and vascular amyloid starts to form contiguous structures (Domnitz et al., 2005). In high-resolution confocal z-projections, vascular amyloid had a banding pattern resembling an exoskeleton around blood vessels (Fig. 1D). Three dimensional reconstructions illustrated this exoskeleton framework at even higher detail, revealing the formation of bridges between the amyloid bands (Fig. 1E). Quantitative assessment of multi-photon 3D reconstruction data showed that vascular amyloid volume was ∼20% of total vessel volume (Fig. 1G and Supplementary Fig. 2). Taken together, vascular amyloid appears to form a vascular exoskeleton covering a significant surface area of cerebral blood vessels in aged hAPPJ20 mice.
Vascular amyloid displaces astrocyte end-feet in hAPPJ20 mice
As astrocyte end-feet cover over 99% of the cerebrovascular surface (Mathiisen et al., 2010) (Fig. 2A), we next asked if vascular amyloid deposits interfered with astrocyte end-foot placement. To answer this question, we first imaged acute brain slices from hAPPJ20 mice using confocal imaging. To label vascular amyloid, mice were injected with methoxy-XO4 12 h before the experiment. Bath application of the Alexa Fluor® 633 Hydrazide dye was used to stain the elastin layer of arterial vessels ≥10 μm. As there is extensive literature reporting preferential loading of astrocytes by fluorescent acetoxymethyl ester indicators such as Rhod-2 AM (Ellis et al., 1979; Harder et al., 1995; Niwa et al., 2000; Hirase et al., 2004; Tian et al., 2005; Takano et al., 2006), we used this label to visualize astrocyte end-feet. We found that amyloid deposits mostly displaced astrocytes and the end-feet no longer abutted the arteriole elastin layer in areas where vascular amyloid was present (Fig. 2B). However, there were a few locations where the end-foot was still in its normal vessel juxtaposition (Fig. 2C) as seen in non-transgenic animals (Fig. 2D). We cannot exclude that Rhod-2 AM loads into endothelial cells or pericytes as previously reported for Fluo-4, albeit this has been reported to occur only with poor efficiency and attenuated strength of the fluorescent label (Hirase et al., 2004). Furthermore, endothelial cells should localize inside of the Alexa Fluor® 633 Hydrazide label, which stains the elastin layer of arterial vessels (Fig. 1F), but this was not where we observed Rhod-2 AM staining. The contractile cells of vessels with this diameter are vascular smooth muscle cells, not pericytes.
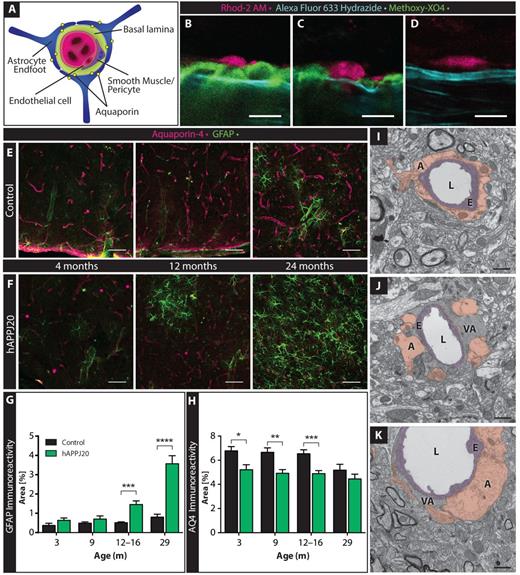
Vascular amyloid displaces astrocyte end-feet around cerebral vessels. (A) Cartoon depicting the gliovascular unit with astrocyte end-feet expressing the water channel AQ4 and vascular smooth muscle cells or pericytes surrounding the endothelial wall. (B–D) Relationship between vessel wall (cyan, Alexa Fluor® 633 Hydrazide), vascular amyloid (green, methoxy-XO4) and Rhod-2 AM–loaded astrocytes (magenta) in acute cortical slices from 27-month-old hAPPJ20 (B and C) or non-transgenic (D) mice. Vascular amyloid displaced the astrocyte end-feet from some vessels (B) and localized around astrocyte end-feet without displacing their contact with other vessels (C). In controls, astrocytes were in direct contact with the vessel (D). Scale bar = 10 µm. (E and F) Immunohistochemistry at 4, 12 and 24 months of age showed an age-dependent increase of GFAP (green) in hAPPJ20 mice, whereas AQ4 (magenta) was reduced even at 4 months of age when compared to controls. GFAP was increased in aged control mice but to a much lesser degree than in hAPPJ20 mice. Scale bar = 50 μm. (G) GFAP immunofluorescence in confocal images was quantified by thresholding using FIJI as described in the ‘Materials and methods’ section and expressed as per cent area occupied by GFAP, demonstrating age-dependent astrogliosis in the cortex of hAPPJ20 mice. Two-way ANOVA, P < 0.0001 for main effect of genotype (control versus hAPPJ20) and P < 0.0001 for main effect of age; ***P < 0.001 for control versus hAPP at 12–16 months in post hoc tests and *** P < 0.0001 at 29 months in post hoc tests; each bar represents n = 9–15 regions of interest from 3–5 mice. (H) AQ4 immunofluorescence in confocal images was quantified by thresholding using FIJI as described in the ‘Materials and methods’ section and expressed as per cent area occupied by AQ4, demonstrating loss of AQ4 in the cortex of hAPPJ20 mice. Two-way ANOVA, P < 0.0001 for main effect of genotype (control versus hAPPJ20) and P = 0.018 for main effect of age; *P < 0.05, **P < 0.01, and ***P < 0.001 in post hoc tests for comparisons between the indicated bars; each bar represents n = 9–15 regions of interest from 3–5 mice. (I) Electron microscopy in 27–29-month-old animals showing that perivascular astrocytes (A, brown) surround vessel walls built by endothelial cells (E, purple) in control mice; L = vessel lumen. In hAPPJ20 mice, electron-dense vascular amyloid (VA) can displace astrocyte end-feet, either completely (J) or partially (K). Scale bar = 1 μm.
As Rhod-2 AM does not label all astrocytes, we complemented the above studies by labelling astrocyte end-feet with antibodies to AQ4, a water channel (encoded by Aqp4) exclusively expressed in astrocytes and highly enriched in their end-feet (Bragg et al., 2006) (Fig. 2A and Supplementary Fig. 3B). We observed a decrease of AQ4 expression in the cortical grey matter as early as 3 months in hAPPJ20 mice, even before the appearance of amyloid-β plaques, vascular amyloid (Esposito et al., 2006), or pronounced astrogliosis (Fig. 2E and F). Similar to previous reports (Kress et al., 2014), AQ4 expression tended to decrease in aged control animals (Fig. 2E). As the brain tissue of aged animals is characterized by severely increased autofluorescence, in part due to lipid granule formation (Eichhoff et al., 2008) (also see Supplementary Fig. 4), the values shown are likely an overestimation of true AQ4 levels and differences between controls and hAPPJ20 mice were difficult to establish (Fig. 2H). To avoid autofluorescence and assess if AQ4 expression might also be mislocalized, as previously described in a different Alzheimer’s disease mouse model (Yang et al., 2011), we determined the ratio between end-foot labelling and cytoplasmic AQ4 expression. Brains from hAPPJ20 mice had a significantly decreased ratio of end-foot to cytoplasmic AQ4 staining (Supplementary Fig. 3A, Supplementary Data and Supplementary Data), indicating that AQ4 was indeed mislocalized in hAPPJ20 mice. This was corroborated by a significantincrease in intensity of cytoplasmic AQ4 immunolabeling in hAPPJ20 brains (Supplementary Fig. 3C, Supplementary Data and Supplementary Data).
Loss of AQ4 has been reported in other CNS pathologies presenting with reactive astrocytes (Wolburg-Buchholz et al., 2009; Noell et al., 2012; Iliff et al., 2014). Thus, we used the astrocyte-specific marker GFAP to compare the extent of astrogliosis at different ages in hAPPJ20 mice. Interestingly, at 3 and 9 months of age, when the area covered by AQ4 was already reduced, GFAP expression in hAPPJ20 mice was comparable to age-matched littermate controls. At 12–16 months of age, we observed an increase in reactive astrocytes around amyloid plaques as previously reported in a different Alzheimer’s disease mouse model (Sirko et al., 2013). At 24 and 29 months of age, astrogliosis was widespread throughout the cortical grey matter in hAPPJ20 mice (Fig. 2E–G). To a lesser degree, we also found GFAP-positive hypertrophied astrocytes in 24-month-old control animals, consistent with literature on age-related changes of the brain (Rodriguez-Arellano et al., 2015). However, the area covered by GFAP-positive astrocytes was not significantly increased in aged control animals (Fig. 2G). Overall astrocyte numbers were assessed by immunohistochemistry for S100. Astrocyte density was comparable in 29-month-old control and hAPPJ20 mice (Supplementary Fig. 5) pointing toward chronic astrogliosis in the absence of an increase in astrocyte numbers in hAPPJ20 mice. As AQ4 expression was already reduced prior to visible vascular amyloid deposits, this is unlikely to reflect a physical displacement of the astrocyte end-feet but instead a decrease in overall AQ4 expression and loss of polarized expression with preservation of the end-feet along the vessel.
Because AQ4 immunohistochemistry was not a good indicator for end-foot displacement, we next used confocal imaging and high-resolution electron microscopy (Fig. 2I–K and Supplementary Fig. 4) to assess the structural relationship of astrocyte end-feet and blood vessels in control and hAPPJ20 mice. We identified astrocyte end-feet, vascular amyloid, endothelial cells, and the lumen of vessels by differences in electron density and morphology, and confirmed this by immunolabelling of vascular amyloid in electron microscopy (Supplementary Fig. 6) and immunohistochemistry (Supplementary Fig. 3C and Supplementary Data). Astrocyte end-feet are characterized by a less electron-dense (lighter) cytoplasm with substructures of filamentous networks and bundles of glial filaments in addition to glycogen granules (Nakazawa and Ishikawa, 1998), whereas amyloid deposits presented as relatively darker structures close to the vessel wall. In control mice, we did not observe these darker structures. Instead, endothelial cells were completely covered by astrocytic end-feet (Fig. 2I and Supplementary Fig. 4 and Supplementary Data). In hAPPJ20 mice, electron-dense amyloid-β deposits were found between the astrocytic end-feet and the vessel walls (Fig. 2J), although some vessels maintained astrocyte-vessel contact (Fig. 2K). Labelling vascular amyloid with an antibody against amyloid-β and astrocyte end-feet with an antibody to GFAP corroborated this finding (Supplementary Fig. 7A). While some larger vessels did show coverage of GFAP+ end-feet in controls and hAPPJ20 mice (Supplementary Fig. 7A and Supplementary Data), most end-feet along the cortical cerebral vasculature expressed GFAP levels below the detection threshold (Supplementary Fig. 7C and Supplementary Data) excluding GFAP as a suitable marker for the presence or absence of an end-foot on these vessels. Together these data suggest that astrocyte polarity is altered in hAPPJ20 mice and that vascular amyloid can disrupt the intimate end-foot–vessel relationship.
The vasoactive signalling axis in hAPPJ20 mice
The brain regulates blood flow in response to neuronal activity and energy demands, a process called functional hyperaemia. This regulation is partially governed by astrocytes, which act as liaisons between neurons and the vasculature (Attwell et al., 2010). Specifically, activation of astrocytic metabotropic glutamate receptors (mGluRs) leads to increased intracellular calcium ([Ca2+]i) and a phospholipase A2-mediated generation of vasoactive molecules that dictate arteriole smooth muscle cell constriction and dilation, dependent on the brain’s metabolism (Zonta et al., 2003; Gordon et al., 2007; Girouard et al., 2010). While one study raised doubts about the presence of mGluR5 (encoded by Grm5) in astrocytes in adult mice (Sun et al., 2013), a more recent publication confirmed the lack of mGluR5 pharmacologically but found astrocytic Ca2+ signals in response to group I mGluR agonists using a more sensitive Ca2+ indicator (Tang et al., 2015). This suggests that astrocytes respond to mGluR agonists such as trans-ACPD (t-ACPD) with Ca2+ increases through mGluR1 (Grm1) activation. We used a well-established slice assay in combination with pharmacology (Gordon et al., 2007; Girouard et al., 2010; Watkins et al., 2014) to assess if this signalling axis remained intact in hAPPJ20 mice.
Astrocytes respond to the vasoactive molecules t-ACPD and norepinephrine with increased [Ca2+]i, which, depending on the oxygen tension in the tissue, cause either vasodilatation or vasoconstriction (Zonta et al., 2003; Mulligan and MacVicar, 2004; Gordon et al., 2007; Tang et al., 2015). Using video-microscopy analysis, we measured changes in arteriole diameter in response to bath application of t-ACPD or norepinephrine in acute slices from control and hAPPJ20 mice (Fig. 3A and B). As expected, most arterioles in control slices dilated in response to t-ACPD and a paired analysis indicated a highly significant effect of t-ACPD (Fig. 3A, C and D). However, in hAPPJ20 vessels, there was no significant effect of t-ACPD in a paired analysis (Fig. 3D), suggesting impaired dilation of vessels in hAPPJ20 mice in response to t-ACPD. A similar effect was observed with norepinephrine, which induced significant vasoconstriction in control vessels (Fig. 3B, F and G) but not in hAPPJ20 vessels (Fig. 3G). However, in direct comparisons of the response magnitude (Fig. 3E and H), we did not observe significant differences, thus these data do not unequivocally support an abnormality of vascular responsiveness in hAPPJ20 mice. Statistical power in these analyses was reduced by high variability in these responses, especially in the hAPPJ20 group, likely because in these experiments we had no means of identifying which vessels were affected by vascular amyloid. Suspecting that the high variability in hAPPJ20 mice was due to inclusion of both vessels with and without vascular amyloid, in subsequent experiments we included vascular amyloid labelling to allow differentiation between affected and unaffected vessels.
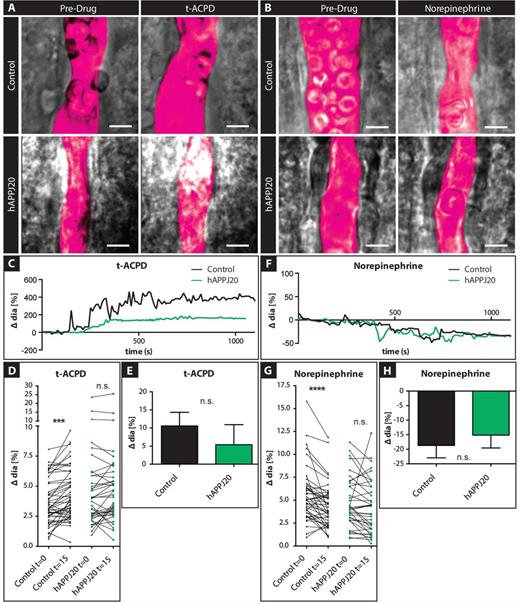
Pharmacological stimulation of vasoactive signalling in hAPPJ20 mice. (A) DIC images of vessels in acute slices of control and hAPPJ20 mice before and after application of 100 µM trans-ACPD (t-ACPD) or (B) 10 µM norepinephrine (NE) in 14-month-old animals. The vessel lumen was outlined digitally (magenta pseudocolour). Scale bar = 5 μm. (C) Example traces of control (black) or hAPPJ20 (green) vessels during bath application of t-ACPD show dilation of the vessels in response to t-ACPD. (D) To better illustrate the response of individual vessels, vessel diameters were plotted before and 15 min after t-ACPD bath-application. Control, n = 49 vessels from seven animals; hAPPJ20, n = 38 vessels from 6 animals; two-way repeated measures ANOVA: genotype × drug interaction, P = 0.10; drug effect, P < 0.0001; on post hoc Bonferroni comparisons: drug effect in controls: ***P < 0.001, drug effect in hAPPJ20 not significant (n.s.). (E) Average change in vessel response after t-ACPD bath application in control and hAPPJ20 mice. Control, 10.56 ± 3.76% change in vessel diameter, n = 45 vessels from seven animals; hAPPJ20, 5.39 ± 5.51% change in vessel diameter, n = 36 vessels from six animals, Mann-Whitney, two-sided, P = 0.3031. (F) Example traces of control (black) or hAPPJ20 (green) vessels show constriction during bath application of norepinephrine. (G) To better illustrate the response of individual vessels, vessel diameters were plotted before and 15 min after norepinephrine bath application. Control, n = 45 vessels from seven animals; hAPPJ20, n = 37 vessels from six animals; two-way repeated measures ANOVA: genotype × drug interaction, P = 0.07; drug effect, P < 0.0001; on post hoc Bonferroni comparisons: drug effect in controls: ****P < 0.0001, drug effect in hAPPJ20 not significant (n.s.). (H) Average change in vessel response after norepinephrine bath application in control and hAPPJ20 mice. Control, − 18.65 ± 4.29% change in vessel diameter, n = 44 vessels from seven animals; hAPPJ20, −15.13 ± 4.43% change in vessel diameter, n = 36 vessels from six animals, two-sided t-test, P = 0.5715.
Gliovascular coupling is impaired on vessels covered with vascular amyloid
To visualize vascular amyloid, we injected methoxy-XO4 12 h prior to sacrificing control or hAPPJ20 animals and used confocal imaging to identify vessels with or without vascular amyloid. To determine changes in vessel diameter, we used the arteriole-specific dye Alexa Fluor® 633 Hydrazide. Furthermore, to avoid possible off-target effects of the t-ACPD and norepinephrine that raise [Ca2+]i in astrocytes, we specifically elevated [Ca2+]i in individual astrocytes using the caged Ca2+ compound, DMNPE-4 (Ellis-Davies and Barsotti, 2006), in combination with the Ca2+-sensor Rhod-2 AM.
Focal laser uncaging of the caged Ca2+ DMNPE-4 allowed us to elevate [Ca2+]i in single astrocytes on or close to arterioles (Fig. 4). Cortical grey matter arterioles in acute slices from control mice, and arterioles with and without amyloid in hAPPJ20 mice, were imaged during selective astrocyte stimulation by focal laser Ca2+ uncaging. In acute slices from control mice, Ca2+ uncaging in astrocytes led to an immediate rise in [Ca2+]i followed by biphasic vessel constriction with an immediate constriction followed by a slower sustained vessel response (Fig. 4A and Supplementary Video 3). In slices from hAPPJ20 mice, uncaging in astrocytes near arterioles resulted in similar increases in [Ca2+]i (Fig. 4B and C). To determine if the impaired vasoconstriction in hAPPJ20 mice was due to the amyloid burden on the vasculature, we compared the vasoconstriction of arterioles with and without vascular amyloid (Fig. 4B–E). In hAPPJ20 mice, the response of arterioles without amyloid was comparable to arterioles from control mice (Fig. 4B, D, E and Supplementary Video 4). In contrast, the presence of vascular amyloid significantly decreased vasoconstriction in both the initial and the maximal response (Fig. 4C–E and Supplementary Video 5). To ensure that this effect was not due to variability in Ca2+ release we quantified the mean Ca2+ ΔF/F and found no significant difference between groups (Fig. 4F). These data suggest that arterioles burdened by vascular amyloid have a diminished range of contractility.
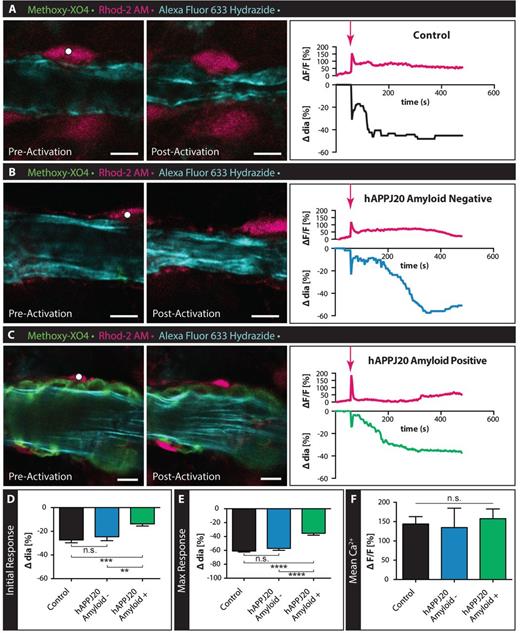
Response of vessels covered by vascular amyloid are impaired in hAPPJ20 mice. (A–C) Confocal images of arterioles in acute slices labelled with Alexa Fluor® 633 Hydrazide (cyan) and methoxy-XO4 to label vascular amyloid (green) before and after Calcium (Ca2+) uncaging in 27–29-month-old animals. Astrocytes were loaded with the Ca2+ indicator Rhod-2 AM (magenta) and caged Ca2+ DMNPE-4. Ca2+ uncaging in an astrocyte end-foot or cell body (white dot indicates area of uncaging) close to an arteriole leads to constriction of this vessel in response to the large increase in intracellular Ca2+. Traces depict changes in intracellular Ca2+ and changes in vessel diameters over time. Magenta arrows indicate when uncaging occurred. While vessels in control slices (A) and slices from hAPPJ20 mice without vascular amyloid (B) respond with strong initial and maximal constrictions, vessels from hAPPJ20 slices that are covered by vascular amyloid show a reduced response (C). Scale bar = 10 µm. (D and E) Quantification of initial and maximal vessel constrictions show significantly reduced responses in hAPPJ20 only if vascular amyloid was covering the vascular wall. (F) Mean Ca2+ ΔF/F between groups shows no significant difference. Statistical data in D: Initial response, control, n = 25 vessels from four animals; hAPPJ20 Amyloid−, n = 17 vessels from three animals, hAPPJ20 Amyloid+, n = 24 vessels from four animals, One-way ANOVA with Holm-Sidak’s multiple comparisons test, P = 0.0002. (E) Maximal response, control, n = 26 vessels from four animals; hAPPJ20 Amyloid–, n = 18 vessels from three animals, hAPPJ20 Amyloid+, n = 26 vessels from four animals, One-way ANOVA with Holm-Sidak’s multiple comparisons test, P < 0.0001. Error bars on bar graphs reflect SEM. Statistical significance: *P-value < 0.05, **P < 0.01, ***P < 0.001, ****P < 0.0001.
Vascular smooth muscle cell/pericyte function is impaired in hAPPJ20 mice
Astrocytes release vasoactive substances that stimulate contractile VSMCs or pericytes on arterioles or capillaries, which then constrict or dilate (Attwell et al., 2010). Hence, the reduction in vessel contraction following astrocyte stimulation could also result from impaired VSMC/pericyte function. To assess VSMC/pericyte function directly, we used drugs that bypassed the astrocyte component of the GVU and instead stimulated VSMCs/pericytes directly (Fig. 5). For this we chose endothelin-1 (ET-1, encoded by Edn1), a potent vasoconstrictor that binds to endothelin receptors found on VSMCs (Edwards and Trizna, 1990), and U46619, a thromboxane A2 agonist vasoconstrictor that binds to TXA2 receptors on VSMCs (Dorn and Becker, 1993; Blanco et al., 2008). Using video-microscopy, we measured changes in arteriole diameter in response to bath application of ET-1 (Fig. 5A) and U46619 (Fig. 5B). Arterioles from hAPPJ20 mice had significantly less vasoconstriction in response to ET-1 (Fig. 5 A, C and E) and U46619 (Fig. 5B, D and E) compared to control mice. Taken together, these data suggest that the ability of VSMC/pericytes to properly function in regulating vessel diameter is impaired in hAPPJ20 mice.
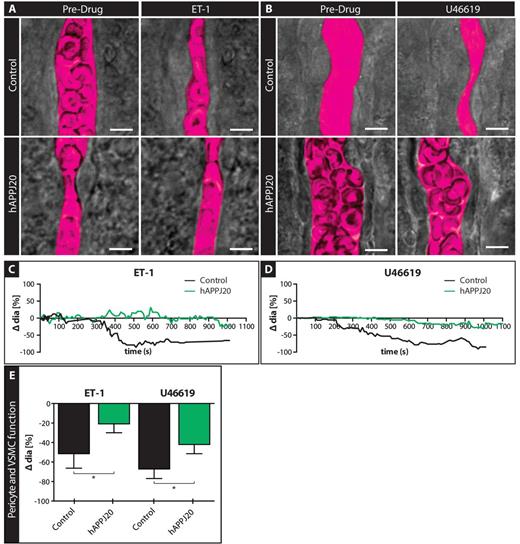
Vascular smooth muscle cell/pericyte function is impaired in acute slices of hAPPJ20 mice. VSMC/pericyte function was assessed by pharmacological stimulation of these cells in acute slices of 15-month-old animals. (A and B) DIC images of vessels before and after bath application of Endothelin-1 (A) and U46619 (B) to acute slices of control and hAPPJ20 mice. The vessel lumen was outlined digitally (magenta pseudocolour). Scale bar = 5 µm. (C and D) Example traces of control (black) or hAPPJ20 (green) vessels during bath application of ET-1 or U46619 show a stronger constriction of control than hAPPJ20 vessels. (E) Quantification of changes in vessel diameter after bath application of vasoconstrictors. hAPPJ20 vessels showed reduced vessel constriction compared to control vessels in response to ET-1 and U46619. ET-1: control, n = 9 vessels from four animals versus hAPPJ20, n = 18 vessels from five animals, unpaired t-test, one-sided, *P = 0.0386. U46619: control, n = 15 vessels from three animals versus hAPPJ20, n = 22 vessels from five animals, one-way Mann-Whitney, one-sided *P = 0.0361.
To assess if a greater initial vessel tone in hAPPJ20 mice could account for decreases in vessel responses, we compared baseline diameters of both capillaries and arterioles. Neither baseline capillary, nor arteriole diameters were significantly changed in hAPPJ20 mice (Supplementary Fig. 8). These data indicate that the reduced constriction of vessels seen in hAPPJ20 mice cannot be due to a difference in baseline diameter.
Vascular amyloid dampens the vessel response in vivo
An important next step was to examine potential changes in VSMC function in vivo, where blood flow is present and vessels are pressurized. For these experiments we adopted minimally invasive in vivo multi-photon imaging. We visualized the vasculature and amyloid through a chronic cranial window in live mice. The vascular lumen was labelled with TRITC-Dextran, arterioles with Alexa Fluor® 633 Hydrazide, and vascular amyloid by intraperitoneal injection of methoxy-XO4 12 h before the imaging session. We took advantage of direct focal optical stimulation of VSMC (Choi et al., 2010) to elicit a vascular response in vivo. With this technique, we were able to consistently elicit and visualize vasoconstriction by laser-stimulation of single VSMCs. VSMCs were identified by selecting arterioles positive for Alexa Fluor® 633 Hydrazide and placing the stimulation focal point at 4 µm distance from the border of the vessel lumen as previously described (Choi et al., 2010). We compared the vasoconstriction of arterioles with and without vascular amyloid in hAPPJ20 mice. Arterioles without vascular amyloid constricted after activation of VSMCs (Fig. 6A, E and Supplementary Video 6), while constriction of arterioles with vascular amyloid was reduced by more than half (Fig. 6B, E and Supplementary Video 7). In vivo, we observed a rapid response immediately after stimulation of the VSMC. The observed change in vessel diameter (Fig. 6E) was comparable to the maximum response observed after pharmacological stimulation of VSMCs in brain slices (Fig. 5E).
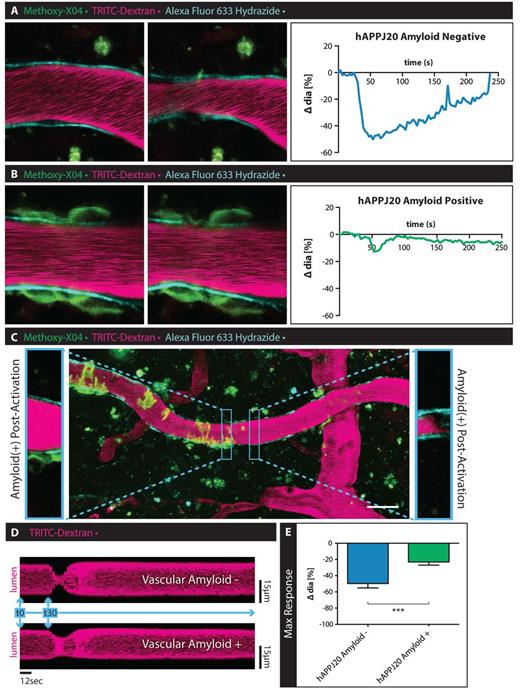
Vascular smooth muscle cell function is impaired in hAPPJ20 mice in vivo. To assess VSMC function in vivo, hAPPJ20 mice were injected with methoxy-XO4 (green) to label vascular amyloid, TRITC-Dextran (magenta) to outline the vascular lumen and Alexa Fluor® 633 Hydrazide (cyan) to identify arterioles and imaged through a cranial window using multi-photon microscopy at 30 months of age. Vessels with and without vascular amyloid were chosen for time-lapse imaging before and after laser-stimulation of VSMCs (white dot indicates area of stimulation). (A) Laser-stimulation of VSMCs associated with vessels without vascular amyloid consistently induced vasoconstrictions. (B) This response was impaired in vessels covered by vascular amyloid. Scale bar = 10 µm. (C) Vessels sometimes had certain areas covered by vascular amyloid while other areas were devoid of amyloid. Laser-stimulation of these same vessels showed a reduction in response only in the areas affected by vascular amyloid. Insets show two neighbouring areas of the same vessel after laser-stimulation. While the area free of vascular amyloid constricts normally, the neighbouring part of the vessel that is surrounded by vascular amyloid responds to a lesser degree. Scale bar = 30 µm. (D) Image analysis over time (representative of a line scan) shows the diminished response of the vessel area covered by amyloid (lower panel) compared to the unaffected vessel region (upper panel). Measured sections were 1.88-µm wide taken at a frame interval of 3 s. (E) Quantitation of change in vessel diameter after laser-stimulation of VSMCs in vivo. hAPPJ20 Amyloid−, n = 11 vessels from three animal versus hAPPJ20 Amyloid+, n = 11 vessels from three animals, unpaired t-test, one-sided, ***P = 0.0004. Sidak’s multiple comparisons test, P = 0.4541).
To determine if the impaired vasoconstriction was restricted to vessel areas with vascular amyloid only, we compared responses of areas with and without vascular amyloid on the same arteriole (Fig. 6C). Areas with vascular amyloid constricted to a lesser extent than areas just downstream of the amyloid on the same vessel (Fig. 6C and D). Laser-stimulation of a single VSMC caused subsequent vasoconstriction in multiple areas along arterioles without vascular amyloid (Supplementary Video 8) likely due to the activation of neighbouring VSMCs. Interestingly, when this chain reaction arrived at areas with vascular amyloid, there was less vasoconstriction than in adjacent amyloid-free areas (Supplementary Video 8). Like our ex vivo data, these in vivo studies show that arterioles have a reduced range of constriction specifically affecting areas covered by vascular amyloid.
Discussion
The importance of astrocytes in regulating local blood flow to match neuronal activity is now well recognized, and the functioning of the GVU and the associated signalling cascades are well-documented (Gordon et al., 2007; Attwell et al., 2010). However, surprisingly little is known about the GVU in disease. This is particularly surprising since most neurological diseases present with reactive astrogliosis, which might profoundly alter the relationship between astrocytic end-feet and blood vessels. Here, we used a genetic mouse model of Alzheimer’s disease that, as previously described (Yang et al., 2011), develops age-dependent accumulation of vascular amyloid. Consistent with previous reports (Sirko et al., 2013), we saw the progressive development of astrogliosis characterized by increased GFAP expression and changes in cell polarity defined by redistribution of AQ4, which is enriched in astrocytic end-feet. Using multi-photon in vivo imaging with the amyloid binding Congo Red—derivative methoxy-XO4, we showed a direct association of amyloid with the endothelial vessel wall, and confirmed by electron microscopy that amyloid is deposited between the astrocytic end-feet and the blood vessel, essentially separating the end-foot from the vessel wall.
A recent study showed a comparable physical separation of astrocytic end-feet from the vasculature when glioma cells invade along blood vessels (Watkins et al., 2014). In glioma, vasoactive substances released by astrocytes were unable to reach the arterial smooth muscle. We hence wondered if vascular amyloidosis might similarly disrupt the GVU. Indeed, we found that vascular amyloid displaced the end-foot component of the GVU similar to glioma cells and that vessels associated with vascular amyloid had a significantly diminished ability to constrict after astrocyte stimulation by uncaging Ca2+ in the astrocyte end-feet.
When glioma cells physically disrupted the astrocyte association with the vessels, direct stimulation of VSMCs using endothelin-1 or U46619 showed no impairment (Watkins et al., 2014). By contrast, these stimuli yielded significantly reduced constrictions in hAPPJ20 vessels ex vivo and in vivo. These data could be interpreted by amyloid altering the VSMCs, or alternatively that the amyloid deposits act as a rigid physical exoskeleton that prevents the vessel from changing its diameter. We favour the latter interpretation based on experiments in which we selectively stimulated VSMCs along the same arteriole on patches with and without amyloid. Segments devoid of amyloid showed normal responses, yet a few hundred micrometres along the same vessel in an area with pronounced amyloidosis, constriction was significantly reduced. Previous studies have demonstrated that neuronal activity results in abnormal changes of vessel diameters in mouse models of Alzheimer’s disease (Takano et al., 2007; Rancillac et al., 2012; Park et al., 2014), and others showed that amyloid deposits alter vessel tortuosity, blood flow and blood transit times (Dorr et al., 2012). In later stages of cerebral amyloid angiopathy cerebral perfusion may be altered due to VSMC death (Mandybur, 1975; Vinters, 1987; Weller et al., 2009a, b). These studies largely implied that neurovascular signalling or VSMC function was impaired, while our studies suggest that, at least initially, VSMCs remain functional but that the amyloid impairs their ability to constrict to the full degree possible.
This is an important point when considering amyloid clearance strategies or immunotherapy (Lannfelt et al., 2014). If amyloid deposits are principally responsible for the impairment of the vasculature, an important question pertains to the reversibility of the amyloid imposed impairment. Can dissolution of vascular amyloid restore normal vessel function? Our study suggests that there is a time window for therapy during which amyloid clearance would allow the vessel to regain its full dynamic range. At later stages, when the ring-like amyloid deposits start to close around VSMCs likely damaging or even killing these cells in the process, removal of these deposits might cause more harm than benefit, based on reports of cerebral microbleeds after amyloid-β immunization (Joseph-Mathurin et al., 2013).
The finding that vascular amyloid may act as cast that reduces the dynamic range of vessels in response to astrocyte or VSMC stimulation may be relevant before Alzheimer’s disease is fully manifest or even in patients that never develop Alzheimer’s disease. Amyloid-β deposition in the brain increases with age even in non-demented individuals and a recent study showed that progressively increased amyloid-β deposition over a time course of only 2 years correlates with increased arterial stiffness in the study participants (Hughes et al., 2014). Our study identifies another mechanism by which amyloid-β deposition increases the stiffness of smaller cerebral vessels.
Our findings by no means exclude the possibility that astrocyte-mediated regulation of the vasculature is also abnormal in Alzheimer’s disease. For example, upstream communication between neurons and astrocytes may be impaired or astrocyte intracellular signalling might be faulty. In fact, two studies have reported abnormal Ca2+ in astrocytes of three different Alzheimer’s disease mouse models (Takano et al., 2007; Kuchibhotla et al., 2009). Elevated basal [Ca2+]i levels, an increased frequency of spontaneous [Ca2+]i spikes (Takano et al., 2007; Kuchibhotla et al., 2009) and abnormal Ca2+ waves (Kuchibhotla et al., 2009) are indicative of abnormal gliovascular coupling given that Ca2+ is a key modulator of the release of vasoactive substances by astrocytes (Gordon et al., 2007; Attwell et al., 2010). The picture that emerges is that the presence of amyloid deposits may have multiple additive detrimental effects. Our findings illustrate clearly the physical hindrance that vascular amyloid poses to normal regulation of vascular tone. Future studies must therefore examine the relative importance of each cell in the chain of command, the sequence with which impairments occur, and just how each is affected by the presence of amyloid. For example, it will be important to determine whether abnormal Ca2+ signals affect gliovascular coupling before vascular amyloid forms, and whether this may even contribute to the development of gliosis, as suggested by the time course with which gliosis develops in our hands.
Recent studies have demonstrated that amyloid is dynamically cleared from the brain via the interstitial fluid (Iliff et al., 2012). Bulk flow of CSF, which has also been termed the glymphatic system, carries amyloid through convective flow from the brain tissue towards the perivascular space of veins, with subsequent uptake and clearance. This process depends critically on AQ4 expression on astrocytic end-feet and clearance is impaired under conditions where AQ4 is lost or astrocytic end-feet are impaired (Iliff et al., 2014). It hence stands to reason that loss of polarized expression of AQ4 at the end-feet and loss of contact of the end-feet with the vasculature impairs normal clearance of amyloid, thereby contributing to vascular amyloid build-up. Interestingly, several studies using brain tissue samples of patients with Alzheimer’s disease found another water channel, AQ1 (encoded by AQP1), which is normally restricted to the choroid plexus, upregulated in astrocytes surrounding senile plaques, even at early stages of the disease. AQ1 expression was not localized to the astrocyte end-foot but appeared to be expressed on the entire astrocytic surface, excluding the gliovascular interface (Perez et al., 2007; Misawa et al., 2008; Hoshi et al., 2012). It remains to be seen if enhanced AQ1 expression attempts to compensate for AQ4 loss albeit with improper subcellular localization and how amyloid build-up or clearance is affected by AQ1 upregulation.
A common theme across different CNS diseases is the presence of astrogliosis and the redistribution of astrocytic end-feet proteins, such as AQ4 or members of the dystrophin-associated glycoprotein complex (Warth et al., 2004; Robel et al., 2009; Wolburg et al., 2009; Merlini et al., 2011; Yang et al., 2011). How this relates to functional consequences for the GVU remains largely unknown. Reactive astrocytes secrete extracellular matrix molecules, which might contribute to the abnormalities found at the gliovascular interface at the ultrastructural level, such as thickening of the basement membrane (Farkas and Luiten, 2001; Iadecola, 2013). Reactive astrocytes also release a plethora of cytokines, chemokines and other factors that modulate the microenvironment and can trigger or perpetuate inflammation (Sofroniew, 2009; Robel et al., 2011), which might contribute to cellular damage and other pathological changes at the GVU such as blood–brain barrier breakdown (Zlokovic, 2011; Iadecola, 2013). In the present study, it is unclear whether the disappearing end-feet of astrocytes are cause or consequence of amyloidosis. It is possible that, long before amyloid deposits form, reactive astrocytes may retract their end-feet, permitting the accumulation of amyloid. Alternatively, amyloid deposits may pry the end-feet off the vessels. Gaining a better understanding of this process through long-term imaging may be informative for other neurological diseases.
Importantly, cerebral amyloid angiopathy is observed in 30–40% of non-demented elderly individuals (Vinters, 1987) and amyloid deposition characterizes the brain of athletes that have suffered repeated mild traumatic injury (Smith et al., 2013). Understanding the sequence of events with which amyloid may contribute to ischaemia and in turn neuronal death may inform these other forms of dementia as well.
Acknowledgements
We are grateful to Dr William Klunk (University of Pittsburgh) for the gift of methoxy-XO4, Dr Graham Ellis-Davies for the gift of caged Ca2+ DMNPE-4, and to Miriam Roberson and James Black for help with the mouse colony. Special thanks go to Melissa Chimento and the High-Resolution Imaging Core Facility at UAB for their excellent service preparing the EM samples.
Funding
This work was supported by NIH grants R01NS036692, R01NS031234, R01NS075487, F31NS074597, R01NS082851, T32NS48039; SR received funding from Alzheimer’s of Central Alabama (ACA).
Supplementary material
Supplementary material is available at Brain online.
Abbreviations
- AQ4
aquaporin 4
- GVU
gliovascular unit
- mGluR
metabotropic glutamate receptor
- t-ACPD
(±)-1-aminocyclopentane-trans-1,3-dicarboxylic acid
- VSMC
vascular smooth muscle cell
References
Author notes
*These authors contributed equally to this work.

