


Improved survival of injured neurons and the inhibition of repulsive environmental signalling are prerequisites for functional regeneration. BAG1 (Bcl-2-associated athanogene-1) is an Hsp70/Hsc70-binding protein, which has been shown to suppress apoptosis and enhance neuronal differentiation. We investigated BAG1 as a therapeutic molecule in the lesioned visual system in vivo. Using an adeno-associated viral vector, BAG1 (AAV.BAG1) was expressed in retinal ganglion cells (RGC) and then tested in models of optic nerve axotomy and optic nerve crush. BAG1 significantly increased RGC survival as compared to adeno-associated viral vector enhanced green fluorescent protein (AAV.EGFP) treated controls and this was independently confirmed in transgenic mice over-expressing BAG1 in neurons. The numbers and lengths of regenerating axons after optic nerve crush were also significantly increased in the AAV.BAG1 group. In pRGC cultures, BAG1-over-expression resulted in a ∼3-fold increase in neurite length and growth cone surface. Interestingly, BAG1 induced an intracellular translocation of Raf-1 and ROCK2 and ROCK activity was decreased in a Raf-1-dependent manner by BAG1-over-expression. In summary, we show that BAG1 acts in a dual role by inhibition of lesion-induced apoptosis and interaction with the inhibitory ROCK signalling cascade. BAG1 is therefore a promising molecule to be further examined as a putative therapeutic tool in neurorestorative strategies.
Introduction
Adult neurons of the CNS show only limited regenerative ability after traumatic or metabolic injury, which is insufficient for restoration of functionality. This can be attributed to a diminished intrinsic growth capacity of adult neurons and lesion-induced neuronal cell death but also to growth inhibition by a non-permissive environment. Strategies to overcome regeneration failure therefore should address all of these challenges at once in order to restore functional neuronal circuits (Schwab, 2004).
Bcl-2-associated athanogene-1 (BAG1) is a multifunctional protein binding to Hsp70/Hsc70 (Takayama et al., 1995; Zeiner and Gehring, 1995). Over-expression of BAG1 results in enhanced tumour cell proliferation, increased cell motility and resistance to apoptosis (Takayama et al., 1995, 1999). Neurite length and generation time are significantly increased upon BAG1 transfection in vitro (Kermer et al., 2002). Neuroprotective effects were observed in transgenic mice over-expressing BAG1 in neurons, which show a reduction in ischaemic lesion volume following middle cerebral artery occlusion (Kermer et al., 2003). BAG1−/− mice die during embryogenesis due to failed neurogenesis, suggesting an important role for BAG1 in neuronal differentiation and neuronal survival (Gotz et al., 2005).
BAG1 also interacts with and activates the Raf-1 kinase, which is an upstream element of the Ras-Raf-mitogen-activated protein kinase (MAPK)-cascade. BAG1-mediated Raf-1 activation is Ras-independent and subsequently activates the downstream extracellular signal-regulated kinase (ERK) pathway, resulting in cell growth and differentiation (Wang et al., 1996; Song et al., 2001). Recently, Raf-1 has been shown to interact with ROCK2, a major component of an axonal growth inhibitory signalling pathway. Fibroblasts with conditionally ablated Raf-1 showed ROCK2 hyperactivity and mislocalization at the membrane, leading to dysregulation of the actin and vimentin cytoskeleton (Ehrenreiter et al., 2005). In addition, Raf-1 was reported to physically associate with ROCK2 and to negatively regulate its activity (Piazzolla et al., 2005). Within the cascade triggered by myelin-derived inhibitors of axonal growth, ROCK2 has a pivotal regulatory role in transmission of the inhibitory signal from the small GTPase RhoA to LIM kinase, which in turn regulates actin homeostasis (Schwab, 2004). Inhibition of ROCK by pharmacological inhibitors increases the number and length of regenerating retinal ganglion cells (RGC) after optic nerve crush in vivo and counteracts inhibitory signalling by chondroitin sulphate proteoglycans in vitro (Lingor et al., 2007).
Here, we investigated the effects of AAV-mediated BAG1-over-expression in the lesioned RGC system in vivo. We show that BAG1 acts in a dual way by inhibiting lesion-induced apoptosis and enhancing axonal growth via suppression of ROCK signalling, making it a promising molecule for neurorestorative approaches in the CNS.
Material and Methods
Cloning of AAV.BAG1 and viral vector production
Subcloning of BAG1 cDNA into the AAV expression cassette was performed using the bicistronic vector pAAV-6p1, the plasmid pBAG1 (Kermer et al., 2002), and the subcloning vector pBluescript II KS (Stratagene, Karlsruhe, Germany). AAV genome integrity, indispensable for the virus production, was confirmed by digestion with SmaI, which cuts within the ITR regions responsible for the proper replication of the virus. The AAV.EGFP control vector has been previously used in our group (Malik et al., 2005).
Viral vectors were propagated in HEK 293 cells using the pDG helper (Grimm et al., 1998), to exclude any adenoviral contamination. Viral particles were purified according to established protocols (Zolotukhin et al., 1999) by iodixanol step-gradient centrifugation. Samples were then purified and concentrated by heparin-affinity chromatography on an ÄKTA FPLC system using 1 ml HiTrap Heparin FF columns (Amersham, Buckinghamshire, United Kingdom). FPLC-purified/concentrated vectors were desalted by dialysis against PBS. Genome titres were determined by quantitative PCR and purity was confirmed by PAGE. Titre calculations are based on the assumption that vector preparations contained a ratio of a 1 : 30 transducing units versus viral particles. Due to the neuron-specific expression characteristics of the synapsin promoter (Kugler et al., 2001), functional titres of the vectors were confirmed by EGFP expression analysis in cultured primary rat hippocampal neurons. Lysates obtained from these neuronal cultures were used to confirm protein expression from the viral vectors by immunoblotting.
Primary retinal ganglion cell culture
For immunopurified rat RGC culture, Wistar rat pups were sacrificed on postnatal Days 7–8. RGCs were purified according to a two-step panning protocol for Thy-1 to >99.5% purity described previously (Barres et al., 1988). Cells were plated at a density of 7000 per well on 24-well plates (Sarstedt, Nümbrecht, Germany) containing coverslips coated with poly-d-lysine and laminin and cultured in serum-free neurobasal medium (Gibco, Karlsruhe, Germany), supplemented with glutamine, cysteine, pyruvate, triiodothyronine, B-27 supplement, BSA, transferrin, progesterone, putrescine, sodium selenite (all Gibco), forskolin 10 µM, human BDNF (Tebu, Offenbach, Germany) 50 ng/ml, insulin (Sigma, Taufkirchen, Germany) 5 µg/ml and CNTF (Tebu) 10 ng/ml. 1.5 × 10⁸ i.u. of viral vectors were applied one day after plating in 250 µl medium. Medium was refilled to 500 µl the following day. For Raf-1 kinase inhibition studies, 500 nM Raf-1 kinase inhibitor I in solution (Calbiochem, La Jolla, CA, USA) or DMSO (AppliChem, Darmstadt, Germany) was added to the medium 1 day after virus application and kept for the culture duration (incubation time 3 days). Application was renewed after 2 days.
Quantification of primary RGCs (pRGCs) neurite length
pRGCs expressing the EGFP reporter gene (Day 5 after virus application) were incubated in a climate chamber for live cell imaging (37°C, 5% CO2) on a fluorescence inverted microscope (Axiovert, Zeiss, Oberkochen, Germany) equipped with a CCD camera and AxioVision software (Zeiss). Contrast phase photographs of two random visual fields per culture well were taken with a 10× objective and neurite length was evaluated semi-automatically using the axon tracing module of ‘Image J’ (Free Java software provided by the National Institutes of Health, Bethesda, Maryland, USA). Total neurite length was divided by cell number and expressed as averaged neurite length. Experiments were performed at least in triplicate.
Quantification of pRGCs growth cone surface, cytosolic Raf-1 and perinuclear ROCK2 stainings
For evaluation of RGC growth cone surface, photomicrographs of cells stained with anti-phospho-ADF-cofilin antibody [kind gift of Dr Bamburg (Meberg and Bamburg, 2000)] were taken with a 63× oil immersion objective (Zeiss) using a fluorescence microscope (Axiovert, Zeiss) equipped with a CCD camera and AxioVision software (Zeiss). Growth cone surface, defined as the area protruding from the elongating axon, was measured and quantified using ‘Image J’ (National Institutes of Health).
To quantify fluorescence stainings, photomicrographs of cells stained with anti-Raf-1 or anti-ROCK2 antibodies were taken with the same settings (Cy3-filter, exposure time 500 ms; Cy5-filter, exposure time 10 s; DAPI-filter, exposure time 500 ms). For quantification of cytosolic Raf-1, an area of similar surface and shape was chosen in the middle of cytosol (see supplementary Fig. S5.A). Fluorescence was quantified using ‘Image J’ software (National Institutes of Health). For quantification of perinuclear ROCK2 staining, two areas of similar surface and shape were chosen at the perinuclear region and at the membrane directly opposite to the nucleus (see supplementary Fig. S5.B, C). Fluorescence was quantified using ‘Image J’ software (National Institutes of Health). To minimize fluorescence variability between samples, perinuclear staining data were normalized against the membrane data. Results are expressed as ratio of perinuclear/membrane fluorescence.
CSM culture
Wild-type CSM cells and CSM cells stably transfected with mouse Flag-BAG1 were previously described (Kermer et al., 2002). Cultures were maintained in Dulbecco's modified Eagle's medium (PAA, Coelbe, Germany) supplemented with 10% fetal bovine serum (PAA), 1 mM l-glutamine, 100 U of penicillin/ml, 100 µg of streptomycin sulfate/ml and additional pyromycin (Sigma-Aldrich, Munich, Germany) for selection of stably transfected cells, at either 32°C (permissive temperature) or 39°C (non-permissive temperature) for 1 week (Kermer et al., 2002). For lysates, CSM wild-type and BAG1 cells were plated at a density of 2.3 × 10⁵ and 7.4 × 10⁵ per dish (Ø 10 cm), respectively, to achieve equal densities at switch to permissive temperature. For immunofluorescence analysis, wild-type and stably transfected CSM cells were seeded on glass cover slips (Ø 10 mm) in 24-well plates at a density of 38 000 cells/well. Cultures were maintained at 32°C (non-differentiating conditions) or 39°C (differentiating conditions) in 5% CO2 and 95% humidity. One day before fixation, cells were trypsinized and re-plated at a density of 1 : 3 and 1 : 1 respectively to allow single-cell visualization. For Raf-1 kinase inhibition studies, cells were incubated for 24 h before lysis with 500, 1000 or 2000 nM Raf-1 kinase inhibitor I in solution (Calbiochem) or DMSO (AppliChem), respectively.
Subcellular fractionations
Subcellular fractionations from CSM cells were performed using ProteoExtract® Subcellular Proteome Extraction Kit (Merck Biosciences, Darmstadt, Germany) according to the manufacturer's instructions. Protein expression was further analysed by immunoblotting.
Immunoblot analysis
The protein content of the samples was determined using the bicinchoninic acid assay (Pierce, Rockford, IL, USA) and equal amounts of protein were loaded in each lane for a sodium dodecyl sulphate–polyacrylamide gel electrophoresis (SDS–PAGE). Proteins were usually separated on a 10% stacking gel and proteins transferred to a nitrocellulose membrane (AppliChem). Membranes were blocked with 5% milk (Roth, Karlsruhe, Germany) in Tris–buffered saline/Tween-20 (TBS-T) for 1 h at RT and then incubated with primary antibodies (rabbit anti-BAG1, #1680 (Takayama et al., 1995), 1 : 1000; mouse anti-Raf-1, E-10, 1 : 500; and goat anti-ROCK2, C-20, 1 : 500, both Santa Cruz Biotechnologies, Heidelberg, Germany; mouse anti-vimentin 1 : 2000, Chemicon, Schwalbach, Germany; rabbit anti-calnexin 1 : 1500, GeneTex, San Antonio, TX, USA; goat anti-calpain 1 (N-19) 1 : 500, Santa Cruz Biotechnologies, Heidelberg, Germany; mouse anti-Flag-M2 1 : 1000, Stratagene, Heidelberg, Germany; rabbit anti-phospho-c-Raf (Ser338) 1 : 500; rabbit p44/42 MAPK 1 : 1000; rabbit phospho-p44/42 MAPK (Thr202/Tyr204) 1 : 1000; mouse anti-phospho-SAPK/JNK (Thr183/Tyr185) (G9), 1 : 1000; rabbit anti-c-Jun 1 : 1500; all Cell Signalling, Frankfurt, Germany) overnight at 4°C unless stated otherwise. After 3 × 15 min washing in TBS-T, membranes were incubated with the appropriate HRP-coupled secondary antibodies (1 : 1000; Dianova, Hamburg, Germany) for 1 h at RT. Chemiluminescence from ECL-Plus reagents (Amersham, Arlington Heights, IL, USA) was visualized using a Fluor-S-Max imager (Bio-Rad, Munich, Germany) and Quantity One software (version 4.2.1). Protein quantification of immunoblots was performed using Quantity One software (version 4.2.1).
ROCK activity assay
ROCK activity was measured with Cyclex ROCK Kinase Activity Assay (MoBiTec, Göttingen, Germany) according to the manufacturer's instructions using 0.25 μg protein. The absorbance was measured at 450 nm using an Elisa Reader (TECAN, Crailsheim, Germany).
Immunocytochemistry
Cells grown on coverslips were first fixed in PFA 4% 10 min at room temperature (RT, 22°C), permeabilized with 100% ice-cold acetone (AppliChem) 10 min at −20°C, washed twice with PBS and blocked with 10% normal goat serum 10 min at RT. Probes were incubated with the primary antibodies [goat anti-ROCK2 1 : 50; mouse anti-Raf-1 (E-10), 1 : 50, both Santa Cruz Biotechnologies; anti-phospho-ADF-cofilin (Meberg and Bamburg, 2000)], [rabbit anti-BAG1 1 : 500, #1680 (Takayama et al., 1995)] overnight at 4°C. Following 2× PBS washes, appropriate Cy3- and Cy5-labelled secondary antibodies (1 : 250, Dianova) and rhodamine-conjugated phalloidin (1 : 500, Molecular Probes, Karlsruhe, Germany) were applied for 45 min at 37°C. Cells were then nuclear counter-stained with DAPI (4,6-diamidino-2-phenylindole) (Sigma) and mounted in Mowiol (Hoechst, Frankfurt, Germany). Fluorescence was observed and recorded on a Zeiss Axioplan 2 fluorescence microscope equipped with a CCD camera, an Apotome™ device and AxioVision software (Zeiss) or a Leica SP2 confocal laser scanning microscope equipped with an acousto-optical beam splitter. Fluorescence was quantified using ‘Image J’ software (National Institutes of Health) on pictures taken with the same settings, as indicated in text.
In vivo experiments
All animal experiments were carried out according to the regulations of the local animal research council and legislation of the State of Lower Saxony (Braunschweig). Female Wistar rats were purchased from Charles River (200–250 g; Sulzfeld, Germany). Transgenic BAG1 mice and wild-type littermates (FVB/n, Taconic Inc., Germantown, NY) were described previously (Kermer et al., 2002).
Virus injection
Injections were performed intravitreally either upon brief anaesthesia by diethyl ether inhalation 3 weeks before operation or under general anaesthesia (chloral hydrate, 420 mg/kg body weight, intraperitoneally) at the time of surgery. Each injection consisted of ∼3 µl containing ∼2.5 × 10⁷ i.u./µl. Care was taken to avoid any damage of the lens.
Anaesthesia and surgical approach
The anaesthesia was carried out by intraperitoneal injection of chloral hydrate (420 mg per kg body weight). A similar surgical approach was used in all three experimental paradigms to access the optic nerve. The skin was incised close to the superior orbital rim and the orbita was opened leaving the supraorbital vein intact. The intraorbital glands were partially sectioned and the superior extraocular muscles were spread by means of a small retractor. The optical nerve was exposed by longitudinal incision of the eye retractor muscle and the optic nerve sheath. After surgery retinal blood supply was verified by fundoscopy and animals with persistent retinal ischemia were excluded from the study.
Optic nerve axotomy
Axotomy of the optic nerve was performed essentially as described previously (Lingor et al., 2005; Lingor et al., 2008). The optic nerve was transected at a distance of ∼2 mm from the posterior pole of the eye without damaging retinal blood supply. For retrograde labelling of RGCs, a 2 mm × 2 mm piece of gel foam (Braun, Melsungen, Germany) was soaked in FluoroGold (FG) (Hydroxystilbamidine; Bio-Trend, Cologne, Germany) and placed on the optic nerve stump. On Day 14 or 28 post-axotomy, animals were sacrificed by CO2 inhalation and the eyes were extracted. The cornea, the lens and the vitreous body were removed, and the remaining eye cup containing the retina was fixed in 4% PFA in PBS pH 7.4 (PFA) for 1 h. Retinas were then extracted and flat-mounted on object-slides in glycerol-PBS (1 : 1). In each retinal quadrant of the transduced and non-transduced areas, three fields of 62 500 µm2 were counted at eccentricities of one-sixth and one half and five-sixths of the retinal radius. The number of FluoroGold-positive RGC was determined by fluorescence microscopy (Axioplan, Zeiss) using a commercial FG narrow-band filter set (365/420 nm). Since EGFP fluorescence from strongly labelled amacrine neurons showed some leak through into this filter at longer exposure times, only those cells displaying a round shape and punctate, perinuclear FG accumulations were counted as RGCs. RGC counts were performed independently by two different investigators according to a blinded protocol. In animals treated with AAV.BAG1 or AAV.EGFP, the vector-transduced area of the retina was identified by EGFP-expressing cells. For quantification of initial RGC numbers in control Wistar rats, wild-type and transgenic mice, animals were axotomized and RGCs were retrogradely labelled by FluoroGold. Retinas were extracted at Day 1 after axotomy and RGCs were counted. Since RGC numbers start to decline only around Day 4 following axotomy due to apoptotic cell death (Bähr, 2000), we used the Day 1 values as an indicator for initial RGC numbers.
Axotomy groups consisted of the following animal numbers included in the final evaluation: Rats: sacrificed at Day 1 after axotomy (controls): n = 4. Virus application at Day 0, sacrificed 14 days after axotomy: AAV.EGFP: n = 4, AAV.BAG1: n = 3. Virus application at Day 21, sacrificed at 14 days after axotomy: AAV.EGFP: n = 5, AAV.BAG1: n = 6. Virus application at Day 21, sacrificed at 28 days after axotomy: AAV.EGFP: n = 5, AAV.BAG1: n = 5. Mice: sacrificed at Day 1 after axotomy (controls): wild-type n = 5, BAG n = 5. Sacrificed at Day 14 after axotomy: wild-type n = 3, BAG n = 4.
Optic nerve crush
Ligation of the optic nerve was performed using a 10-0 suture (Ethicon, Johnson-Johnson, Livingston, UK) for 30 s, resulting in a complete transection of all RGC axons. The suture was removed and the operative access closed. Rats were sacrificed on Day 28 after surgery by CO2 inhalation and immediately perfused by transcardial injection of 250 ml PBS and 200 ml 4% PFA. The eye cup containing the retina and the adjacent optic nerve were postfixed in 4% PFA in PBS for 1 h and then dehydrated in 30% sucrose at 4°C for 24 h. After embedding the previously fixed tissues in Cryomatrix (Thermoshandon, Frankfurt, Germany), longitudinal sections (16 µm thickness) of the optic nerve were prepared using a Leica cryostat and collected on gelatine-coated glass slides. For immunohistochemical analysis, specimens were dehumidified at 37°C for 1 h and antigen retrieval was performed for 4 h in TBS-T (pH 9.0) at 60°C. Unspecific binding was blocked by application of 10% normal goat serum, and anti-GAP43 antibody (Biozol, Eching, Germany) was applied in a 1 : 250 dilution at 4°C overnight in order to stain regenerating fibres. After two PBS washes, secondary antibody (Cy-3-labelled anti-rabbit; Dianova) was applied for 45 min at RT. The sections were then nuclear counter-stained with DAPI (4,6-diamidino-2-phenylindole, Sigma) and embedded in Mowiol (Hoechst). For evaluation of RGC axon regeneration, photomicrographs were taken using a fluorescence microscope (Axioplan, Zeiss) equipped with a CCD camera and AxioVision 3 software (Zeiss). Images of whole sections were assembled from single pictures taken with a 20× objective. The number of regenerating axons at designated distances from the crush was evaluated using a counting grid superimposed on the photomicrograph. Optic nerve crush groups consisted of the following animal numbers: Day 0: AAV.EGFP: n = 4, AAV.BAG1: n = 4. d-21: AAV.EGFP: n = 4, AAV.BAG1: n = 4.
For analysis of macrophage infiltration, unspecific binding was blocked by application of Dako Diluent (Dako, Hamburg, Germany), and mouse anti-rat CD68 (ED1) 1 : 200 (ABD-Serotec, Düsseldorf, Germany) was applied at 4°C overnight followed by a secondary Cy-3-labelled anti-mouse antibody. For evaluation of macrophage infiltration, ED1 (CD68)-positive cells were counted in four retinal slides per animal using a 20× objective (Zeiss).
Statistics
All in vitro experiments were reproduced at least in triplicate. Animal groups were as indicated in the according methods section. Differences between groups were considered statistically significant according to a one-way ANOVA followed by a parametric multiple comparison test (Dunnett test). Significances were indicated with *P < 0.05, **P < 0.01, ***P < 0.001, unless otherwise stated.
Results
Over-expression of BAG1 in RGC by bicistronic AAV-2 vectors
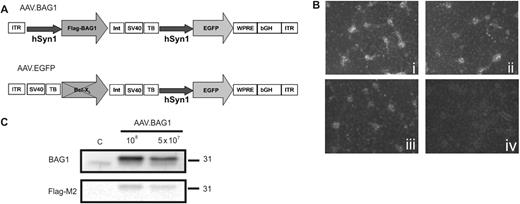
Viral vectors and experimental setup. (A). Schematic depiction of the AAV-2 vector genomes. ITR: AAV-2 inverted terminal repeat; hSyn1: human synapsin 1 gene promoter; Flag-BAG1: mouse BAG1 cDNA N-terminally tagged with the Flag epitope; Bcl-XL: rat Bcl-XL cDNA (flanked by a transcription blocker, not transcribed); Int: intron; SV40: SV40 polyadenylation site; TB: synthetic transcription blocker; WPRE: woodchuck hepatitis virus posttranscriptional regulatory element; bGH: bovine growth hormone polyadenylation site. (B). Titration of AAV.BAG1 in vitro. Application of 1 × 10⁸ (i), 5 × 10⁷ (ii) and 1 × 10⁷ (iii) i.u. AAV.BAG1 respectively induces the expression of EGFP reporter gene in a concentration-dependent manner in primary hippocampal neurons. Non-treated control (iv). (C). Analysis of transgene expression by immuno blot. Application of 1 × 10⁸ and 5 × 10⁷ i.u. AAV.BAG1 on primary hippocampal neuron cultures induces the expression of BAG1 in a concentration-dependent manner. Endogenous expression of BAG1 (lower band), visible in control and infected cultures, was used as loading control. Expression of the Flag-BAG1 construct was additionally verified by anti-Flag-M2 antibody. Size standards in kDa are shown on the right.
AAV.BAG1 infection induced a concentration-dependent expression of the EGFP reporter gene in cultured hippocampal (HC) neurons (Fig. 1B) and this was confirmed by immunoblot analysis of primary HC neuron lysates (Fig. 1C). The expression of endogenous BAG1 (Fig. 1C, upper panel, lower band) is visible in both control and infected cultures at similar levels, serving as protein loading control. Expression of the Flag-BAG1 construct was additionally verified by anti-Flag-M2 antibody.
RGC survival after axotomy is increased by BAG1
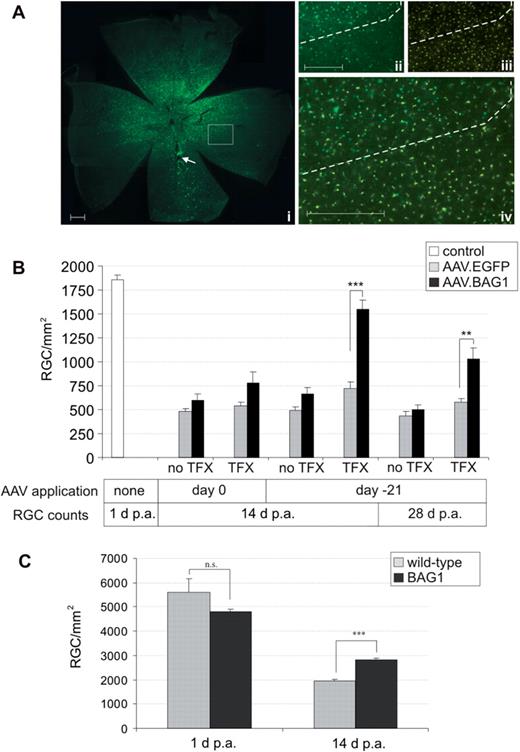
RGC survival after axotomy. (A). (i) EGFP expression in RGCs (retinal flat mount) after intravitreal injection of 5 × 10⁷ transducing units of AAV.EGFP 28 days following axotomy. Approximately 1/3 of the retina is transduced around the injection site (arrow). (ii–iv) Comparison of transfected and non-transfected areas (dashed line) shows that virus application does not result in cytotoxicity (ii, EGFP; iii, Fluorogold; iv, merge). Scale bar: 1 mm. Scale bar in inserts: 500 µm. (B). Surviving RGCs at 1 (control), 14 and 28 days post-axotomy (d. p.a.) in AAV.BAG1- or AAV.EGFP-injected rats. Bars represent means ± SEM. **P < 0.01, ***P < 0.001. TFX, transfected area; no TFX, not transfected area. (C). Surviving RGCs in BAG1 transgenic and wild-type mice at 1 (control) and 14 d. p.a. Bars represent means ± SEM. n.s., not significant; ***P < 0.001.
Second, we compared the results obtained by AAV infection with transgenic mice over-expressing BAG1 in neurons [Fig. 2C (Kermer et al., 2003)]. At 14 d.p.a, BAG1 transgenic mice showed a ∼35% improvement in RGC survival (2838 ± 53 RGC/mm2 , 59.0% of control retina) compared to their wild-type litter-mates (1852 ± 54 RGC/mm2 , 34.9% of control retina). Initial RGC numbers (at 1 day post-axotomy) did not significantly differ between wild-type and BAG1 transgenic mice. Thus, BAG1 protects RGC from axotomy upon over-expression either from a stable transgenic or from an AAV vector.
BAG1 increases number and length of regenerating axons after optic nerve crush
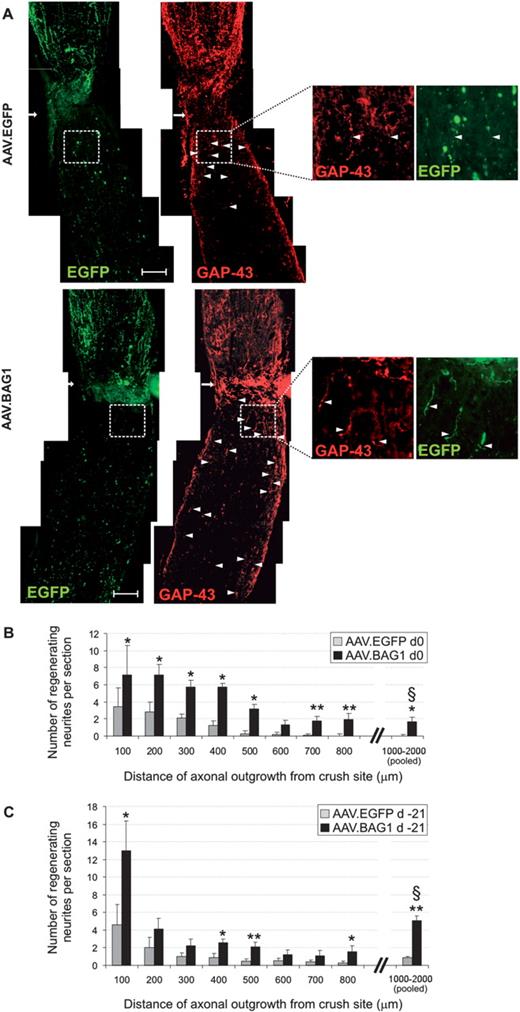
Axonal regeneration after optic nerve crush. (A). Representative photomicrographs of regenerating axons in optic nerve sections of animals treated with 5 × 10⁷ i.u. AAV.EGFP and AAV.BAG1 respectively 21 days before lesion. GAP43 positive regenerating axons (indicated by arrow heads) extend beyond the crush site (arrows). Scale bar: 200 µm. B and C. Number of regenerating axons 28 days after optic nerve crush at designated distances from the crush site when AAV-2 vectors were applied at the day of surgery (B) or 21 days before surgery (C). Numbers of regenerating axons between 1000 and 2000 µm from the crush were pooled for better readability. Bars represent means ± SEM. *P < 0.05, **P < 0.01. § P < 0.05 between groups in B and C.
Neurite length and growth cone surface in vitro are increased by BAG1
For in vitro analysis of neurite length and growth cone surface, primary RGC (pRGC) cultures were infected with AAV.EGFP and AAV.BAG1 vectors. Morphological analysis was performed 5 days after vector application, when pRGC showed sufficient BAG1 and EGFP expression (supplementary Fig. S2).
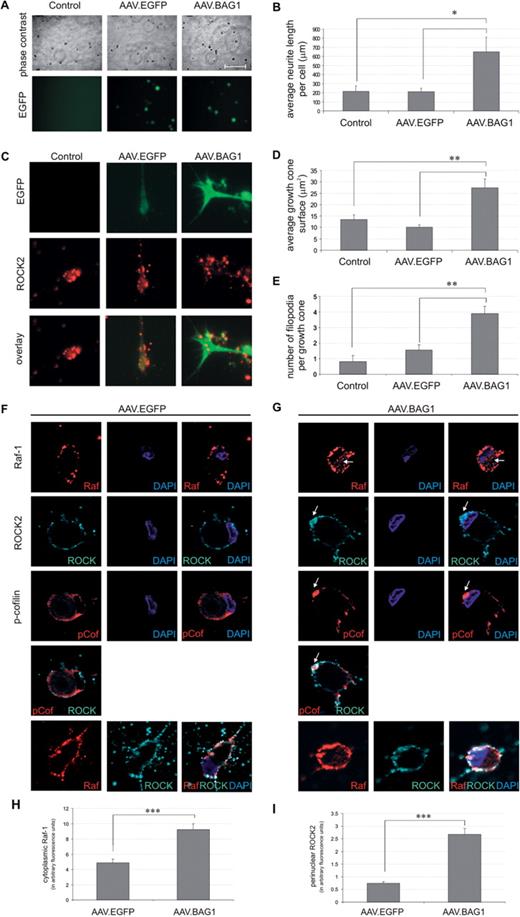
BAG1 induces translocation of Raf-1 and ROCK2 in primary RGCs. (A). Representative micrographs (phase contrast, upper panel; EGFP, lower panel) of untreated (control), AAV.EGFP- and AAV.BAG1-treated pRGCs. Scale bar: 200 µm. (B). Quantitative analysis of neurite outgrowth at 5 days after virus application. Application of AAV.BAG1 resulted in a significant increase in neurite outgrowth compared to AAV.EGFP and non-treated cells. Bars represent means ± SEM. For all treatments, n = 4. *P < 0.05. (C). Representative micrographs of growth cones in pRGCs treated with AAV.BAG1, AAV.EGFP or untreated controls. Growth cones are visualized by EGFP expression and ROCK2 immunocytochemistry. (D). Quantitative analysis of growth cone surface at 5 days after virus application. Bars represent means ± SEM. Control, n = 36; AAV.EGFP, n = 33; AAV.BAG1, n = 29. **P < 0.01. (E). Quantitative analysis of number of filopodia per growth cone at 5 days after virus application. Bars represent means ± SEM. Control, n = 27; AAV.EGFP, n = 33; AAV.BAG1, n = 31. **P < 0.01. F and G. Photomicrographs depicting Raf-1, ROCK2 and phospho-cofilin subcellular localization in pRGCs. Cells were treated with AAV.EGFP (F) and AAV.BAG1 (G) respectively for 5 days and stained with antibodies specific for Raf-1, ROCK2 and phospho-cofilin followed by the appropriate fluorochrome-conjugated antibodies and DAPI. Arrows indicate translocation of Raf-1 to the cytoplasmic compartment (upper row) and translocation of ROCK2 to the nuclear/perinuclear space (rows 2–4) in AAV.BAG1-treated cells as compared to AAV.EGFP treated controls. Raf-1 and ROCK2 partially colocalize (row 5). (H). Quantitative analysis of cytoplasmic Raf-1 expression. Data are expressed in arbitrary fluorescence units. AAV.EGFP, n = 21; AAV.BAG1, n = 29. ***P < 0.001. (I). Quantitative analysis of nuclear ROCK2 expression. Data are expressed in arbitrary fluorescence units. AAV.EGFP, n = 22; AAV.BAG1, n = 28. ***P < 0.001.
Translocation of Raf-1 and ROCK2 in primary RGC after BAG1-over-expression
Our in vivo data suggested neuroprotective and regeneration-promoting roles for BAG1 in lesioned RGC, but the underlying molecular mechanisms remained unclear. BAG1 has previously been shown to activate Raf-1 kinase (Wang et al., 1996). The lack of Raf-1 has been demonstrated to result in the recruitment of ROCK2 to the cell membrane and ROCK2 hyperactivity (Ehrenreiter et al., 2005). We thus investigated whether Raf-1-induced translocation of ROCK2 could be involved in BAG1-mediated effects on regeneration.
We examined the subcellular localization of Raf-1 and ROCK2 upon BAG1-over-expression. Pseudo-confocal fluorescence microscopy of non-treated and AAV.EGFP-treated pRGC showed membrane-bound localization of both Raf-1 and ROCK2 (Fig. 4F and data not shown). In contrast, AAV.BAG1 induced more cytoplasmic expression of Raf-1 (Fig. 4G). In both AAV.EGFP and AAV.BAG1-treated pRGC, phospho-cofilin was mostly localized at the cell membrane (Fig. 4F and G). ROCK2 partially colocalized with phospho-cofilin in control pRGC. In contrast, AAV.BAG1-treated cells showed a strong perinuclear concentration of ROCK2 compared to AAV.EGFP-treated cells. Consistent with a previous report (Ehrenreiter et al., 2005), we observed a colocalization of Raf-1 and ROCK2, which was most pronounced at the membrane (Fig. 4F and G). Quantification of fluorescence showed a significant increase of cytoplasmic Raf-1 (∼2-fold) and perinuclear ROCK2 (∼3-fold) in AAV.BAG1-treated cells compared to controls (9.21 ± 0.76 arbitrary fluorescence units vs 4.88 ± 0.46 arbitrary fluorescence units, and 2.67 ± 0.23 arbitrary fluorescence units vs 0.74 ± 0.07 arbitrary fluorescence unit, respectively; Fig. 4H and I).
BAG1 induces Raf-1 and ROCK2 translocation in CSM cells
To further examine the subcellular protein localization of Raf-1 and ROCK, we used the rat CSM14.1 neuronal cell line stably transfected with Flag-BAG1 (Kermer et al., 2002). CSM14.1 cells have larger cell bodies than RGC, allowing for a better identification of cellular structures and the generation of sufficient amounts of protein lysates for subcellular fractionation studies. Upon growth at permissive temperature (32°C), CSM cells remain in a non-differentiated state and proliferate. Incubation at non-permissive temperature (39°C) results in their differentiation into neurons. Culture lysates from wild-type or BAG1 over-expressing CSM cells were analysed by immunoblotting using antibodies directed against BAG1, Raf-1, and ROCK2.
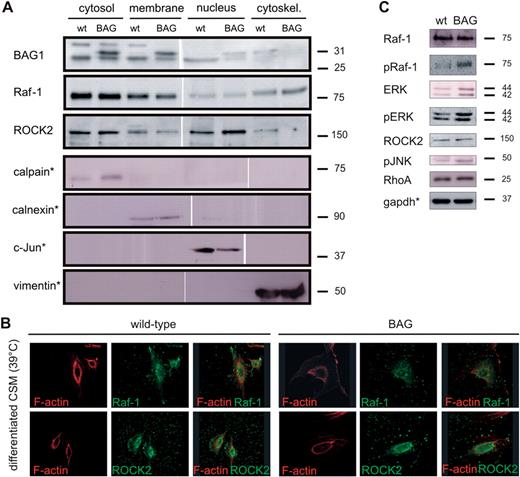
Subcellular localization of Raf-1 and ROCK2 in BAG1-over-expressing CSM cells. (A). Immuno blot analysis of subcellular expression of BAG1, Raf-1, and ROCK2 in differentiated CSM cells respectively. Endogenous expression of BAG1 (lower band) was used as a loading control. Calpain, calnexin, c-Jun and vimentin (*, representative immuno-blots) were probed as markers of fraction specificity. Experiments were repeated at least three times with cells from different passages. Size standards in kDa are shown on the right. For immunoblot quantification, see supplementary Figure S4B and D. (B). Cellular localization of Raf-1 and ROCK2 in differentiated wild-type and BAG1-over-expressing CSM cells. Cells stained with rhodamine-conjugated phalloidin and antibodies specific for Raf-1 and ROCK2 followed by the appropriate fluorochrome-conjugated antibodies were analysed by confocal microscopy. (C). Immunoblot analysis of downstream effectors of the Ras-Raf-MAPK cascade and RhoA in differentiated CSM cells. Gapdh (*representative picture) was probed for each immuno-blot as a loading control. Experiments were repeated at least three times with cells from different passages. Size standards in kDa are shown on the right. For immuno-blot quantification, see supplementary Figure S4F. wt, wild-type CSM cells; BAG, BAG1-over-expressing CSM cells.
To exclude changes in overall expression, we analysed protein expression in whole cell lysates. Figure 5C shows the expression levels of Raf-1, phospho-Raf-1, the downstream effectors of the Ras-Raf-pathway ERK, phospho-ERK and phospho-JNK as well as RhoA and ROCK2 in differentiated CSM cells. BAG1-over-expression induced a significant increase in phospho-Raf-1, while Raf-1 levels remained stable. These results are in line with previous works reporting Raf-1 activation (indicated by phosphorylation) by BAG1 (Wang et al., 1996; Song et al., 2001). ERK and phospho-ERK levels were also increased in BAG1-over-expressing cells (Kermer et al., 2002). Levels of phospho-JNK show a moderate increase upon BAG1-over-expression. No significant differences were observed in RhoA and ROCK2 expression levels between differentiated wild-type and BAG1-over-expressing cells.
ROCK activity is decreased in a Raf-1-dependent manner upon BAG1-over-expression
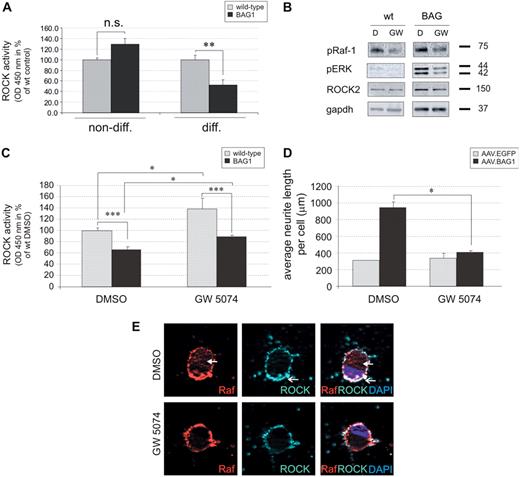
Over-expression of BAG1 reduces ROCK activity in neuron-like CSM cells. (A). ROCK activity in wild-type and BAG1 over-expressing CSM cells. Data are from three independent experiments each. Bars represent means ± SEM., n.s. not significant; **P < 0.01. non-diff., non-differentiated; diff., differentiated. (B). Immuno-blot analysis of phospho-Raf-1, phospho-ERK and ROCK2 expression following Raf-1 kinase inhibition. Application of 500 nM Raf-1 kinase inhibitor GW5074 (GW) leads to a decreased phospho-Raf-1 expression and its activated downstream effector phospho-ERK compared to DMSO-treated control (D). Gapdh was probed for each immuno-blot as a loading control. Experiments were repeated at least three times with cells from different passages. Size standards in kDa are shown on the right. For immuno-blot quantification, see supplementary Figure S4G. wt, wild-type; BAG, BAG1-over-expressing CSM cells. (C). Inhibition of Raf-1 kinase activity by GW5074 (2000 nM) affects ROCK activity. Data are from at least three independent experiments each. Bars represent means ± SEM. *P < 0.05, ***P < 0.001. (D). Neurite length in pRGC after treatment with the Raf-1 inhibitor GW5074 or DMSO (control). AAV.BAG1-transduced pRGC have longer neurites than their AAV.EGFP-treated controls and this effect of BAG1 is reversed by treatment with the Raf-1 inhibitor GW5074. For all conditions, n = 4. (E). Subcellular localization of Raf-1 and ROCK2 in AAV.BAG1-treated pRGCs after application of Raf-1 inhibitor (GW5074) or DMSO (control). Cells were stained with antibodies specific for Raf-1 and ROCK2 followed by the appropriate fluorochrome-conjugated antibodies and DAPI. Arrows indicate translocation of Raf-1 to the cytoplasmic compartment and ROCK2 to the nuclear/perinuclear space only in the control condition (DMSO-treated), while GW5074 treatment reverses the BAG1-induced translocation of Raf-1 and ROCK.
We further examined whether Raf-1 could be the molecular link between BAG1-over-expression and the observed decrease in ROCK activity. CSM cells were treated for 24 h with the Raf-1 kinase inhibitor GW5074 or DMSO before lysis and Raf-1 inhibition was verified by immuno-blot analysis. Inhibitor application resulted in a decrease of phospho-Raf-1 and its activated downstream effector phospho-ERK compared to DMSO-treated controls, demonstrating the efficient inhibition of Raf-1. ROCK2 expression was not influenced by Raf-1 inhibition (Fig. 6B).
ROCK activity was then quantified in lysates of cells treated with the Raf-1 kinase inhibitor. Application of GW5074 resulted in a concentration-dependent increase in ROCK activity, both in wild-type and BAG1-over-expressing CSM cells (Fig. 6C). Specifically, incubation with 2000 nM GW5074 significantly increased ROCK activity, resulting in a significantly higher enzymatic activity in wild-type and BAG1-over-expressing CSM cells compared to DMSO controls (138.5 ± 8.6% vs 100.0 ± 4.3% and 88.3 ± 6.2% vs 66.3 ± 5.9%, respectively).
To confirm that Raf-1 is the molecular link between BAG1-over-expression, decrease in ROCK activity, and enhanced neurite outgrowth, we tested whether application of GW5074 had an impact on the neurite outgrowth of pRGC. Upon DMSO treatment, AAV.BAG1-treated cells exhibit a ∼3-fold higher average neurite length compared to AAV.EGFP (942.4 ± 74.6 µm and 314.8 ± 0.4 µm respectively, Fig. 6D). In contrast, application of 500 nM GW5074 dramatically impaired neurite outgrowth (AAV.BAG1: 411.1 ± 32.6 µm; AAV.EGFP: 337.6 ± 70.2 µm). Analysis by pseudo-confocal fluorescence microscopy of co-staining with Raf-1 and ROCK2 showed that following GW5074 application, AAV.BAG1-treated cells exhibit a pattern of Raf-1 and ROCK2 membrane localization similar to AAV.EGFP-treated and non-AAV-treated controls (Figs. 6E and 4F and data not shown).
Discussion
Successful regenerative strategies for the CNS depend on the simultaneous targeting of different mechanisms, such as lesion-induced neuronal cell death and axonal growth inhibitory signals derived from myelin proteins. In the present study, we thus evaluated a gene therapeutic approach to counteract apoptosis and axonal growth inhibition by AAV-mediated over-expression of BAG1 in RGC.
BAG1 is neuroprotective and promotes regeneration in vivo
BAG1 has previously been shown to act in an anti-apoptotic and neuroprotective manner in an experimental stroke model in vivo (Kermer et al., 2003). To assess neuroprotection after traumatic injury we used the optic nerve axotomy model, in which ∼80–90% of RGC degenerate 2 weeks following deafferentiation (Kermer et al., 1998; Lingor et al., 2005; Malik et al., 2005). The AAV vector was applied 3 weeks prior to surgery (Day 21), allowing for sufficient protein expression before lesioning, or at the time of axotomy (Day 0) mimicking a possible therapeutic application. Although sufficient retinal transgene expression was observed in both groups at the time of extraction of the retinas (Day 14), only the group receiving AAV.BAG1 injection prior to the lesion showed a significant increase (∼70%) in surviving RGC numbers compared to AAV.EGFP controls (Fig. 2B). The neuroprotective effect of AAV.BAG1 was also still present at 28 days after axotomy (Fig. 2B). This is in line with previous reports demonstrating AAV-mediated neuroprotection of RGCs up to 8 weeks after axotomy (Malik et al., 2005). AAV-mediated transgene expression under the human synapsin promoter requires several days to be fully expressed in infected neurons (Kugler et al., 2003), which may therefore not be sufficient to counteract apoptosis when applied simultaneously with the lesion. The slightly higher numbers of surviving RGC observed in AAV.EGFP-infected areas, though not statistically significant, may be due to cytokine secretion following the virus application itself (Straten et al., 2002). The cytoprotective effect of BAG1 was confirmed in transgenic BAG1 mice, which showed a ∼50% increase in RGC survival compared to wild-type littermates (Fig. 2C). The number of surviving RGCs post-axotomy in AAV.EGFP-treated rats (Fig. 2B) was lower than the corresponding numbers in wild-type mice (Fig. 2C). Interestingly, FVB/N mice–the background strain for our BAG1 transgenics–have previously been shown to be more robust following an axotomy lesion than their counterparts with a C57BL/6 background (Liu et al., 2003). Thus higher surviving RGC numbers following axotomy may be due to differences in species and strain.
In addition to its neuroprotective effects, BAG1-over-expression in vitro results in longer neurites and increased generation time in CSM cells (Kermer et al., 2002). In our model, RGC regeneration was quantified 28 days after crush. Here, transgene expression after vector injection at the day of lesion (Day 0) was found sufficient to significantly enhance axon regeneration in AAV.BAG1-treated animals, opening a window for future therapeutic options. BAG1-over-expression resulted in an up to 3-fold higher number of regenerating axons extending 800 µm or more past the crush site compared to animals treated with AAV.EGFP, which showed a maximal regeneration length of 600 µm (Fig. 3). The increased survival observed 2 weeks after axotomy in animals treated with AAV.BAG1 may partly contribute to the better regeneration response. However, BAG1-transfected RGC were not only increased in number, but also extended longer axons past the crush site. Most interestingly, when animals were injected with AAV.BAG1 21 days before axotomy, an increased number of regenerating neurites was found at longer distances (>1000 µm beyond the crush site) compared to animals that received the AAV injection at the day of lesion (Fig. 3C). Pre-treatment with AAV.BAG1 thus seems to more strongly disinhibit long distance axonal regeneration. Our in vitro data suggests that this could be attributed to an earlier onset of BAG1-induced inhibition of ROCK activity in the pre-treatment group.
In vitro, BAG1-over-expression enhances neurite outgrowth and modifies growth cone morphology by increasing growth cone area and the number of filopodia (Fig. 4). Together, these results suggest that BAG1 is not only neuroprotective, but also plays an important role in promoting regeneration by triggering cellular remodelling involved in neurite outgrowth. For functional restoration in the CNS, the simultaneous targeting of apoptosis and growth inhibition is crucial. For example, AAV-2-mediated expression of the anti-apoptotic molecule Bcl-XL resulted in comparable RGC survival rates at 14 d.p.a (Malik et al., 2005). However, Bcl-XL expression alone failed to enhance axonal growth in retinal explants (Dietz et al., 2006). AAV-mediated expression of the ciliary neurotrophic factor (CNTF) has been shown to potently increase the number of surviving RGC and to promote regeneration (Leaver et al., 2006a). When AAV-CNTF was applied to Bcl-2 transgenic mice, an even stronger regenerative response could be observed, but the differences between wild-type and Bcl-2 transgenic mice levelled off at longer distances from the crush suggesting rather a primary effect on survival than on regenerative ability (Leaver et al., 2006b). Latter studies clearly demonstrate that the overall regenerative outcome crucially depends on survival of axotomized neurons, but that the length of regenerating axons does not directly correlate with better survival. In contrast to this, our data demonstrates that AAV.BAG1-treated animals grew not only more, but longer axons and this effect was sustained at longer distances from the crush site (Fig. 3). The overall regeneration in the present study is less pronounced than in previous studies of our group, where substances, e.g. CNTF or ROCK inhibitors, were applied intravitreally and thus target the entire RGC population (Lingor et al., 2007, 2008). In our present work, only partial transduction of the retina by AAV was intended in order to obtain intraretinal controls within the same animal, which necessarily limits the number of targeted RGCs, but at the same time permits a qualitative evaluation of the regeneration response.
CNTF and many other growth factors mainly act via inhibition of lesion-induced apoptosis and increase the intrinsic regenerative capacity of adult neurons by activation of pro-survival pathways, e.g. MAPK, Akt and STAT3 (Park et al., 2004). Pathways which propagate growth inhibitory signals from myelin-derived molecules are only moderately modulated by CNTF signalling (Lingor et al., 2008) and this may account for the persistence of growth inhibition at longer regeneration distances.
Regulation of subcellular translocation of Raf-1 and ROCK2 by BAG1
BAG1 has been shown to bind to and activate the kinase Raf-1 (Wang et al., 1996; Song et al., 2001). In turn, Raf-1 was reported to colocalize and associate with ROCK. Lack of Raf-1 resulted in the recruitment of ROCK2 to the cell membrane and ROCK2 hyperactivity (Ehrenreiter et al., 2005). Accordingly, our in vitro results obtained by immunocytochemistry and subcellular fractionation show that BAG1-over-expression induces Raf-1 translocation from a membrane-associated localization to the cytoplasm and ROCK2 translocation from the membrane to the perinuclear region respectively (Figs 4 and 5). Following activation, Raf-1 has been reported to undergo intracellular redistribution, to the perinuclear space (e.g. Rapp et al., 1988), or into the nucleus (Olah et al., 1991; Brennscheidt et al., 1994). Our subcellular fractionation results are in line with a previous report showing a mostly cytoplasmic and partly perinuclear localization of Raf-1 in brain lysates (Morice et al., 1999). Thus, over-expression of BAG1 triggers Raf-1 translocation, recruiting Raf-1 to a functionally different cellular compartment.
Our data also shows that ROCK2 translocates from membrane localization to the perinuclear and nuclear space upon BAG1-over-expression in pRGCs and CSM cells. ROCK2 is reported to be essentially cytosolic and to translocate to the membrane upon Rho-activation (Matsui et al., 1996). In fibroblasts, ROCK2 is found mostly at the cell membrane and in the perinuclear space (Yoneda et al., 2005), while recent studies also observed ROCK in the nucleus associated with Cdc25A or p300 acetyltransferase (Bhowmick et al., 2003). This suggests that, while active at the membrane under physiological conditions, ROCK2 translocation to the cytosol and perinuclear space might result in enzymatic inhibition and possible yet unknown functions in regulating gene transcription. Moreover, ROCK2 partially colocalizes with ADF-cofilin, consistent with its well-described role in actin stabilization (Mueller et al., 2005).
Regulation of ROCK activity by BAG1 via Raf-1
Our results thus suggest that BAG1-induced regeneration is mediated by Raf-1. In vitro, BAG1-over-expression activates Raf-1 and its downstream effector ERK, a finding consistent with previous studies (Wang et al., 1996; Song et al., 2001; Kermer et al., 2002; Liman et al., 2005). ERK regulation of gene transcription plays a major role in developmental axon growth (Markus et al., 2002). Accordingly, Raf-1 kinase inhibition reduced phospho-ERK expression in pRGC (data not shown) and impaired axon outgrowth.
Additionally, BAG1-over-expression significantly reduces ROCK activity in vitro, although ROCK2 expression levels remain stable within the cell. This effect does not involve RhoA, an upstream activator of ROCK, but is dependent on Raf-1 kinase. Application of Raf-1 kinase inhibitor increases ROCK activity in wild-type and BAG1-over-expressing cells, suggesting that Raf-1 is responsible for the BAG1-mediated reduction in ROCK activity in CSM cells. The N-terminal regulatory domain of Raf-1 was shown to negatively regulate the kinase domain of ROCK (Piazzolla et al., 2005), while the Raf-1 kinase domain is not involved in ROCK interaction (Ehrenreiter et al., 2005). This suggests that the sterical impairment in the Raf-1/ROCK interaction through inhibitor-binding results in a reduction of ROCK inhibition, even though we cannot rule out that the observed effect on ROCK activity is at least partially mediated by inhibition of the kinase activity of Raf-1.
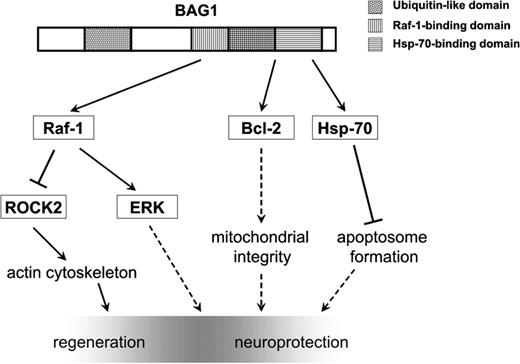
BAG1 is involved in the regulation of signalling cascades in neuroprotection and regeneration. Model of BAG1-mediated regeneration and neuroprotection based on the reported findings and the current literature. BAG1 activates Raf-1, which leads to the activation of the MAPK pathway and inhibition of ROCK activity. Activation of ERK may play a role in enhancement of the intrinsic capability of neurons to regenerate by stimulating neurite outgrowth, while decrease in ROCK enzymatic activity, in addition to the translocation of ROCK2 from a membrane-bound to cytosolic and perinuclear space, may result in modulation of actin cytoskeleton and growth cones. Through its Hsp70-binding domain, BAG1 activates Bcl-2 and Hsp-70, thus enhancing survival. Full lines: direct interaction; dashed lines: indirect interaction. Pointed end: stimulation; bar end: inhibition.
Funding
DFG-Research Center for Molecular Physiology of the Brain (S.K., P.K., M.B. and P.L.); Wings for Life Spinal Cord Research Foundation (WFL-DE-005/07 to P.L.); Nervous System Repair Research Training Network—Marie Curie fellowship (V.P.).
Acknowledgements
We thank Elisabeth Barski, Alexandra Marten, Ulrike Schöll and Beate Veith for excellent technical assistance, Johanna Knöferle for help with virus injections and Dr J.R. Bamburg for the kind gift of the anti-phospho-ADF/cofilin antibody.
References
Abbreviations:
- AAV
adeno-associated virus
- BAG1
Bcl-2-associated athanogene-1
- d.p.a.
days post-axotomy
- EGFP
enhanced green fluorescent protein
- ERK
extracellular signal-regulated kinase
- MAPK
mitogen-activated protein kinase
- pRGC
primary retinal ganglion cell

