


Abstract
See Schoenen (doi: ) for a scientific commentary on this article.
Migraine with aura is prevalent in high-altitude populations suggesting an association between migraine aura and hypoxia. We investigated whether experimental hypoxia triggers migraine and aura attacks in patients suffering from migraine with aura. We also investigated the metabolic and vascular response to hypoxia. In a randomized double-blind crossover study design, 15 migraine with aura patients were exposed to 180 min of normobaric hypoxia (capillary oxygen saturation 70–75%) or sham on two separate days and 14 healthy controls were exposed to hypoxia. Glutamate and lactate concentrations in the visual cortex were measured by proton magnetic resonance spectroscopy. The circumference of cranial arteries was measured by 3 T high-resolution magnetic resonance angiography. Hypoxia induced migraine-like attacks in eight patients compared to one patient after sham ( P = 0.039), aura in three and possible aura in 4 of 15 patients. Hypoxia did not change glutamate concentration in the visual cortex compared to sham, but increased lactate concentration ( P = 0.028) and circumference of the cranial arteries ( P < 0.05). We found no difference in the metabolic or vascular responses to hypoxia between migraine patients and controls. In conclusion, hypoxia induced migraine-like attacks with and without aura and dilated the cranial arteries in patients with migraine with aura. Hypoxia-induced attacks were not associated with altered concentration of glutamate or other metabolites. The present study suggests that hypoxia may provoke migraine headache and aura symptoms in some patients. The mechanisms behind the migraine-inducing effect of hypoxia should be further investigated.
See Schoenen (doi: ) for a scientific commentary on this article.
Migraine with aura is prevalent in high-altitude populations, suggesting an association with hypoxia. Arngrim et al. show that experimental hypoxia provokes migraine attacks in patients with a history of migraine with aura, and triggers dilation of cranial arteries. Using hypoxia to trigger aura will aid investigation of the underlying mechanisms.
Introduction
Migraine is a complex neurological disease affecting 12% of the population, with enormous impact on patients’ ability to work and on their family and social life ( Lipton et al. , 2007 ). For centuries, physicians have been fascinated by the wide variety of migraine symptoms, and especially by aura symptoms, such as the transient visual and sensory alterations, which may precede headache ( Tfelt-Hansen, 2010 ). To date, no validated model to provoke and investigate migraine with aura under controlled conditions exists. In 1982, Amery hypothesized that hypoxia might trigger migraine attacks ( Amery, 1982 ). Several studies support an association between migraine with aura and hypoxia. Epidemiological studies reported a high prevalence of migraine in high-altitude populations ( Arregui et al. , 1991 , 1994 ), in particular of migraine with aura, which affected 19% of the adult males ( Arregui et al. , 1994 ) compared to 5% at sea level ( Russell et al. , 1995 ). Cortical spreading depression is widely accepted as the cause of migraine auras. Cortical spreading depression is characterized by a self-propagating wave of depolarization that spreads across the cerebral cortex followed by hypoperfusion ( Olesen et al. , 1981 ; Lauritzen et al. , 1982 ). Hypoxia induces cortical spreading depression in mice in vivo ( Takano et al. , 2007 ) and in rat brain slices ( Mané and Müller, 2012 ). Exposure to hypoxia increases duration and decreases threshold of cortical spreading depression induced by potassium chloride in mice ( Takano et al. , 2007 ). Hypoxia is associated with increased lactate concentration in the brain in healthy volunteers ( Edden et al. , 2010 ; Harris et al. , 2013 ) and glutamate concentration in the brain of animals ( Zoremba et al. , 2007 ). Interestingly, migraine with aura patients demonstrated increased glutamate ( Siniatchkin et al. , 2012 ; González de la Aleja et al. , 2013 ) and lactate ( Watanabe et al. , 1996 ; Sándor et al. , 2005 ) concentrations in the brain outside of attacks measured by proton magnetic resonance spectroscopy ( 1 H-MRS). Increased lactate has been suggested to reflect mitochondrial dysfunction, which may play a role in migraine with aura pathophysiology ( Welch et al. , 1989 ; Barbiroli et al. , 1990 , 1992 ; Montagna, 1995 ; Boska et al. , 2002 ; Lodi et al. , 2006 ).
We hypothesized that experimental normobaric hypoxia induces migraine attacks associated with changes in brain glutamate and lactate and with dilatation of cranial arteries in patients with migraine with aura. We conducted a randomized double-blind sham-controlled study and investigated changes in glutamate and lactate concentrations in the visual cortex by 1 H-MRS and circumference of cranial arteries by high-resolution magnetic resonance angiography (MRA). In addition, we investigated healthy volunteers during hypoxia to compare hypoxic responses of patients to controls.
Materials and methods
Participants were recruited via a Danish website for recruitment of volunteers to health research and via the outpatient clinic at the Danish Headache Centre (Rigshospitalet Glostrup, Copenhagen, Denmark). Patients with migraine with aura suffering from typical aura in every attack, in accordance with the International Classification of Headache Disorders 3 beta version (ICHD-3 beta, 2013 ), with minimum one attack per month were recruited for the study. We also recruited age (±3 years) and sex-matched controls without a history of migraine or first-degree relatives with migraine. Exclusion criteria for all participants were any other type of headache (except episodic tension type headache <5 days per month), any somatic or psychiatric disease, smoking, a history of mountaineering training and any daily medication apart from oral contraceptives.
The study was approved by the Ethics Committee of the Capital Region of Denmark (H-4-2012-182) and the Danish Data Protection Agency, and was registered at Clinicaltrials.gov (ID: NCT01896167). All participants provided their written informed consent to participate in the study after detailed oral and written information about the study in accordance with the Declaration of Helsinki of 1964, with later revisions.
Experimental design
In a double-blind, crossover design, the patients were randomly allocated to 180 min of inhalation of the test gas through a mask: normobaric hypoxia [mixture of nitrogen and atmospheric air, capillary oxygen saturation (SpO 2 ) of 70–75%] or a sham procedure (atmospheric air, Strandmoellen, Denmark) on two separate days with a minimum of 7 days between. The controls were exposed to similar hypoxia on one study day ( Fig. 1 ).
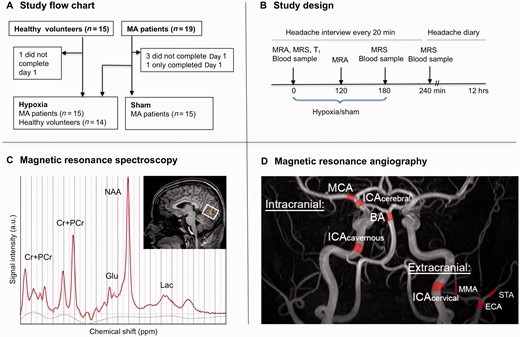
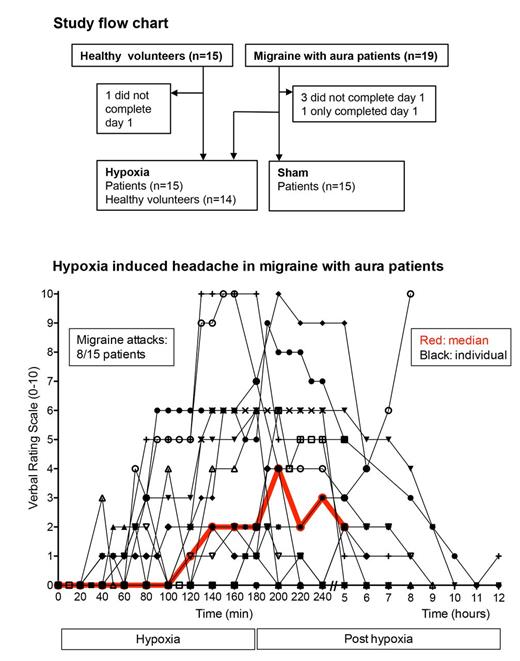
Study design and MRI methods. ( A ) Fifteen of 19 patients with migraine with aura completed both study days (12 females/3 males, mean age 28, range 18–46). Three patients withdrew after Day 1 because of discomfort and logistic problems. Three patients were, due to migraine-like attacks, only able to be exposed to 90, 130 and 140 min (Patients 6, 11, 12) of hypoxia and therefore their vital variables and blood samples were excluded for both study days. Fourteen of 15 control subjects completed the study (11 females/3 males, mean age 28, range 20–45). One healthy volunteer withdrew after 70 min of hypoxia because of discomfort. Data from the excluded participants were not used. ( B ) Study design. ( C ) Absolute concentrations of glutamate, lactate, NAA and total creatine (Cr+PCr) in the visual cortex were measured by 1 H-MRS. ( D ) Circumference of each arterial segment marked in red was measured as the mean of 26 slices. The measurement was excluded if it was not possible to assess at least 12 values. If the contour was distorted or small side branches were included in a measurement, we manually corrected the measurement if possible. If not possible the measurement was excluded from each study day. We included four intra- and four extracranial arteries. The exact same segments of each vessel were identified in each scan using the following starting points: middle cerebral artery (MCA) and the cerebral part of the internal carotid artery (ICA cerebral ): from their branch off from the main trunk of the ICA; basilar artery (BA): from the point where the basilar artery divides into the two posterior cerebral arteries; cavernous part of the internal carotid artery (ICA cavernous ): from the point where the internal carotid artery exits the skull bone to enter the intracranial cavity, before the cavernous sinus; middle meningeal artery (MMA): from the branch off from the main trunk of the maxillary artery, external carotid artery (ECA): from the point were the external carotid artery divides into the maxillary artery and the superficial temporal artery; cervical part of the internal carotid artery (ICA cervical ) and the superficial temporal artery (STA): their starting point was identified with the ipsilateral start of the middle meningeal artery as reference. MA = migraine with aura; Glu = glutamate; Lac = lactate.
Participants arrived at the laboratory (free of headache) at the same time on each study day (± 2 h). Arrival time for the controls was individually matched to the migraine patients (± 2 h) . Participants were not allowed to consume coffee, tea, cocoa, alcohol or other methyl xanthine-containing food or beverages 12 h before the start of the study days. The study was postponed if the participant had had a migraine attack within 5 days or any headache 48 h before the study days. Female participants did not menstruate within 2 days before or after the study days.
The participants were supine and a catheter was inserted in the antecubital vein for blood sampling. We obtained 1 H-MRS, MRA and anatomical T 1 images at baseline, during inhalation (MRA at 120 min, 1 H-MRS at 180 min) and finally 1 H-MRS and T 1 images after inhalation at 240 min ( Fig. 1 ). The participants continuously breathed through the mask during 0–180 min including during the MRI scans by the use of extended tubes. The participants were questioned about headache, associated symptoms, adverse events and premonitory symptoms every 20 min until 240 min after the beginning of the inhalation period. If a participant reported headache, this question interval was changed to every 10 min. We monitored SpO 2 , ECG, blood pressure, heart rate, and end-tidal CO 2 tension (Veris Monitor, Medrad) at baseline and then every 20 min from 0 to 180 min. We collected blood samples to determine potassium, sodium, haemoglobin, glucose and lactate levels at baseline and after 180 and 240 min (blood gas analyser, Radiometer). After the baseline scan and after 180 min, the subjects were offered a standard small meal (bread with soft cream cheese, grapes, banana and water). During the first 80 min of inhalation of the test gas, participants could choose to be supine or sitting. One hour after the end of inhalation, the participants were discharged and instructed to complete a validated headache diary for the next 8 h ( Fig. 1 ). All MRI images were analysed blind.
Hypoxia
Hypoxia was induced by an AltiTrainer system (SMTEC) through a 7-m tube, a one-way valve and a tight fitting full-face mask (Hans Rudolph) . A physician (N.A.) regulated the concentration of nitrogen and oxygen in the inspired air to obtain and maintain a SpO 2 of ∼70–75%. In a blinded fashion the AltiTrainer was either connected to a gas bottle with atmospheric air (sham day) or nitrogen (100% purity, Strandmoellen) mixed with atmospheric air from the room (hypoxia day). The participants and one investigator (J.B.) were blinded to the content of the inhaled air . SpO 2 was measured continuously using a fingertip pulse oximeter (Veris Monitor, Medrad) and monitored by the unblinded investigator (N.A.) on an external screen in the MRI control room not visible to the blinded investigator (J.B.). The arm and hand on the monitored side were covered by a towel to ensure good perfusion of the fingers. The severity and duration of hypoxia in this study was based on earlier studies and entails no risk in healthy subjects ( Pialoux et al. , 2009 ; Wilson et al. , 2011 ; Overgaard et al. , 2012 ).
Headache and migraine-like criteria
The participants were informed of possible headache inducing effects of hypoxia with no information of possible timing and character of symptoms. A blinded investigator (J.B.) obtained data on headache characteristics [intensity, quality (throbbing or pressing), pain location and pain aggravation by physical activity], aura symptoms (visual, sensory or speech symptoms), associated symptoms (nausea, photophobia and phonophobia), and adverse events (palpitations, heat feeling, dizziness and flushing). Headache intensity was recorded on a verbal rating scale (VRS) from 0 to 10, in which 0 is no headache, 1 is a very mild headache (including a feeling of pressing or throbbing pre-pain) and 10 is the worst imaginable headache. Headache ≥4 was classified as moderate-to-severe headache intensity. In addition, patients were asked whether headache and aura symptoms mimicked their usual attacks. The participants were also asked to complete a headache diary every hour from 4 until 12 h after the beginning of inhalation of the test gas ( Fig. 1 ) and were allowed to treat headache with common analgesics and their usual migraine medication. Two blinded laboratory technicians (L.E. and W.G.) extracted and double-checked headache data from questionnaires and diaries into Excel data files.
Headache induced by provocation cannot completely fulfil the International Classification of Headache Disorders 3 beta (ICHD-3 beta, 2013 ) for migraine that requires the migraine attack to be spontaneous. Furthermore, the attack should last at least 4 h if the attack is untreated. In provocation studies participants must be allowed to take treatment although all migraine criteria may not be fulfilled. Most spontaneous migraine attacks develop over hours, with an initiation phase that fulfils only the criteria for tension-type headache. We therefore, as in earlier migraine-provocation studies ( Hansen et al. , 2010 ; Schytz et al. , 2010 ), used the following two criteria for a migraine-like attack:
Migraine-like attacks fulfilling either (1) or (2):
Headache fulfilling criteria C and D for migraine without aura (ICHD-3 beta, 2013 ).
Headache described as mimicking usual migraine attack and treated with a triptan.
In the present study, migraine-like attacks were also defined as:
Attacks fulfilling to criteria B–C for migraine with typical aura:
(B) One or more of the following fully reversible aura symptoms: visual, sensory, speech and/or language, motor, brainstem, retinal.
(C) At least two of the following four characteristics:
at least one aura symptom spreads gradually ≥5 min, and/or two or more symptoms occur in succession.
each individual symptom lasts 5–60 min.
at least one aura symptom is unilateral.
the aura is accompanied, or followed within 60 min, by headache.
Magnetic resonance spectroscopy
We used a 3.0 T Philips Achieva MRI scanner (Philips Medical Systems) with a 32-element phased-array receiver head coil. 1 H-MRS measured the concentration of glutamate, lactate, N -acetyl aspartate (NAA) and total creatine (i.e. phoshopcreatine and creatine) ( Fig. 1 ). A water suppressed point-resolved spectroscopy (PRESS) pulse sequence was used with repetition time 5000 ms; echo time 36.5 ms; voxel size 30 mm ×35 mm × 30 mm (31.5 mm 3 ); 128 acquisitions; total duration 13 min 8 s. The water signal was used as internal standard for quantification ( Christiansen et al. , 1993 ). The voxel was located in the visual cortex ( Fig. 1 ). Signal from fat has the same frequencies as lactate and could confound quantification of the lactate peak. To avoid signal from subcutaneous fat, the entire voxel was located inside brain tissue. Data post-processing and quantification of the spectra was done with LCModel (Version 6.3-1F). Measurements where lactate were not detected and abnormal spectra were excluded by a blinded investigator (M.V.).
Magnetic resonance angiography
A single-slab 3D time-of-flight (3D TOF) MRA of extra- and intracranial arteries was acquired as described in previous studies ( Amin et al. , 2013 , 2014 ). MRA data were analysed by LKEB-MRA vessel wall analysis software program (version 6.2007). The investigators (N.A. and F.M.A.) who performed the analyses were blinded to the experimental day and scan session. The intracranial arteries included one extracerebral segment: the cavernous internal carotid artery, and three intracerebral segments: the middle cerebral artery, basilar artery and the cerebral internal carotid artery. The extracranial vessel segments included the external carotid artery, superficial temporal artery, middle meningeal artery and cervical internal carotid artery. For each arterial measurement, we obtained an average of 26 values (i.e. 5-mm long vessel segments) ( Fig. 1 ).
Anatomical T 1 scan
We performed a high-resolution anatomical scan with a 3D T 1 -weighted turbo field echo sequence (field of view 256 ×256 × 170 mm 3 ; voxel size 1.067 × 1.067 × 1.000 mm 3 ; echo time 4.604; repetition time 9.0 ms; echo train length 200; flip angle 8°). All anatomical scans were seen by a radiologist (F.W.) to exclude any pathology.
Statistical analysis
All absolute values are presented as mean ± standard deviation (SD), except headache scores, 1 H-MRS values and blood samples, which are presented as median values. Angiography data are presented as percentage changes with a 95% confidence interval (CI). Baseline was defined as t 0 before the start of inhalation.
Sample size was based on previous migraine-provocation studies performed by our group showing migraine incidence of 60–80% after pituitary adenylate cyclase activating peptide-38, calcitonin gene-related peptide, and the nitric oxide donor glyceryl-trinitrate ( Schytz et al. , 2010 ).
The endpoints were differences between hypoxia and sham in patients (primary endpoints) and between patients and controls (secondary endpoints) for the following data: (i) incidence in migraine-like attacks and headache during inhalation (0–180 min); (ii) area under the curve (AUC) for headache score during inhalation (0–180 min); (iii) changes from baseline in glutamate, lactate, total creatine, and NAA concentrations in the visual cortex at 180 and 240 min; and (iv) changes from baseline in circumference of the intra- and extracranial arteries between hypoxia and sham at 120 min.
Additional secondary endpoints were differences between hypoxia and sham in patients and between patients and controls for the following data: (i) AUC (0–180 min) for SpO 2 , heart rate, mean arterial pressure, and end-tidal CO 2 tension; (ii) change from baseline of venous blood concentrations of haemoglobin, potassium, lactate and glucose; and (iii) incidence of adverse events.
Incidence of migraine/headache/aura and adverse events were analysed as binary categorical data with McNemar’s test to compare hypoxia and sham in patients. For comparison of patients and controls we performed Pearson’s chi-square test. We calculated AUC according to the trapezium rule to obtain a summary measure and to analyse the difference in response between hypoxia and sham and between patients and controls. Baseline was subtracted before calculating AUC to reduce within participant variation between sessions. Changes from baseline of 1 H-MRS metabolites, arterial circumference and blood samples, AUC of vital variables and baseline differences of all variables between hypoxia and sham and arterial circumference side-to-side difference, before and after inhalation were compared using the non-parametric Wilcoxon signed rank test. Differences between patients and controls were compared by the Mann-Whitney test.
All analyses were performed with SPSS version 19.0. We made no adjustment for multiple analyses. Five per cent ( P < 0.05) was accepted as the level of significance.
Results
Fifteen patients with migraine with aura [12 females, mean age 28 (range 18–46), mean body mass index 22 kg/m 2 (range 19–26)] and 14 controls [11 females, mean age 28 (range 20–45), mean body mass index 25 kg/m 2 (range 20–34)] completed both study days ( Fig. 1 ). There were no differences in any variables at baseline between hypoxia and sham days or between patients and controls except the baseline circumference of cervical internal carotid artery, which was larger in controls [16.08 mm (SD 1.03 mm) versus 14.80 mm (SD 1.59 mm), P = 0.014)].
Migraine
Eight patients (53%) experienced migraine-like attacks during hypoxia inhalation in comparison to one (7%) during sham procedure ( P = 0.039) and one in the control group (7%) ( P = 0.007). Three attacks fulfilled the migraine with aura criteria and seven the migraine without aura criteria during hypoxia ( Table 1 ). Furthermore, four patients (27%) experienced a short period of uncharacteristic visual disturbances, three during hypoxia and one after hypoxia ( Table 2 ). During hypoxia median time to onset of migraine-like attacks was 105 min (range 60–180 min) and median duration of the attack was 6 h (range 2–11 h).
Characteristics of migraine-like attacks and headache during inhalation (0–180 min)
| Patient ID | Headache characteristics a | Associated symptoms b | Visual disturbances | Mimics usual migraine | Migraine-like attack onset | Treatment (time)/efficacy c |
|---|---|---|---|---|---|---|
| Patients: hypoxia | ||||||
| 1 | Right/6/throbbing/+ | +/+/+ | No d | Yes | 80 min | Sumatriptan 100 mg, ibuprofen 600 mg (4 h)/yes |
| 4 | Right/7/throbbing /+ | +/-/+ | Yes | Yes | 150 min | Metoclopramide 20 mg (200 min)/yes Sumatriptan 6 mg, paracetamol 1 g, Dolol® 100 mg (4 h)/yes |
| 6 | Left/10/throbbing /+ | +/+/+ | Yes | Yes | 70 min | Sumatriptan 6 mg (140 min)/yes |
| 7 | Bilateral/2/pressing/+ | -/-/- | Yes | Yes | 180 min e | Metoclopramide 20 mg, ibuprofen 400 mg, paracetamol 1 g (4 h)/ND |
| 8 | Bilateral/6/pressing/+ | +/+/+ | No | Yes | 130 min | Metoclopramide 20 mg (130 min)/no Ibuprofen 400 mg, paracetamol 1 g (4 h)/no |
| 9 | Left/2/pressing/+ | +/-/+ | No | Yes | 60 min | |
| 11 | Right/6/throbbing /+ | +/-/+ | Yes | Yes | 130 min | |
| 12 | Right/10/pressing/+ | +/-/+ | Yes | Yes | 80 min | Sumatriptan 6 mg, paracetamol 1 g (210 min)/yes |
| Patients: sham | ||||||
| 2 | Right/2/pressing/+ | -/-/+ | None | Yes | 110 min | |
| Controls: hypoxia | ||||||
| 11 | Right/1/pressing/+ | -/-/+ | No | NA | 180 min | Paracetamol 1 g (5 h)/yes |
a Localization/intensity/quality/aggravation by movement.
b Photophobia/phonophobia/nausea.
c Pain relief ≥50% within 2 h.
d Patient experienced visual disturbances at 240 min.
e Patient fulfilled the migraine-like criteria for migraine with aura at 180 min and migraine without aura from 200 min.
ND = not determined; NA = not applicable.
Visual and sensory disturbances
| Patient ID | Onset | Duration | GS | Localization | Description | Headache onset | Mimics usual aura | Fulfil aura criteria |
|---|---|---|---|---|---|---|---|---|
| Patients: hypoxia | ||||||||
| 7 | 173 min | Visual | Yes | Central right upper quadrant | Scotoma and flickering | 180 min | No a | Yes |
| 30 min | ||||||||
| 11 | 130 min | Visual | Yes | Central upper quadrants right hemifield | Flickering | 120 min | Yes | Yes |
| 130 min | ||||||||
| 12 | 78 min | Visual (119 min) | Yes | Right hemifield central upper quadrants Fingers right side hand upper arm | Flickering, black spots Numbness and tingling | 40 min | Yes | Yes |
| Sensory (55 min) | ||||||||
| 1 | 4 h | Visual | No | Left and right lower quadrant | Blurred vision | 60 min | No | Possible |
| 10 min | ||||||||
| 2 | 170 min | Visual | No | Diffuse in visual field | ‘Worms’ | 170 min | No | Possible |
| 10 min | ||||||||
| 4 | 80 min | Visual | No | Central | Blurred vision | 40 min | No | Possible |
| 20 min | ||||||||
| 6 | 80 and 130 min | Visual | No | Diffuse in visual field | Blurred distant vision | 70 min | Yes, some attacks | Possible |
| 2 × 30 min | ||||||||
| Patients: sham | ||||||||
| 2 | 4 h | Visual | Yes | Central, right hemifield, left upper quadrant | Scotoma and flickering | 40 min | Yes | Yes |
| 46 min | ||||||||
| Controls: hypoxia | ||||||||
| 8 | 160 min | Visual | No | Central | Difficulty focusing | 100 min | NA | NA |
| 10 min | ||||||||
| 13 | 60 min | Visual | No | Diffuse in visual field | Small black spots | 120 min | NA | NA |
| 10 min | ||||||||
a Patient’s aura is usually a scotoma without flickering in the left side of the visual field.
GS = gradually spreading ≥ 5 min; NA = not applicable.
One patient reported migraine without aura during sham procedure and 4 h after start of sham procedure the patient reported aura symptoms. Furthermore, two patients experienced migraine without aura-like attacks 5 and 8 h after initiation of sham procedure.
One healthy volunteer experienced migraine-like headache after 180 min hypoxia inhalation ( Table 1 ). Two healthy volunteers experienced a short period of uncharacteristic visual disturbances during hypoxia ( Table 2 ).
Magnetic resonance spectroscopy
In patients, we found no changes of glutamate, total creatine or NAA concentrations in the visual cortex during hypoxia compared to sham ( P > 0.05). Lactate increased by 61% (CI 13–108%) during hypoxia and by 7% (CI–21–35%) during sham ( P = 0.028). There were no changes in any of the metabolites at 240 min ( P > 0.05) ( Fig. 2 and Table 3 ).
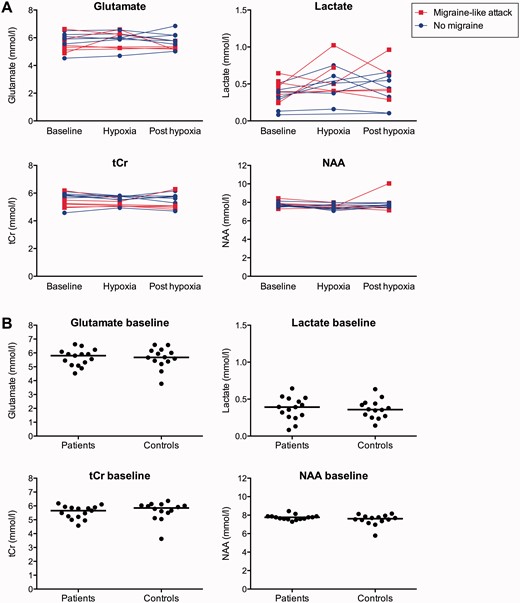
MRS. ( A ) 1 H-MRS measurements on hypoxia day in patients with migraine with aura (migraine-like attack versus no attack) and ( B ) at baseline in patients and controls. The flat lines represent median values.
1 H-MRS and venous blood samples
| Metabolite | Subjects | Baseline (mM) | P | 180 min (mM) | P | 240 min (mM) | P |
|---|---|---|---|---|---|---|---|
| 1 H-MRS | |||||||
| Lactate | Controls | 0.36 (0.26–0.44) | 0.777 | 0.51 (0.42–0.65) | 0.818 | 0.40 (0.29–0.57) | 0.537 |
| Patients hypoxia | 0.39 (0.26–0.51) | 0.281 | 0.51 (0.39–0.74) | 0.028 | 0.43 (0.30–0.63) | 0.638 | |
| Patients sham | 0.33 (0.23–0.44) | 0.39 (0.21–0.52) | 0.40 (0.22–0.49) | ||||
| Glutamate | Controls | 5.68 (5.33–6.18) | 0.793 | 5.83 (5.36–6.06) | 0.103 | 5.90 (5.11–6.20) | 0.877 |
| Patients hypoxia | 5.80 (5.12–6.09) | 0.177 | 6.01 (5.88–6.28) | 0.374 | 5.65 (5.21–6.07) | 0.937 | |
| Patients sham | 5.89 (5.42–6.12) | 5.73 (5.55–6.30) | 5.71 (5.08–6.32) | ||||
| Total creatine | Controls | 5.85 (5.41–6.05) | 0.275 | 5.38 (5.09–5.87) | 0.586 | 5.64 (5.24–5.95) | 0.918 |
| Patients hypoxia | 5.66 (5.21–6.89) | 0.173 | 5.53 (5.08–5.77) | 0.110 | 5.46 (5.00–5.79) | 0.937 | |
| Patients sham | 5.62 (5.26–5.98) | 5.78 (5.32–5.99) | 5.50 (5.31–5.77) | ||||
| NAA | Controls | 7.61 (7.30–7.87) | 0.239 | 7.60 (6.93–8.18) | 0.703 | 7.73 (7.37–8.05) | 0.328 |
| Patients hypoxia | 7.77 (7.58–7.88) | 0.053 | 7.47 (7.29–7.78) | 0.131 | 7.68 (7.49–7.93) | 1.0 | |
| Patients sham | 7.91 (7.54–8.18) | 7.89 (7.60–8.09) | 7.76 (7.40–8.16) | ||||
| Venous blood samples | |||||||
| Lactate | Controls | 0.83 (0.60–1.21) | 1.00 | 1.18 (1.03–1.39) | 0.411 | 0.80 (0.60–0.99) | 0.018 |
| Patients hypoxia | 0.85 (0.59–1.20) | 0.593 | 1.20 (0.70–2.03) | 0.008 | 1.10 (0.68–1.53) | 0.012 | |
| Patients sham | 0.95 (0.75–1.14) | 0.90 (0.58–1.15) | 0.80 (0.63–0.90) | ||||
| Haemoglobin | Controls | 7.90 (7.41–8.46) | 0.356 | 8.43 (7.95–8.80) | 0.243 | 8.33 (7.73–8.68) | 0.526 |
| Patients hypoxia | 8.10 (7.80–8.70) | 0.366 | 8.30 (8.00–9.23) | 0.028 | 8.25 (7.88–9.23) | 0.138 | |
| Patients sham | 8.10 (7.73–8.55) | 7.90 (7.90–8.55) | 8.05 (7.80–8.70) | ||||
| Potassium | Controls | 3.80 (3.70–3.96) | 0.590 | 3.43 (3.29–3.60) | 0.929 | 3.50 (3.40–3.75) | 0.556 |
| Patients hypoxia | 3.90 (3.70–3.98) | 0.812 | 3.50 (3.29–3.59) | 0.021 | 3.60 (3.58–3.68) | 0.675 | |
| Patients sham | 3.95 (3.75–4.00) | 3.78 (3.68–3.83) | 3.63 (3.58–3.71) | ||||
| Glucose | Controls | 4.78 (4.29–5.11) | 0.520 | 4.80 (4.38–5.34) | 0.156 | 4.98 (4.61–5.43) | 0.044 |
| Patients hypoxia | 4.88 (4.55–5.15) | 0.333 | 5.35 (4.78–5.80) | 0.035 | 5.65 (5.25–6.87) | 0.036 | |
| Patients sham | 5.10 (4.60–5.70) | 4.88 (4.54–5.06) | 5.00 (4.50–5.85) | ||||
Median concentration (range) at baseline, 180 min and 240 min. P -values are for comparison of baseline values and changes from baseline in patients during hypoxia and after hypoxia compared to sham (Wilcoxon signed rank test) and between patients and controls at baseline, during hypoxia and after hypoxia (Mann-Whitney test). The bold P -values indicate statistical significance. Due to migraine, discomfort, insufficient data quality, n for each spectroscopy measurement was reduced to the following: patients, at 180 min, glutamate, total creatine and NAA: n = 11, lactate: n = 9; patients, at 240 min, all metabolites: n = 12; controls, at 180 min and 240 min, glutamate, total creatine and NAA: n = 13, lactate: n = 11. At 240 min three patients were scanned after medication (Patient 4: 15 min after 20 mg primperan sup; Patient 6: 122 min after 6 mg sumatriptan subcutaneously; Patient 8: 90 min after 20 mg Primperan suppository).
Due to migraine, discomfort, problems with intravenous access and blood gas analyser machine errors, n for each blood samples was reduced to the following: patients, at 180 min and 240 min, lactate and haemoglobin: n = 9, glucose: n = 8, potassium: n = 10. There were no missing values for blood samples from the controls ( n = 14). mM = mmol/l.
In controls, we found no changes of glutamate, total creatine or NAA concentration ( P > 0.05). Lactate concentration increased by 56% (CI 4–108%) during hypoxia compared to baseline ( P = 0.037). There were no differences between patients and controls in the change of glutamate, lactate, total creatine or NAA at 180 min ( P > 0.05) or at 240 min after hypoxia ( P > 0.05; Table 3 ).
Magnetic resonance angiography
There was no difference in the change from baseline to hypoxia in arterial circumference of intra- or extracranial arteries between the right and the left side ( P > 0.05) . We therefore used an average of the left and right arteries.
In patients, the circumference of all intracranial arteries increased during hypoxia compared to sham ( P < 0.05) ( Fig. 3 A). In controls, the circumference of all intracranial arteries also increased from baseline during hypoxia ( P < 0.05; Fig. 3 A). There was no difference between patients and controls in change of arterial circumference during hypoxia ( P > 0.05).
![Circumference change of intra- and extra-cranial arteries. Per cent changes (95% CI) from baseline in mean circumference of intracranial ( A ) and extracranial ( B ) arteries after 120 min inhalation. ( A ) There was a significant increase of circumference of all intracranial arteries in patients [middle cerebral artery (MCA), n = 14, P = 0.011; cerebral internal carotid artery (ICA cerebral ), n = 14, P = 0.001; cavernous internal carotid artery (ICA cavernous ), n = 15, P = 0.002; basilaris (BA), n = 15, P = 0.001] and in controls (middle cerebral artery, n = 14, P = 0.001; cerebral internal carotid artery, n = 14, P = 0.001; cavernous internal carotid artery, n = 14, P = 0.002; basilaris, n = 14, P = 0.001). There were no differences between patients and controls in the circumference change during hypoxia (middle cerebral artery, P = 0.183; cerebral internal carotid artery, P = 0.550; cavernous internal carotid artery, P = 0.513, basilaris, P = 0.743). ( B ) In patients, the circumference change during hypoxia was larger for all extracranial arteries [external carotid artery (ECA), n = 14, P = 0.016; cervical internal carotid artery, n = 10, P = 0.002; superficial temporal artery (STA), n = 10, P = 0.041] except of the middle meningeal artery (MMA, n = 12, P = 0.060). In controls, the circumference of all extracranial arteries increased from baseline during hypoxia (external carotid artery, n = 12, P = 0.002; cervical internal carotid artery, n = 14, P = 0.001; middle meningeal artery, n = 14, P = 0.002; superficial temporal artery, n = 14, P = 0.004). The circumference change of the cervical internal carotid artery during hypoxia in controls [2.38 mm (SD 0.77 mm)] was larger compared to patients [1.81 (SD 0.44 mm), P = 0.019]. There was no difference between patients and controls in the circumference change of the other extracranial arteries (external carotid artery, P = 0.190; middle meningeal artery, P = 0.181; superficial temporal artery, P = 0.520). The following data were excluded due to bilaterally distorted contour of the artery segment: patients, middle cerebral artery (Patient 11), cerebral internal carotid artery (Patient 12), external carotid artery (Patient 14), cervical internal carotid artery (Patients 10 and 15), superficial temporal artery (Patients 3 and 10); controls: external carotid artery (Patient 4). Furthermore external carotid artery was excluded in one patient (Patient 7) and one control (Patient 3) because the measured segments were too short bilaterally, and in another control (Patient 5) because of movement artefact. Two patients (Patients 6 and 12) did not complete the middle meningeal artery scan because of migraine. The middle meningeal artery scan of one patient (Patient 7) was excluded because it did not include the relevant artery segments. Error bars represent 95% CI. * P -values < 0.05 for comparison of absolute changes during hypoxia compared to sham in patients and between patients and controls during hypoxia.](https://oup.silverchair-cdn.com/oup/backfile/Content_public/Journal/brain/139/3/10.1093_brain_awv359/2/m_awv359f3p.jpeg?Expires=1716397333&Signature=j6YE34~s5B2SyW4kM6dDeEFXnRKwnhOTDIrgTdFs9pjvgYqCMvN67jiLaZ2JbzbtrNtByhIGCyfM2osN~~BFql7n1MwpQ2275FbV3XZEzfk1~-jmk0j4JGEk7FjZf8JqgZE1C6caELWNlUTXosfP931RBdQzDpXhGni8zcua00-GBlBvzihOaIqnzvWeYR5G9EpK9i~xF6Va82W3wVjlaD6CPVScxviJu-iyS4TY6gZDsVF9sB6nYZ5mFaH6rf8mcUqgErg2qINtfpXi72Cv8iSJclTwL5o50pYlDarLIhOr6sQzkgYW48eHKREVRcZPBju7td~76kiwz-Dq2gPZJQ__&Key-Pair-Id=APKAIE5G5CRDK6RD3PGA)
Circumference change of intra- and extra-cranial arteries. Per cent changes (95% CI) from baseline in mean circumference of intracranial ( A ) and extracranial ( B ) arteries after 120 min inhalation. ( A ) There was a significant increase of circumference of all intracranial arteries in patients [middle cerebral artery (MCA), n = 14, P = 0.011; cerebral internal carotid artery (ICA cerebral ), n = 14, P = 0.001; cavernous internal carotid artery (ICA cavernous ), n = 15, P = 0.002; basilaris (BA), n = 15, P = 0.001] and in controls (middle cerebral artery, n = 14, P = 0.001; cerebral internal carotid artery, n = 14, P = 0.001; cavernous internal carotid artery, n = 14, P = 0.002; basilaris, n = 14, P = 0.001). There were no differences between patients and controls in the circumference change during hypoxia (middle cerebral artery, P = 0.183; cerebral internal carotid artery, P = 0.550; cavernous internal carotid artery, P = 0.513, basilaris, P = 0.743). ( B ) In patients, the circumference change during hypoxia was larger for all extracranial arteries [external carotid artery (ECA), n = 14, P = 0.016; cervical internal carotid artery, n = 10, P = 0.002; superficial temporal artery (STA), n = 10, P = 0.041] except of the middle meningeal artery (MMA, n = 12, P = 0.060). In controls, the circumference of all extracranial arteries increased from baseline during hypoxia (external carotid artery, n = 12, P = 0.002; cervical internal carotid artery, n = 14, P = 0.001; middle meningeal artery, n = 14, P = 0.002; superficial temporal artery, n = 14, P = 0.004). The circumference change of the cervical internal carotid artery during hypoxia in controls [2.38 mm (SD 0.77 mm)] was larger compared to patients [1.81 (SD 0.44 mm), P = 0.019]. There was no difference between patients and controls in the circumference change of the other extracranial arteries (external carotid artery, P = 0.190; middle meningeal artery, P = 0.181; superficial temporal artery, P = 0.520). The following data were excluded due to bilaterally distorted contour of the artery segment: patients, middle cerebral artery (Patient 11), cerebral internal carotid artery (Patient 12), external carotid artery (Patient 14), cervical internal carotid artery (Patients 10 and 15), superficial temporal artery (Patients 3 and 10); controls: external carotid artery (Patient 4). Furthermore external carotid artery was excluded in one patient (Patient 7) and one control (Patient 3) because the measured segments were too short bilaterally, and in another control (Patient 5) because of movement artefact. Two patients (Patients 6 and 12) did not complete the middle meningeal artery scan because of migraine. The middle meningeal artery scan of one patient (Patient 7) was excluded because it did not include the relevant artery segments. Error bars represent 95% CI. * P -values < 0.05 for comparison of absolute changes during hypoxia compared to sham in patients and between patients and controls during hypoxia.
In patients, the circumference of all extracranial arteries increased during hypoxia compared to sham ( P < 0.05), except the circumference of the middle meningeal artery ( P = 0.060) ( Fig. 3 B). In controls, the circumference of all extracranial arteries also increased from baseline during hypoxia ( P < 0.05). Compared to patients, the absolute circumference change of the cervical internal carotid artery in controls during hypoxia was larger [2.38 mm (SD 0.77 mm) versus 1.81 mm (SD 0.44 mm), P = 0.019]. However, explorative analysis of the relative circumference changes showed no difference between controls [15% (CI 12–17%)] and patients [12% (CI 12–17%) ( P = 0.198)]. There was no difference between the two groups in the circumference change of the other extracranial arteries ( P > 0.05).
Vital variables
During hypoxia the participants reached a mean SpO 2 of 72% (SD 4.76%) at a mean inspiratory oxygen content of 11% (SD 1.27%), equivalent to an altitude of ∼4700 m ( Fig. 4 ).
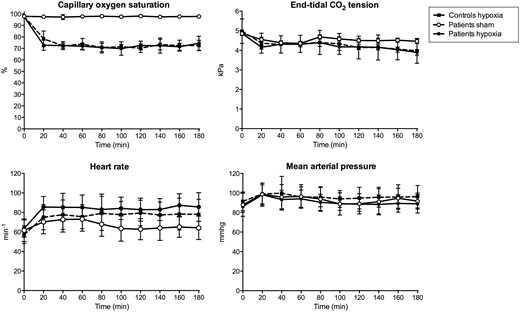
Vital variables during hypoxia and sham procedure. In patients, during hypoxia compared to sham, heart rate was higher (AUC 0–180 min , P = 0.002) and SpO 2 (AUC 0–180 min , P = 0.002) and end-tidal CO 2 tension (AUC 0–180 min , P = 0.004) were lower and there was no difference of AUC 0–180 min of mean arterial pressure ( P = 0.722). There was no difference between the patients and controls in AUC 0–180 min during hypoxia of heart rate ( P = 0.572), SpO 2 ( P = 0.700), mean arterial pressure (0.537) or end-tidal CO 2 tension ( P = 0.837).
In patients, during hypoxia compared to sham the AUC 0–180 min was higher for heart rate ( P = 0.002), whereas SpO 2 ( P = 0.002) and end-tidal CO 2 tension ( P = 0.004) was lower and there was no difference in AUC 0–180 min of mean arterial pressure ( P = 0.722). There was no difference between patients and controls during hypoxia in AUC 0–180 min for heart rate, SpO 2 , mean arterial pressure or end-tidal CO 2 tension ( P > 0.05).
Blood samples
Baseline venous blood samples showed normal potassium, sodium and haemoglobin levels on both study days.
In patients, the venous lactate ( P = 0.008), glucose ( P = 0.035) and haemoglobin ( P = 0.028) increased and potassium ( P = 0.021) decreased during hypoxia compared to sham ( Table 3 ). At 240 min after hypoxia compared to sham, lactate ( P = 0.012) and glucose ( P = 0.036) were still increased, whereas no changes of haemoglobin ( P = 0.138) and potassium ( P = 0.675) were observed.
There was no difference between the patients compared to controls in the change of haemoglobin, potassium, glucose or lactate during hypoxia ( P > 0.05) ( Table 3 ). At 240 min after hypoxia, the lactate ( P = 0.016) and glucose ( P = 0.044) changes were larger in patients compared to controls.
Headache and adverse events
Thirteen patients experienced headache after hypoxia in comparison to five patients after sham ( P = 0.039) ( Fig. 5 and Supplementary Table 1 ). AUC 0–180 min for headache score was higher during hypoxia compared to sham ( P = 0.018).
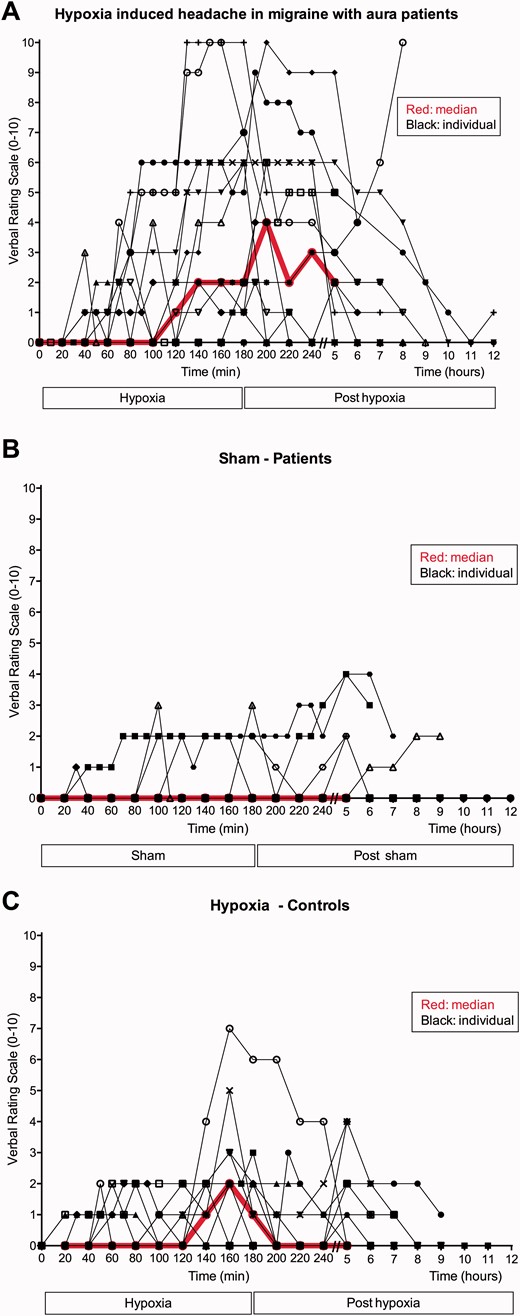
Headache score. Individual and median (red line) headache score after hypoxia ( A ) and sham ( B ) in patients with migraine with aura and after hypoxia in controls ( C ). The median curve is only showed from 0–5 h because most participants went to sleep early after the study and we therefore only have headache scores for all participants from 0–5 h.
Eleven controls experienced headache during hypoxia ( Fig. 5 ). The headaches were predominately bilateral and pressing ( Supplementary Table 2 ). There was no difference in headache incidence ( P = 0.564) or AUC for headache score ( P = 0.182) during hypoxia in patients compared to controls. Explorative analysis revealed that the AUC 180–300 min for headache score was larger after hypoxia inhalation in patients compared to controls ( P = 0.016).
In patients during hypoxia compared to sham the incidence of nausea ( P = 0.004), photophobia ( P = 0.008), dizziness ( P = 0.002), and palpitations ( P = 0.031) were increased. There was no difference during hypoxia compared to sham in incidence of phonophobia, heat sensation or flushing ( P > 0.05). The incidence of photophobia was higher in patients compared to controls during hypoxia ( P = 0.001). There was no group difference in incidence of other adverse events during hypoxia ( P > 0.05).
Discussion
The major finding of this study was that normobaric hypoxia induced migraine in 8 of 15 (53%) patients with migraine with aura (three patients reported migraine with aura, and five patients reported migraine without aura). Hypoxia did not change glutamate levels in the visual cortex, but increased lactate levels and dilated cranial arteries. Furthermore, we found no difference in the metabolic or vascular responses to hypoxia between patients and controls. The migraine-inducing effects of hypoxia may explain similarities between headache characteristics in acute mountain sickness and migraine headache (ICHD-3 beta, 2013 ) and some efficacy of sumatriptan in acute mountain sickness ( Bärtsch et al. , 1994 ; Jafarian et al. , 2007 ). Furthermore, migraine is an independent risk factor for high altitude headache ( Mairer et al. , 2009 ; Burtscher et al. , 2011 ).
Previous attempts to trigger aura with self-reported triggers ( Hougaard et al. , 2013 ) and known pharmacological migraine triggers have failed ( Christiansen et al. , 1999 ; Afridi et al. , 2004 ; Hansen et al. , 2010 ). Few patients reported aura after exposure to light and exercise (11%) ( Hougaard et al. , 2013 ), glyceryl trinitrate (0–10%) ( Christiansen et al. , 1999 ; Afridi et al. , 2004 ) and calcitonin gene-related peptide (28%) ( Hansen et al. , 2010 ). Hypoxia may be directly involved in induction of cortical spreading depression as shown in vivo ( Takano et al. , 2007 ) and in vitro ( Mané and Müller, 2012 ). Furthermore, animal studies show that hypoxia lowers the threshold for cortical spreading depression ( Takano et al. , 2007 ) and increases the duration of cortical spreading depression ( Takano et al. , 2007 ; Sonn and Mayevsky, 2012 ). Schoonman et al. (2006) exposed a mixed group of migraine patients to 75–80% (SpO 2 ) hypoxia (obtained SpO 2 data not shown) for up to 5 h and provoked migraine without aura-like attacks in 6 of 14 (43%) patients ( P = 0.197). The study included seven patients with migraine with aura and hypoxia-provoked migraine without aura-like attacks in three of these seven patients (43%) compared to two after sham (29%). In the present study, we included only patients with migraine with aura ( n = 15), exposed them to severe hypoxia (mean SpO 2 72%; Fig. 4 ) and investigated them with 1 H-MRS and MRA. We found that hypoxia provoked migraine ( P = 0.039), three patients developed migraine aura during hypoxia and a further four of the patients experienced uncharacteristic visual disturbances ( Table 2 ). These uncharacteristic visual disturbances technically fulfilled the International Classification of Headache Disorders 3 beta version criteria B–C for migraine with typical aura (ICHD-3 beta, 2013 ) and were accompanied by migraine-like headache in three of the four patients ( Table 1 ). Interestingly, a case study reported spreading cerebral hypoperfusion during such atypical aura-like symptoms followed by migraine-like headache ( Woods et al. , 1994 ). However, we chose to categorize them as ‘possible’ aura, because they lacked the characteristic gradual spread, unilaterality, positive symptoms and did not mimic patients’ usual attacks. Yet, we cannot exclude that these disturbances were atypical auras triggered by hypoxia. Hypoxia may thus induce cortical spreading depression in migraine with aura patients but this likely depends on an individual threshold. The severity of hypoxia seems to be important for the probability to trigger migraine headache and aura. This is supported by our positive findings conducted at lower oxygen level compared to Schoonman’s study in which none of the patients reported aura or any visual disturbances and the incidence of migraine was not significant ( Schoonman et al. , 2006 ). Animal studies showed that the threshold to elicit cortical spreading depression was correlated with the degree of hypoxia ( Takano et al. , 2007 ). In addition, the prevalence of acute mountain sickness increases significantly with increasing height ( Mairer et al. , 2009 ). Furthermore, increased prevalence of migraine was reported in a high-altitude population at 4300 m ( Arregui et al. , 1991 , 1994 ) but not in a population at 3380 m ( Jaillard et al. , 1997 ). The haemodynamic effects of hypoxia also increase with increasing severity of hypoxia ( Wilson et al. , 2011) . In support, Wilson et al. (2011) found dilatation of middle cerebral artery at SpO 2 75% but no changes at SpO 2 80%. Thus, even more severe hypoxia and maybe longer duration of the challenge might have caused more migraine auras in the present study but the present level of hypoxia and duration was judged to be what we could ethically accept. Two healthy volunteers also experienced uncharacteristic visual disturbances during hypoxia ( Table 2 ). The question is whether these visual disturbances may be defined as auras. A case report described two attacks of ‘possible aura’ in a healthy male at 5000 m ( Jenzer and Bärtsch, 1993 ). Our controls had no history of migraine or first-degree relatives with migraine and the visual disturbances were described as difficulty focusing/small black spots without accompanying migraine-like headache. Therefore, we consider it unlikely that these symptoms are related to aura.
Possible migraine-inducing mechanisms of hypoxia
Migraine attacks are associated with a relatively small dilatation of the intracranial arteries ( Amin et al. , 2013 ). In the present study, we showed that all major intra- and extracranial arteries dilated after 2 h of normobaric hypoxia. Nitric oxide is an important molecule in migraine pathophysiology ( Olesen, 2008 ) and may play a role in hypoxia-induced migraine attacks and arterial dilatation. In support, Van Mil et al. (2002) showed that the ‘hypoxia-induced’ cerebral blood flow increase can be reversed by a nitric oxide synthase inhibitor. This study included eight healthy volunteers that were exposed to a 79% (SpO 2 ) hypoxia challenge causing a 21% increase in cerebral blood flow. The cerebral blood flow increase was abruptly reversed to baseline level by intravenous administration of the non-specific nitric oxide synthase inhibitor NG -monomethyl-L-arginine ( Van Mil et al. , 2002 ). Similar to hypoxia, the nitric oxide donor glyceryl-trinitrate induces migraine and dilates intra- and extracranial arteries in humans ( Tvedskov et al. , 2004 ; Hansen et al. , 2007 ). The migraine-inducing mechanism of nitric oxide involves cyclic guanosine monophosphate (cGMP) signalling, which thus may also be involved in hypoxia-induced migraine, possibly through perivascular sensitization ( Olesen, 2008 ). Adenosine, which is increased in the brain during hypoxia ( Winn et al. , 1981 ; Phillis et al. , 1987 ), has also been suggested as a possible mechanism of hypoxic vasodilatation ( O’Regan, 2005 ). In healthy volunteers adenosine induced mild headache and dilatation of superficial temporal artery ( Birk et al. , 2005 ). The possible migraine-inducing effects of adenosine have not been investigated. An arterial supersensitivity to nitric oxide in migraine patients has been described using indirect methods with transcranial Doppler ( Thomsen et al. , 1993 ). We therefore found it interesting to investigate if vascular responses to hypoxia in patients differ from controls. Using the direct MRA method we found no difference in changes of the arterial circumference between patients and controls. These findings question the role of arterial dilatation per se in provoking migraine attacks. However, we cannot exclude that migraine patients are hypersensitive to vasodilatation, as all known migraine-inducing substances are vasodilators ( Schytz et al. , 2010 ).
Glutamate is an important neurotransmitter in migraine pathophysiology ( Ramadan, 2014 ). Topical application of glutamate can trigger cortical spreading depression in animal models ( Fifkova and Van Harreveld, 1974 ) and glutamate receptor antagonists can inhibit induction of cortical spreading depression ( Lauritzen and Hansen, 1992 ). Earlier studies have shown conflicting results of cerebral glutamate levels in migraine patients interictally. Gonzalez de la Aleja et al. (2013) showed increased glutamate/total creatine ratio in the anterior paracingulate cortex in patients with migraine with aura and increased glutamate in the anterior paracingulate cortex in a mixed group of migraine patients with or without aura. Furthermore, two studies included glutamine measurements and showed interictally increased glutamate + glutamine/total creatine ratio in migraine with aura patients ( Siniatchkin et al. , 2012 ) and increased glutamate/glutamine ratio in the visual cortex in a mixed group of migraine with aura and migraine without aura patients ( González de la Aleja et al. , 2013 ). In contrast, two studies found no difference in glutamate levels in the visual cortex between patients with migraine with aura and controls ( González de la Aleja et al. , 2013 ; Bridge et al. , 2015 ). Similar to these two studies, we found no difference in baseline glutamate in the visual cortex between patients with migraine with aura and controls. To our knowledge, cerebral glutamate levels during hypoxia have not previously been investigated in humans. A microdialysis study showed a >400% increase in glutamate levels in the somatosensory cortex of rats after 30 min exposure to hypoxia (mean inspiratory oxygen content: 6%) ( Zoremba et al. , 2007 ). In contrast, a 7 T 1 H-MRS rat study showed no glutamate changes in the hippocampus after 48 h of severe hypobaric hypoxia (6700 m). We showed that 3 h of hypoxia induced no changes in glutamate in the visual cortex in patients with migraine with aura or controls. In a hypothesis-generating analysis we further investigated baseline glutamate concentration in patients who later reported migraine-like attacks with and without aura and found no difference ( Fig. 2 ).
Two interictal 1.5 T MRI studies have reported increased cerebral lactate in patients with migraine with aura ( Watanabe et al. , 1996 ; Sándor et al. , 2005 ). Sándor et al. (2005) found a 31% larger lactate/NAA ratio in the visual cortex in a small group of patients with migraine with aura ( n = 5) compared to healthy volunteers ( n = 11). Similar results were reported by Watanabe et al. (1996) in six patients (three had migraine with aura, one basilar migraine, one migraineous infarction, one prolonged aura/migraineous infarction). However, these studies included very small clinical heterogeneous patient groups and lactate is difficult to measure in the brain and high field strength (≥3 T) is necessary to obtain a reliable quantification. Two studies investigated patients with migraine without aura by 3 T MRI and found no differences between patients and controls ( Reyngoudt et al. , 2010 , 2011 ). In the present study, we found no difference in baseline lactate between patients with migraine with aura and controls using 3 T 1 H-MRS. To ensure that our group size was sufficient, we post hoc calculated required group size based on earlier standard deviations of lactate concentration at 3 T 1 H-MRS ( Edden et al. , 2010 ; Harris et al. , 2013 ). The power calculation showed that 14 subjects in each group would be needed to detect a difference in lactate concentration of 25% at 5% significance level with 90% power. Thus our group size would have been sufficient to detect the difference found in the earlier 1.5 T studies ( Watanabe et al. , 1996 ; Sándor et al. , 2005 ). Only two 3 T 1 H-MRS studies have investigated lactate levels during hypoxia in healthy volunteers ( Edden et al. , 2010 ; Harris et al. , 2013 ). These studies showed that lactate levels increased 20–39% in the visual cortex during mild (SpO 2 = 84%) shortlasting (20–30 min) hypoxia in two small groups ( n = 3–6) ( Edden et al. , 2010 ; Harris et al. , 2013 ). Cerebral lactate or total creatine changes in patients with migraine with aura during hypoxia has not previously been investigated. We showed that 3 h of hypoxia induced lactate increase in the visual cortex by 56–61% in patients and controls. Thus, the increase in cerebral lactate seems to be sustained during longer lasting and more severe hypoxia. We also showed that venous lactate concentration increased by 44% in controls and 59% in patients with migraine with aura. Thus, the increase in cerebral lactate may partly be explained by increased transfer of lactate from the blood into the brain during hypoxia. However, it may also originate from increased cerebral lactate production or decreased cerebral consumption ( Edden et al. , 2010 ; Overgaard et al. , 2012 ; Harris et al. , 2013 ). In patients, the plasma lactate was increased in the post-hypoxic phase (240 min) compared to sham and controls. The question is whether this reflects mitochondrial dysfuntion. Montagna et al. (1988) reported increased plasma lactate levels during exercise in four patients with migraine with prolonged aura and Okada et al. (1998) found increased interictal plasma lactate levels in a mixed group of 14 migraine patients (three with migraine with aura). The mitochondrial hypothesis for migraine is supported by numerous 31 P-MRS studies showing a decreased phosphocreatinine and adenosine triphosphate in the visual cortex of patients with migraine with aura ( Welch et al. , 1989 ; Barbiroli et al. , 1990 , 1992 ; Montagna, 1995 ; Boska et al. , 2002 ). 31 P-MRS found no metabolic changes during hypoxia in healthy volunteers ( Garde et al. , 1995 ; Vidyasagar and Kauppinen, 2008 ). In the present study, we did not observe any difference in changes in plasma lactate levels during hypoxia between patients and controls. In addition, our 1 H-MRS data suggest no mitochondrial dysfunction in patients with migraine with aura. In future studies it would be interesting to compare metabolic changes during hypoxia in patients with migraine with aura and healthy controls using 31 P-MRS.
In line with earlier studies, we found no difference in baseline NAA or total creatine levels in the visual cortex between patients with migraine with aura and controls ( Sándor et al. , 2005 ; Sarchielli et al. , 2005 ; Siniatchkin et al. , 2012 ) and no changes of NAA during hypoxia ( Harris et al. , 2013 ).
Interestingly, plasma glucose was increased in the post-hypoxic phase (240 min) in patients compared to sham and controls. The increased plasma glucose in our patients may support earlier studies suggesting abnormal insulin sensitivity in migraine patients ( Rainero et al. , 2005 ; Cavestro et al. , 2007 ). However, our study design was not optimal to investigate this aspect, as the participants were not fasting.
Strength and limitations of the study
Our study was performed at high MRI field strength (3 T) and included two relatively large groups: a well-defined group of patients suffering from migraine with visual aura in all attacks, taking no preventive medication, no other illness; and a well-matched control group.
A limitation of 1 H-MRS at 3 T in humans is the differentiation between glutamate and glutamine concentration. This means that the glutamate concentration measured in the present study would to some extent include glutamine. It should also be noted that we exclusively focused on visual cortex and did not investigate glutamate levels in other areas of the brain. In the present study, water signal was used as the internal standard for quantification. Hypoxaemia in the brain could potentially change the water content of the brain and confound the quantification of the metabolites during hypoxia. However, the NAA concentration was also measured with water signal as internal standard and did not change during hypoxia. NAA is a marker of neuronal density and should not be affected by a relatively short period of hypoxia. This indicates that the quantification is similar during normoxia and hypoxia.
MRA is a direct and validated ( Amin et al. , 2014 ) method to examine arterial circumference and our results are consistent for the investigated intra- and extracranial arteries. The middle meningeal artery did not increase significantly during hypoxia compared to sham in patients, however a clear trend was observed ( P = 0.060, Fig. 3 B) and there was no difference between the groups ( P = 0.181).
It would have been interesting to compare lactate and glutamate levels and arterial circumference during hypoxia between those who developed attack and those who did not. Because of the group size and missing values, such subdivision was not possible. We presented individual 1 H-MRS data in Fig. 2 A and MRA data in Supplementary Fig. 1 and found no trend in either direction.
Conclusion
In conclusion, hypoxia induced migraine-like attacks in 8 of 15 patients with migraine with aura, migraine aura attacks in three patients and possible aura attacks in an additional four patients. Thus, hypoxia may be used to provoke migraine-like attacks and aura attacks in a subgroup of patients, allowing us to investigate aura and headache mechanisms under controlled conditions. Similar to other migraine triggers, hypoxia induces arterial dilatation. We found no baseline difference in glutamate and lactate concentration in the visual cortex between patients with migraine with aura and healthy volunteers. Furthermore, both groups showed a similar hypoxia-induced increase in lactate and no change in glutamate. The mechanisms behind hypoxia-induced migraine need to be further investigated, especially the possible role of nitric oxide and metabolic changes that can be measured by 31 P-MRS. Considering the increased prevalence of migraine in altitude populations, it would be interesting to investigate hypobaric hypoxia either in a decompression chamber or at high altitude to investigate the possible importance of hypobaric pressure. However, our data demonstrated that acute normobaric hypoxia alone is sufficient to induce migraine.
Acknowledgements
The authors thank laboratory technicians Lene Elkjær and Winnie Grønning for assistance with data extraction and Dr Marie Deen Christensen for assistance with data blinding.
Funding
The study was supported by the Capital Region of Denmark Foundation for Health Research (A4620), the Lundbeck Foundation (R155-2014-171), the Novo Nordic Foundation (NNF11OC1014333), the Augustinus Foundation (13-3794), Danish Council for Independent Research (DFF-4004-00169B), Simon Fougner Hartmanns Familiefond, the European Union’s Seventh Framework programme (2007-2003) under grant agreement no. 602633.
Supplementary material
Supplementary material is available at Brain online.
Abbreviations
- AUC
area under the curve
- SpO 2
capillary oxygen saturation
- 1 H-MRS
proton magnetic resonance spectroscopy
- MRA
magnetic resonance angiography
- NAA
N -acetyl aspartate
References
Author notes
See Schoenen (doi: ) for a scientific commentary on this article.

