


Abstract
We report a natural history study of 216 patients with primary progressive (PP)- multiple sclerosis defined by at least 1 year of exacerbation-free progression at onset. This represents 19.8% of a largely population-based patient cohort having a mean longitudinal follow-up of 23 years. This subgroup of PP-multiple sclerosis patients had a mean age of onset of 38.5 years, with females predominating by a ratio of 1.3 : 1.0. The rate of deterioration from disease onset was substantially more rapid than for relapsing–remitting multiple sclerosis, with a median time to disability status score (DSS) 6 and DSS 8 of 8 and 18 years, respectively. Forty-nine percent of patients were followed through to death. Examination of the early disease course revealed two groups with adverse prognostic profiles. Firstly, a shorter time to reach DSS 3 from onset of PP-multiple sclerosis significantly adversely influenced time to DSS 8. Second, involvement of three or more neurological systems at onset resulted in a median time to DSS 10 of 13.5 years in contrast to PP-multiple sclerosis patients with one system involved at onset where median time to death from multiple sclerosis was 33.2 years. However, age, gender and type of neurological system involved at onset appeared to have little influence on prognosis. Life expectancy, cause of mortality and familial history profile were similar in PP-multiple sclerosis and non-PP-multiple sclerosis (all other multiple sclerosis patients from the total population). From clinical onset, rate of progression was faster in the PP-multiple sclerosis group than in the secondary progressive (SP)-multiple sclerosis group. When the rates of progression from onset of the progressive phase to DSS 6, 8 and 10 were compared, SP-multiple sclerosis had a more rapid progressive phase. A substantial minority (28%) of the PP-multiple sclerosis cohort had a distinct relapse even decades after onset of progressive deterioration. These studies establish natural history outcomes for the subgroup of multiple sclerosis patients with primary progressive disease.
Introduction
Studies of the natural history of chronic diseases have been valuable historically for nosology, for improvement of understanding of pathogenesis, for the practical clinical applications of prognosis and for establishment of baselines for therapeutic adventure. The clinical, natural history and prognostic features of typical relapsing–remitting (RR) multiple sclerosis have been well defined by population-based studies extending over long periods of follow-up. The idealized criteria for a true inception cohort laid down by Sackett et al. (1985) are being approached. Observations of this kind have been useful in trial designs of RR-multiple sclerosis (Noseworthy et al., 1994; Ebers and Paty, 1998).
Multiple sclerosis has long been recognized to have a progressive phase, an observation made by Charcot nearly a century ago (Charcot, 1877). He further recognized that some cases were primarily progressive from onset, and the term primary progressive (PP)-multiple sclerosis is now in use to describe such individuals. They have always represented a substantial minority in cross-sectional or longitudinal studies of multiple sclerosis populations whether they be clinic, hospital or autopsy based. It has been only recently, however, that these cases have received focused attention. This has been aided by modern advances in diagnostic imaging and spinal fluid studies which have largely eliminated the diagnostic difficulty which has long attended this somewhat atypical presentation. Nevertheless, time from first symptom(s) to diagnosis remains prolonged.
In contrast to RR-multiple sclerosis, comparatively little information is available on the clinical and/or demographic features and the natural history of PP-multiple sclerosis (Confavreux et al., 1980; Poser et al., 1986; Minderhoud et al., 1988; Runmarker and Andersen, 1993). Prognostic variables have yet to be addressed specifically in this multiple sclerosis subset. Even the reported frequency of this group within a multiple sclerosis population has been widely variable, ranging from 9% (Bonduelle and Albaranes, 1962) to 37% (Minderhoud et al., 1988). Indeed, the definition of this disease subtype only recently has achieved some consensus (Lublin and Reingold, 1996), albeit without much validation. What information is available derives from the ~20% of multiple sclerosis patients who fall into this category in most reported multiple sclerosis populations and, for these, outcome has been largely short-term in nature. Long-term natural history data are scanty for reasons of numbers and because it is only recently that attempts have been made to separate such patients from the RR and secondary progressive (SP) types. A substantial amount of short-term outcome information for RR-multiple sclerosis can now be derived from the placebo arms of many clinical trials entering this patient subgroup. These special populations provide a uniquely apt variety of natural history information suitable for trial design and interpretation and have the advantage of the frequent and prospective serial neurological evaluations required by such studies. The combination of data from the placebo arms of trials with those from untreated natural history series has defined the course of RR/SP-multiple sclerosis as it is presently understood.
On the other hand, clinical trials have yet to be carried out in patients with primary progressive disease as a distinct subgroup. The natural history in this context is even less well understood. PP-multiple sclerosis patients usually make up a small minority of a few trials admitting unselected `progressive' multiple sclerosis patients. This does not derive entirely from the low frequency of such patients. The relatively low rate of MRI activity (Thompson et al., 1989) which characterizes some PP-multiple sclerosis patients can serve to limit trial entry where MRI is a criterion. Indirectly related to this is the relatively long duration required of studies where clinical progression alone is the outcome.
Recently it has been suggested that PP-multiple sclerosis differs genetically from RR-multiple sclerosis (Olerup et al., 1989) and in MRI behaviour from SP-multiple sclerosis (Thompson et al., 1989). However, attempts to demonstrate differences in demographic features, familial risk and concordance of clinical phenotype within families have not been strongly supportive of these suggestions (Weinshenker et al., 1990; Robertson et al., 1996). What evidence is available does suggest that the outcome in PP-multiple sclerosis may be more severe or at least it is widely believed to be so (Poser et al., 1989; Runmarker and Andersen, 1993). Finally, it is not known whether the prognostic indicators, applicable to the majority of patients with SP-multiple sclerosis who commonly follow an initial relapsing and remitting course, are also valid in patients with primary progressive disease.
With these considerations in mind, we examined the clinical characteristics and natural history of PP-multiple sclerosis in a large clinic population-based cohort of multiple sclerosis patients. The duration of follow-up (23 years) encompasses the greater part of the clinical course of this subgroup and considers a substantial minority through to death from the disease.
Methods
Diagnosis
Patients categorized into subgroups from the original natural history series (Weinshenker et al., 1989a) were reassigned to the standardized definitions for the clinical course patterns of multiple sclerosis according to a recent consensus (Lublin and Reingold, 1996). Subgroups of the population strictly defined by population-based epidemiological studies (Hader et al., 1988) served as an internal control. In the original paper, progressive patients were defined as progressive from onset (PP-multiple sclerosis) and included patients with progressive and relapsing elements early in the disease. The criterion for progressive disease originally was imprecise, but we have redefined all PP-multiple sclerosis cases as having progressive onset and a course of at least 1 year duration. Although many patients had apparent plateaux when the disease appeared stable for extended periods, subjective worsening was described by patients for most intervals even if it was not clinically obvious. Non-PP-multiple sclerosis patients had relapsing–remitting, relapsing–progressive or secondary progressive disease as previously described (Weinshenker et al., 1989a). If the newly proposed definitions are followed, the multiple sclerosis clinical course spectrum includes four categories: RR-multiple sclerosis, the classical relapsing and remitting disease; PP-multiple sclerosis, primary progressive multiple sclerosis with no distinct relapses; SP-multiple sclerosis, secondary progressive multiple sclerosis as an initial RR-multiple sclerosis course followed by progression; PR-multiple sclerosis, progressive relapsing multiple sclerosis as progressive disease from onset with clear acute superimposed relapses (when this category was proposed, the panel suggested the term relapsing-progressive should be abandoned) (Lublin and Reingold, 1996).
However, for the purposes of this study of the natural history of PP-multiple sclerosis, we have included the PR-multiple sclerosis patients, since this new definition did not serve to identify subgroups with long-term outcomes that were clearly different from those for PP-multiple sclerosis (Kremenchutzky et al., 1998).
Clinical follow-up in the London Multiple Sclerosis Clinic
The Multiple Sclerosis Clinic at the London Health Sciences Centre-University Campus, London, Ontario was established in 1972 to provide long-term care for multiple sclerosis patients from its referral area of Southwestern Ontario. The characteristics of this clinic have been outlined in numerous previous studies based on its patient population (Weinshenker et al., 1989a, b, 1991a, b). In general, primary care continues to be delivered to many patients in the immediate area and secondary care to patients in the surrounding area. Tertiary referral is provided for patients with multiple sclerosis from Northern and Southern Ontario and to a lesser extent for patients from adjacent provinces and the United States. The geographically based subgroup from Middlesex County, which represents 90% of Middlesex County multiple sclerosis patients, has served as a strictly geographically based standard population against which subgroups of patients can be compared (Hader et al., 1988). It also serves to assess the justification for pooling groups for total population analysis.
Into the mid 1980s, patients were seen on a yearly basis, and an effort was made to continue this for the natural history cohort described in detail in this report. This has not proved possible for all patients, especially those becoming severely disabled. For local patients who have become institutionalized, information on physical status in these latter patients has often been derived from telephone follow-up with physicians, family and, as much as possible, from the patients themselves. This has included visits to patients in local nursing homes.
Extensive efforts were made to trace patients lost to follow-up. This included attempts to contact the patients, their family doctors, their relatives and neighbours and local multiple sclerosis society chapters, as well as the examination of telephone directories and hospital records. We had assistance from the Government of Ontario and its Ministry of Health which provided access to the provincial registry of all deaths. This source identified the final outcome in the majority of patients lost to follow-up through copies of death certificates which were relied upon for cause of death. Necessarily, some arbitrary decisions had to be made regarding the cause of death where clinical records were suboptimal. Patients known to have been bedridden and who subsequently developed pneumonia or sepsis were considered to have died of multiple sclerosis. If, however, the cause of death was listed as heart disease, cancer or some other disorder not directly or indirectly related to or associated with multiple sclerosis, such patients were considered not to have died of multiple sclerosis irrespective of their degree of disability. Information on disability independent of disorders causing death nevertheless was obtained and recorded.
Comparative mortality figures for the PP-multiple sclerosis population were taken from the death data available in 1996 with respect to non-PP-multiple sclerosis patients from the original cohort (Weinshenker et al., 1989a).
Non-PP-multiple sclerosis patients from the original cohort (minus those patients found later not to have multiple sclerosis) were defined as having at least one distinct relapse in the first year from onset of symptoms with or without later onset of progression. This group, therefore, encompassed all RR- and SP-multiple sclerosis patients according to the subdivisions in the original report. In the process of long-term follow-up, on repeated questioning about early symptoms or often spontaneously, patients recalled early exacerbations initially forgotten. A small group of the original PP-multiple sclerosis patients, some 10% (n = 21), had to be reclassified as SP-multiple sclerosis but all fall into a category which we have not examined in this publication—single-attack-progressive multiple sclerosis (SAP-multiple sclerosis). For the purpose of this study, they were considered as SP-multiple sclerosis patients and were therefore excluded from the present analysis.
Data collection
Disability status scores (DSS)
Research charts are kept separately from the patient's hospital records, and each visit to the clinic was recorded in detail in terms of clinical examination and history since the last consultation. Most surviving non-institutionalized patients were and continue to be followed-up on an annual or biannual basis regardless of their clinical course. Data up to 1984, by which time the average disease duration was 11.9 years, were already fully recorded. The updated data were reviewed to confirm recorded DSSs to the end of 1996. DSSs were used in the original analysis which antedated the EDSS (extended DSS) and this analysis was kept to the same scale even though later data often included more detailed information. If the DSS was unrecorded, it was derived from the description of the neurological findings when they were found adequate. In the absence of clinical notes allowing reliable assessment of the DSS, the database was left blank for that visit, resulting in a variation in the number of subjects contributing at each DSS level for time to disability survival curves. The specific characteristics of these data will be reported elsewhere where we address probability of progression, at various levels, to the next level. Patients not reaching a given level were right censored. However, the relentless and unremitting progression characteristic of the PP-multiple sclerosis population led to little ambiguity even when progression rates were quite slow.
Systems involved at onset
The symptoms characterizing the onset of PP-multiple sclerosis were used to determine the `system' or `systems' involved at onset. Although time to initial evaluation and diagnosis usually was some years after onset of symptoms, findings on initial examination were used to confirm the systems suggested by the history. These were categorized into motor, sensory, cerebellar, brainstem, bladder/bowel, optic nerve and others. These groups were not defined more precisely than the assignation made by experienced neurologists based on the history and examination. This information was used to assess prognostic significance as to type and number of systems involved at onset.
The `second series'
A second more contemporary series of PP-multiple sclerosis patients seen in the last 5 years was evaluated similarly to test some hypotheses derived from the original sample.
Prognostic factors
We examined the influence of gender, age of onset, type and number of systems involved at onset and the rate development of early disability on both disability and mortality in PP-multiple sclerosis by examining survival to DSS 3, 6, 8 and 10. Age of onset was subdivided prospectively and arbitrarily into three categories, low (30 years or less), intermediate (between 31 and 49 years) and high (50 years or more). Rate of early disability was examined by dividing the patients into two groups depending upon the time it took to reach DSS 3. We arbitrarily used two separate cut off times, 2 and 5 years, and compared the groups who reached DSS 3 before and after these times. We examined the influence of the specific system involved in patients who had just one system affected at the onset of PP-multiple sclerosis and in addition the influence of having two and three or more systems affected at the onset. This was by necessity a composite of data derived from historical and neurological examination at presentation, given the relatively long delays prior to seeking medical attention.
Familial history
Data on family history were recorded in the original series database and this information was used to perform a χ2 analysis of frequency of sporadic patients (no family history of multiple sclerosis), patients with a first degree relative and those with a second and or third degree relative for the PP-multiple sclerosis versus non-PP-multiple sclerosis populations as described by Weinshenker et al. (1990).
Comparison of SP- and PP-multiple sclerosis
To compare PP- and SP-multiple sclerosis rates of progression, we examined the DSSs of RR-multiple sclerosis patients from the original natural history series who had developed SP-multiple sclerosis. DSSs to 1996 were determined. The DSS level and year at which point the SP-multiple sclerosis patients became progressive was recorded. This was determined more easily in retrospect than when patients were seen at around the time of onset of progression. We directly compared the rates of progression of PP- and SP-multiple sclerosis patients both from disease onset and from onset of progressive deficit.
Previous treatments
A minority of patients received treatment other than steroids subsequent to our previous analyses, usually in the context of a controlled clinical trial. These were identified as they represent a potential influence on the `natural history'.
Statistical analysis
All analysis was performed using SAS (SAS Institute Inc., Cary, NC, USA). Survival analysis was performed with SAS/LIFE TEST using the life table (actuarial) method with intervals of 1 year. In this analysis, patients who had not yet reached the given DSS level but who had been followed for a known period of time were included as right censored. The log-rank statistic was used for significance tests of the equality of survival distributions. A multi-regression analysis using an accelerated failure time model (SAS/LIFE REG) was carried out for sex, age at onset, years to DSS 3, number of symptoms and geographical origin for DSS 6, 8 and 10.
Results
Patient population
Patients eliminated from the study
From a total of 252 patients thought to have PP-multiple sclerosis from the original study, 36 patients were excluded. The 21 patients who only in follow-up identified a single attack before the onset of the progressive symptoms were reassigned to the SP-multiple sclerosis group. An additional eight cases having <2 years of follow-up, with only a single visit, were removed since their contribution was negligible. A further seven turned out to have another diagnosis; two had hereditary spastic paraparesis, two had structural cervical myelopathies and one each had olivopontocerebellar atrophy, primary lateral sclerosis and cerebellar degeneration. These disorders are all among the commonest non-multiple sclerosis diagnoses made in patients referred to the multiple sclerosis clinic, and they were considered but in each of these cases there were initial circumstances believed to favour multiple sclerosis. Of the remaining 216 PP-multiple sclerosis patients, the 12 who were lost to follow-up were used in the analysis to the point where they were lost.
The `second series'
The `second series' included 165 PP-multiple sclerosis patients seen in the last 5 years, and the results below include these patients only where specifically mentioned.
PP-multiple sclerosis demographics
The demographic characteristics of the PP-multiple sclerosis population and the geographically distinct Middlesex County population are shown in Table 1. The mean age of onset was 38.5 years and the mean and median disease duration 23.7 and 23.0 years, respectively. In the non-PP-multiple sclerosis group, the mean age of onset was 28.6 years and the average duration of disease was 24.2 years (not shown in table). The demographics of the more contemporary series of PP-multiple sclerosis patients seen in the last 5 years was very similar to the original cohort for male : female ratio and age of onset (data not shown).
Range and distribution of years of onset
The distribution of year of onset in the PP-multiple sclerosis group was between 1928 and 1982, although the majority presented in the 1970s. The distribution of age of onset and the relative ratio of males to females for age of onset intervals are shown in Fig. 1.
Initial symptoms and signs
These were grouped as follows: motor deficit; sensory symptoms including pain; limb ataxia and/or impairment of balance; diplopia and/or vertigo (reflecting brainstem involvement); optic neuritis; and others (i.e. bladder/bowel, impotence, etc.). The most common presenting symptom was motor deficit in 109 (38.9%) patients, followed by sensory impairment in 91 (32.5%), cerebellar symptoms in 45 (16%) and brainstem in 15 (5.3%). Optic neuropathy was uncommon as an initial feature, presenting in only 12 (4.3%) subjects of the total group.
Time to presentation
During the years when the original cohort was assessed, the median time in this population for patients to present to the Multiple Sclerosis Clinic from onset of PP-multiple sclerosis was 8 years. For the `second series', time to presentation had narrowed to a median of 4 years (data not shown).
Previous therapies
Forty-six patients had been involved in one or more previous trial therapies (Table 2) not always prescribed by a Multiple Sclerosis Clinic physician. Accordingly, the data are contaminated by these interventions. However, because none of these treatments have been shown to influence the progression of the disease materially and/or were used in few patients for a limited time these patients have been included.
Age of onset and gender
The mean age of onset of 38.5 years is similar to previous smaller PP-multiple sclerosis groups, 37.3 years (Confavreux et al., 1980) and 43 years (Shepherd and Downie, 1980). As expected, men are relatively more common in PP-multiple sclerosis (ratio male : female 1 : 1.3) than in non-PP-multiple sclerosis (1 : 2) populations. However, the ratio between males and females in PP-multiple sclerosis falls with advancing age of onset, with the ratio again approaching 1 : 2. This pattern was found similarly in the `second series' (data not shown). The relative predominance of males in PP-multiple sclerosis is seen in the younger age of onset group where, among those below 35 years, the male : female ratios are close to 1 : 1.
Clinical course
DSS progression for the original PP-multiple sclerosis population is summarized in Fig. 2 for median time to reach each DSS point. Figure 3 shows survival curves for DSS 6 (Fig. 3A), 8 (Fig. 3B) and 10 (Fig. 3C) when comparing patients from Middlesex County with the others. The survival curves are almost identical for the two geographical groups.
Mortality data
From the initial population of 216 PP-multiple sclerosis patients, 12 were lost to follow-up, having neither death certificates available nor additional data extending up to 1996 since contact could not be made with them or their relatives. Of the remaining 204 patients, 101 (49.5%) had died, 71 (70.2%) from multiple sclerosis and the other 30 (29.7%) from the causes listed in Table 3. The average time to death from onset of PP-multiple sclerosis among the deaths due to multiple sclerosis (DSS 10) was 22.0 years. This includes three patients who committed suicide. If suicide is not included as part of the natural history, then the mean time to multiple sclerosis-related deaths would be 22.3 years. The mean age of the patients at the time of death due to multiple sclerosis was 58.8 years (SE = 12.0), and by other causes 66.8 years (SE = 9.9). The causes of death in PP-multiple sclerosis are compared with the large cohort of non-PP-multiple sclerosis (defined from the original natural history cohort) deaths in the Table 3. As shown, the distribution of causes is remarkably similar.
Prognostic factors
We have analysed several clinical parameters to assess their usefulness in predicting the long-term prognosis of PP-multiple sclerosis.
Gender
As can be seen from Fig. 4, gender had no discernible effect on the rate of progression through early levels of the DSS scale, but time from onset of multiple sclerosis to DSS 10 was significantly more rapid in men than in women (P = 0.02) (Fig. 5).
Age of onset
In Fig. 6, the influence of three PP-multiple sclerosis patient groups, separated on the basis of age of onset, is compared in survival curves to DSS 8 (Fig. 6A) and DSS 10 (Fig. 6B). There was no statistical difference in these curves, although the highest age of onset group had a somewhat shorter time to DSS 10 (P = 0.05) (Table 4).
System involved at onset
Figure 7 demonstrates the outcome in PP-multiple sclerosis cases who have only one system involved at onset, either motor, sensory, cerebellar or others (brainstem, optic neuritis or bladder symptoms, all of which had too few cases in this study to look at that system individually). There is no statistical difference between any of the groups with respect to time from onset to DSS 6 (Fig. 7A), DSS 8 (Fig. 7B) or DSS 10 (Fig. 7C). Pooling cerebellar and brainstem data showed no significant difference from the entire group (data not shown).
Number of systems
Figure 8 shows survival curves in which cases with three or more systems affected reached DSS 6 (Fig. 8A), DSS 8 (Fig. 8B) or died from multiple sclerosis (DSS 10) (Fig. 8C). Compared with those with one or two systems involved, these differences are statistically significant (P = 0.02, 0.003 and 0.0005, respectively). There was a 5-year difference between 50% survival to DSS 6 in patients with one system involved when compared with those with three or more systems involved, and a 10-year difference to DSS 8. The median times to death differed dramatically between those with one system involved (n = 162) and those with three or more (n = 7), and were 33.2 and 13.5 years, respectively (Table 5).
In the cohort of newly diagnosed PP-multiple sclerosis patients seen in the last 5 years, the frequency of cases with one or two versus cases with three or more systems involved at onset was also examined; in addition the frequency of those reaching DSS 6 by 3 years or less was identified. Since the length of follow up was only 5 years, the sample size was small; however, much as in the original sample, all four (100%) patients with three or more systems involved at onset had reached DSS 6 by 3 years or less compared with 14 out of 69 (20%) among those with one or two systems affected at onset.
Rate of early disability
The final prognostic factor analysed was the time to early disability. Time to DSS 3 affected the time to progress from DSS 3 to DSS 8. Figure 9A shows a significant difference between those that have reached 3 on the Kurtzke scale by 2 years or less (early) and those that have not (late) (P = 0.021). The median time to reaching DSS 8 from DSS 3 was 11.2 years versus 15.2 years for the early and late groups, respectively. Figure 9B shows an even greater difference (P = 0.007) between patients who reached DSS 3 in 5 years or less when compared with PP-multiple sclerosis patients who took longer than 5 years to reach DSS 3.
Table 6 gives the results of a multiple regression analysis of the above prognostic features for DSS 8. Time to DSS 3 was a highly significant predictor, while neither sex nor age of onset had a significant effect.
Familial history
A comparison was made between the distribution of familial type for PP-multiple sclerosis and non-PP-multiple sclerosis, examining first, second and third degree relatives as described in the Methods section. Of the PP-multiple sclerosis cases, 10.6% had a relative with multiple sclerosis compared with 13.9% of the non-PP-multiple sclerosis population. Overall for PP-multiple sclerosis, the familial rate was somewhat lower than for non-PP-multiple sclerosis, but this was not statistically significant (P = 0.09) for the numbers of patients with all degrees of multiple sclerosis familial history as defined previously (Weinshenker et al., 1990). These data have not been age corrected nor updated from the time of the original reports, but differ from them in that those having either a different diagnosis or no follow-up have been removed.
Comparison of rates of progression in PP- and SP-multiple sclerosis
Figure 10A and B compares the survival curves for time to DSS 8 and 10 for PP- and SP-multiple sclerosis populations from the onset of multiple sclerosis. The PP-multiple sclerosis group reaches both endpoints significantly more quickly than the SP-multiple sclerosis cohort (Fig. 10). The SP- and the PP-multiple sclerosis populations are compared in survival curves for the time from onset of the progressive phase to DSS 8 and death due to multiple sclerosis (Fig. 11). This comparison removes the initial relapsing–remitting phase from the SP-multiple sclerosis group, allowing a somewhat more direct comparison of the progressive phases of the two groups. No correction is made for the fact that the progressive phase is recognized at an older age but at a lower DSS level on average in the PP-multiple sclerosis patients. The SP-multiple sclerosis cohort does significantly worse for time to DSS 6 (not shown) and also to DSS 8 (Fig. 11A). In Fig. 11B (survival curves to DSS 10), this difference largely disappears.
Discussion
Diagnosis
The diagnostic issues that characterized this group of PP-multiple sclerosis patients at time of presentation are now largely dated since the initial diagnoses were made two to four decades ago. Nevertheless, a residual clinical problem is the wide range of differential diagnoses that need to be considered in evaluating symptoms and signs seen at the onset of PP-multiple sclerosis. The initial diagnoses entertained prior to the correct diagnosis of PP-multiple sclerosis in our cohort and the findings yielded no surprises. Eleven patients (nine females) initially were believed to have psychosomatic complaints, and two of these went on to have electroconvulsive therapy. Seven patients had surgery for spondylosis, a co-existent problem in some. We also found seven patients originally believed to have PP-multiple sclerosis who turned out to have other common diagnoses. In each case, there were strong reasons to suspect the diagnosis of multiple sclerosis. This has become somewhat simplified today by the widespread availability of MRI and other investigative tests. This raises the question of the specificity of previous data on PP-multiple sclerosis in reports where the patients were followed up for a short period of time before these tests had become available. However, of the original cohort of patients having or being reclassified as PP-multiple sclerosis, 96.6% are still considered to have multiple sclerosis. This seems an adequate level of accuracy considering that all of these patients were first seen pre-MRI and many pre-CSF. MRI subsequently has been carried out in many of these patients for diagnostic purposes.
Clinical course
The Middlesex County cohort which is geographically based and highly ascertained had survival curves which matched the non-Middlesex County group closely (Fig. 3), suggesting that there is little ascertainment bias affecting the data from the entire PP-multiple sclerosis population. In Fig. 2, the rapidity of progression to DSS 6 is apparent, with half the patients reaching DSS 6 (requiring unilateral assistance to walk) by 8.1 years [this is slightly more favourable than the 6 years found by Runmarker and Andersen, (1993)]. In this analysis, the median time for patients to be first seen in the multiple sclerosis clinic was 8 years, and by this time half the patients would have already reached DSS 6. This may in part be due to the difficulty of diagnosis when diagnostic imaging and other investigative procedures were unavailable, but often was the result of ascribing gait disorders to non-neurological diseases common in an older population. The examination of a similar sized cohort of PP-multiple sclerosis patients presenting in the last 5 years indicates a trend to earlier presentation (median = 4.0 years versus 8 years) (M. Kremenchutzky et al., in preparation).
Familial multiple sclerosis
The rate of appearance of affected family members was slightly lower in the PP-multiple sclerosis group than for other clinic multiple sclerosis patients, as previously noted (Weinshenker et al., 1990). Before this factor is used to support the view that PP-multiple sclerosis is different in this regard, it must be realized that the data derive from patients first seen two to four decades ago. Rates could be influenced by the more advanced age of the PP-multiple sclerosis groups and their first degree relatives and the consequent reduced likelihood of diagnosis in a prior generation and of residual risk remaining in their offspring.
Mortality data
The mean time to death from multiple sclerosis of 22.3 years for PP-multiple sclerosis patients was more rapid than in unselected multiple sclerosis populations. Hyllested (1961) found a mean time to death of 25–29 years, and Phadke (1987) 24.5 years. After a similar length of follow-up, 34.8% of the PP-multiple sclerosis group had died from multiple sclerosis complications compared with only 16.2% of the non-PP-multiple sclerosis group. This difference may be explained in part by the significant increase in baseline age at the onset of the disease. Indeed, 14.7% of the PP-multiple sclerosis versus 10.1% of the non-PP-multiple sclerosis group had died from non-multiple sclerosis-related causes. However, the mean age at death from multiple sclerosis for this PP-multiple sclerosis population was only 58.8 years.
We have shown that approximately two-thirds of the patients who develop PP-multiple sclerosis actually die as a direct result of the complications of multiple sclerosis, and around one-third die from a variety of other causes. When we compared this with the updated death data for nonPP-multiple sclerosis patients, the distribution of cause of death is remarkably similar.
Prognostic indicators
Primary progressive patients appear predictably to worsen, albeit at different rates. However, we have also shown two subpopulations within PP-multiple sclerosis patients who have a worse prognosis. This is particularly the case among those who have multiple systems involved at onset. If a patient had three or more systems involved at onset compared with one system, they reached DSS 6 faster by a median difference of 5 years, DSS 8 by 10 years and DSS 10 by ~20 years (Fig. 8A–C). This dramatic difference for this rare group (3.4% in our study) is supported by data from the second series of PP-multiple sclerosis patients. Even though the number was meagre, all patients with three or more systems affected at onset who had reached DSS 6 (n = 4) had done so in 3 years or less, compared with 20% of those with one or two systems affected at onset (n = 69). This unusual group could be identified at an early stage for trials of more heroic therapies, for example bone marrow transplantation. The second and more generally applicable adverse prognostic factor is the rate of early progression. If a patient reaches DSS 3 within 2 years rather than in >2 years (an interval which splits our PP-multiple sclerosis population into halves), there is a difference of ~5 years in median time to DSS 8. This difference is extended to 8 years if the division in median time to DSS 3 is >5 years. This finding is consistent with our original data (Weinshenker et al., 1989b) showing that time to DSS 3 in an unselected multiple sclerosis population affects long-term prognosis, and with data of Runmarker and Andersen (1993) showing that in non-PP-multiple sclerosis patients a low disability score after 5 years is favourable.
Based on our results, PP-multiple sclerosis does not completely conform to the adverse prognostic factors found in the more common relapsing types of multiple sclerosis. Multiple regression analysis detected no significant effect of gender or age at onset, but time to DSS and number of systems (three or more) involved at onset were significant predictors of time to DSS 8 (see Table 6).
Sex ratio
The relative predominance of males in PP-multiple sclerosis is particularly seen in the younger age of onset group where among those younger than 30 years, the male : female ratio is 1 : 1 (see Fig.1). The overall female preponderance in multiple sclerosis interestingly is less applicable to the progressive disease. In our cohort of PP-multiple sclerosis patients, as the age of onset increases, the male : female ratio switches towards that for non-PP-multiple sclerosis patients (Fig. 1). Hormonal factors may well be involved, but these observations need confirmation (Nelson et al., 1988; Worthington et al., 1994; Verdru et al., 1994; Runmarker and Andersen, 1995; Whitacre et al., 1998).
Comparison of PP- and SP-multiple sclerosis rates of progression
It has been postulated that PP-multiple sclerosis is really SP-multiple sclerosis with the initial relapsing–remitting phase in some way amputated. Perhaps the relapses were mild and not recalled by the patient or the plaques were in a clinically silent area and hence resulted in a later age of symptomatic onset of a process which is not fundamentally different. It was documented with time that 10% of the original cohort were SP-multiple sclerosis cases, and this has been corrected for in this update. We recognize the limitations of comparison on an outcome measure (disability over time) where time is onset-determined and often imprecise and where clinical onset frequently may be offset from biological onset. We have compared progression rates from onset for SP- and PP-multiple sclerosis and the results in Fig. 10 show a substantially worse outcome for PP-multiple sclerosis. In contrast, in the PP-multiple sclerosis population investigated by Minderhoud et al. (1988), progress to DSS 7 was less rapid than for SP-multiple sclerosis when time to disability was dated from onset of progression deficit. This could be explained in part by the relapsing–remitting phase giving those with SP-multiple sclerosis a more advanced DSS level than the PP-multiple sclerosis group at onset of progression, or by an interaction between different mechanisms of disability for relapsing and progressive phases. This would bias the SP-multiple sclerosis group towards a shorter time to these endpoints. Our results are in agreement with those of Minderhoud et al. (1988), although the biological significance of this finding is not clear. One interpretation is that the effects of early relapses account for the steeper slope of the SP-multiple sclerosis survival curve. This could be evaluated in more detail with an analysis in which the outcome for the DSS would be measured from onset of progression. There is often difficulty in pinpointing onset of progression in relapsing–remitting patients; however, this becomes clearer with increasing duration of follow-up, a characteristic which also serves to diminish the influence of errors in identifying this necessarily imprecise time point. We will report this analysis in a subsequent paper in which we compare PP-multiple sclerosis with SP-multiple sclerosis, including subgroups of SP-multiple sclerosis in which onset of progression is identified the most accurately, corrected for censored cases with longitudinal analysis, and, in addition, we compare SP-multiple sclerosis with and without prior relapses affecting ambulation.
Clinical trials in PP-multiple sclerosis
To date, there have been no specific trials addressing the PP-multiple sclerosis population alone, and these patients are often considered for current studies but fail commonly used entry criteria. There are several reasons for this. Firstly, they obviously do not have exacerbations (an often measured endpoint) or if any do occur, their low frequency means their occurrence cannot be expected with any confidence. Second, MRI scans in PP-multiple sclerosis are said to show a relative paucity of plaques (although this is not entirely clarified as yet) and a suitable quantifiable equivalent is yet to be found. Third, the natural history of such patients until now has not been addressed specifically. Accordingly, feasibility has been difficult to consider, although the characteristics of this population are not all disadvantageous.
We have identified two subpopulations that have a poor prognosis: a small minority with multiple systems involved at onset and a larger group having rapid early progression. We will apply this information to propose suitable entry criteria for a theoretical multi-centre trial in PP-multiple sclerosis (Cottrell et al., 1999). With these criteria, we wish to ensure that adequate sample size calculations be used to favour the identification of active treatment in this form of the disease.
Definition
The phenotypic subdivision of multiple sclerosis remains vexingly dependent on subjective information and is too often heavily reliant on the ability of patients to give an accurate history of their attacks and clinical course. Not surprisingly, the clinician's view of terms such as `progression', `relapse' and `remission' has varied considerably in the literature. The qualitative nature of these terms has probably led to the widespread discrepancies among previous studies in the proportions of patients with multiple sclerosis deemed to have PP-multiple sclerosis (see Introduction).
Recent non-population-based studies may also be biased in favour of relapsing patients since treatment for them is now available and they may be more likely to be seen at multiple sclerosis clinics. The problem of definition centres primarily around the use of such terms as `minor' and what constitutes a `relapse' or `remission'. For example, Patzold and Pocklington (1982) required a `full' recovery from relapse to be considered in their intermittent group, whereas Confavreux et al. (1980) define remittent disease as being a stable condition between relapses. These terms are seemingly unavoidable if PP-multiple sclerosis is considered to be part of the multiple sclerosis spectrum. However, there are no easily applied measures to place individuals into defined slots on what may be a continuum. If definition has as its aim the inclusion of like and the exclusion of unlike, inadequate understanding of the inter-relationships of relapse, remission and progression makes us hesitant to define these terms rigidly in the absence of clear biological or prognostic meaning.
Subdividing multiple sclerosis
It could be reasonably asked whether the segregation of multiple sclerosis into distinct categories using phenotypic definitions is anything more than a descriptive exercise. Using the widely used definitions, there is considerable overlap between the clinical subgroups. Not all patients fit comfortably into currently accepted definitions. It is possible that a phenotypic classification would divide a group of heterogeneous disorders artificially without imposing any greater order. Although we continue to believe that the pathogenesis and mechanisms among multiple sclerosis patients will be found to be heterogeneous, it will require more than clinical pathological differences to establish it.
Characteristics of the PP-multiple sclerosis population
| Total PP-multiple sclerosis population | Males | Females | Middlesex County | |
|---|---|---|---|---|
| Demographic characteristics are classified by sex and geography. Follow-up time is the number of years from the first consultation up to the last recorded examination or clinical record. Time to presentation is the number of years from symptomatic onset of disease to the initial evaluation in the London Multiple Sclerosis Clinic. | ||||
| No. of patients | 216 | 93 | 123 | 32 |
| Disease duration at final follow-up (years) | ||||
| Mean (SD) | 23.7 (9.2) | 22.7 (10.2) | 24.4 (8.3) | 25.8 (7.6) |
| Median | 23 | 23 | 24 | 27.5 |
| Age of onset | ||||
| Mean (SD) | 38.5 (10.4) | 36.6 (10.3) | 39.9 (10.2) | 38.2 (8.8) |
| Median | 39.5 | 35 | 41 | 38.5 |
| Time to multiple sclerosis clinic presentation (years) | ||||
| Mean (SD) | 9.8 (7.9) | 10.4 (8.1) | 9.3 (7.7) | 7.4 (9.0) |
| Median | 8 | 8 | 8 | 5 |
Trial treatments
| Trial treatments given | No. of patients exposed |
|---|---|
| Record of exposure to trial treatments during the time of follow-up does not include intravenous steroids or ACTH (adrenocorticotrophic hormone) therapy. Some of the subjects were exposed to more than one therapy. | |
| Hyperbaric oxygen | 20 |
| Cyclophosphamide | 10 |
| Oral linoleic acid | 14 |
| Azathioprine | 3 |
| OKT3 | 1 |
| Intrathecal steroids | 4 |
Mortality data
| Cause of death | All forms | PPMS | NonPPMS |
|---|---|---|---|
| PPMS = primary progressive multiple sclerosis. | |||
| No. of deaths | 286 (30.8%) | 101 (49.5%) | 185 (26.3%) |
| Deaths from multiple sclerosis | |||
| `Multiple sclerosis' | 47 (16.4%) | 19 (18.8%) | 28 (15.1%) |
| Respiratory | 95 (33.2%) | 45 (44.5%) | 50 (27.0%) |
| Septicaemia | 9 (3.1%) | 0 (0.0%) | 9 (4.8%) |
| Renal complications | 5 (1.7%) | 3 (2.9%) | 2 (1.0%) |
| Cachexia/dehydration | 4 (1.4%) | 0 (0%) | 4 (2.0%) |
| Unknown (if K > 7) | 19 (6.6%) | 4 (3.9%) | 15 (8.1%) |
| Total | 179 (62.6%) | 71 (70.2%) | 108 (58.3%) |
| Other causes | |||
| All cancers | 30 (10.4%) | 6 (5.9%) | 24 (12.9%) |
| Cardiac events | 33 (11.5%) | 13 (12.8%) | 20 (10.8%) |
| Respiratory | 8 (2.8%) | 0 (0.0%) | 8 (4.3%) |
| Cerebrovascular | 14 (4.9%) | 6 (5.9%) | 8 (4.3%) |
| Gastrointestinal | 7 (2.4%) | 1 (0.9%) | 6 (3.2%) |
| Suicide | 5 (1.7%) | 3 (2.9%) | 2 (1.0%) |
| Homicide | 1 (0.3%) | 1 (0.9%) | 0 (0.0%) |
| Accidents | 2 (0.7%) | 0 (0.0%) | 2 (1.0%) |
| Unknown (if K < 7) | 7 (2.4%) | 0 (0.0%) | 7 (3.7%) |
| Total | 107 (37.4%) | 30 (29.7%) | 77 (41.6%) |
Median time from onset for PP-multiple sclerosis to reach the DSS levels for the three age groups
| DSS 2 | DSS 3 | DSS 4 | DSS 5 | DSS 6 | DSS 7 | DSS 8 | DSS 9 | DSS 10 | |
|---|---|---|---|---|---|---|---|---|---|
| P-values for testing for the homogeneity of survival curves between the groups of age at onset using the log-rank test. | |||||||||
| Low n = 49 | |||||||||
| Median (years) | 1.62 | 2.86 | 4.8 | 6.13 | 6.83 | 11.5 | 19.8 | 36.4 | 39.18 |
| SE | 0.09 | 0.5 | 0.69 | 0.84 | 1.17 | 3.28 | 1.47 | 1.22 | 0.91 |
| Intermediate n = 138 | |||||||||
| Median (years) | 1.58 | 3.1 | 5.33 | 7.4 | 8.66 | 14.16 | 18.64 | 33.43 | 33.37 |
| SE | 0.05 | 0.23 | 0.62 | 1.07 | 0.7 | 0.75 | 1.03 | 0.42 | 0.36 |
| High n = 29 | |||||||||
| Median (years) | 1.56 | 3 | 3.88 | 5.13 | 6.33 | 11.97 | 16.68 | – | 28.21 |
| SE | 0.11 | 0.38 | 0.63 | 0.6 | 0.88 | 1.16 | 1.79 | – | 0.7 |
| P-value | 0.16 | 0.25 | 0.12 | 0.33 | 0.26 | 0.81 | 0.18 | 0.9 | 0.05 |
Median time to reach the DSS levels for the number of systems involved at onset
| DSS 3 | DSS 6 | DSS 8 | DSS 10 | |
|---|---|---|---|---|
| Group 1 includes primary progressive multiple sclerosis patients with cerebellar only, motor only, sensory only, brainstem only, optic neuritis only or other systems (n = 162). Group 2 includes patients with two of the above systems involved (n = 47). Group 3 includes patients with three or more systems at onset (n = 7). P-values test for the homogeneity of survival curves between the groups. | ||||
| Group 1 | ||||
| No. failed | 150 | 151 | 106 | 50 |
| No. censored | 1 (0.7%) | 3 (1.9%) | 38 (26.4%) | 87 (63.5%) |
| Median (years) | 3.3 | 8.7 | 19.5 | 33.2 |
| Group 2 | ||||
| No. failed | 44 | 44 | 35 | 16 |
| No. censored | 0 | 1 (2.2%) | 9 (20.5%) | 26 (61.9%) |
| Median (years) | 2.6 | 6.2 | 16.6 | 33.9 |
| Group 3 | ||||
| No. failed | 7 | 7 | 6 | 5 |
| No. censored | 0 | 0 | 1 (14.2%) | 1 (16.7%) |
| Median (years) | 1.9 | 3.5 | 9 | 13.5 |
| Total failed | 201 | 202 | 147 | 71 |
| Total censored | 1 (0.5%) | 4 (1.9%) | 48 (24.6%) | 114 (61.6%) |
| P-value | 0.1 | 0.02 | 0.003 | 0.0005 |
Multiple regression analysis of prognostic factors for DSS 8
| Factor | Regression coefficient | Standard error | P-value | Effect tested |
|---|---|---|---|---|
| Sex | 0.037 | 0.078 | 0.63 | Male versus female |
| Age at onset (years) | –0.001 | 0.004 | 0.15 | Linear effect |
| Years to DSS 3 | 0.067 | 0.011 | 0.0001 | Linear effect |
| No. of systems | –0.457 | 0.19 | 0.01 | Three versus one |
| No. of systems | –0.09 | 0.08 | 0.27 | Two versus one |
| Origin of case | –0.08 | 0.1 | 0.41 | Middlesex versus non-Middlesex |
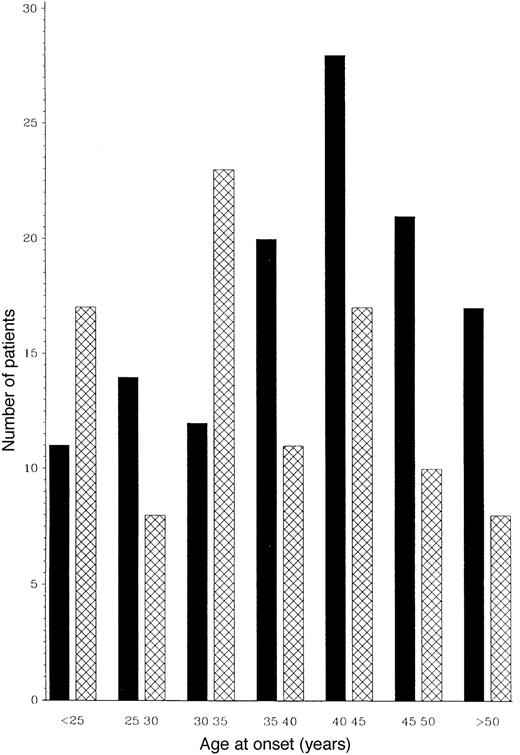
Frequency distribution of age at onset of males (cross-hatched columns) and females (filled columns) at 5-year intervals. The data shown are for 216 PP-multiple sclerosis patients.
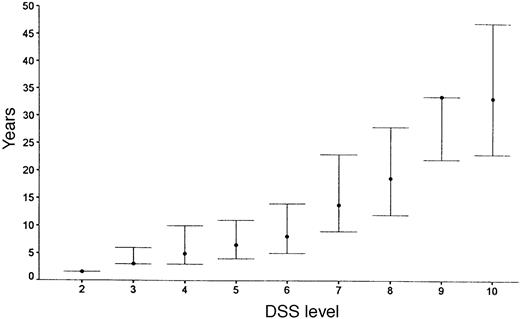
Median times for patients to reach various DSS levels with upper and lower quartiles. No upper quartile is estimated for DSS levels 9 and 10.
Survival analysis from time of onset of multiple sclerosis of the Middlesex County subgroup (dashed) compared with non-Middlesex County patients (continuous lines) to DSS 6 (A), DSS 8 (B) and death due to multiple sclerosis (DSS 10) (C).
Comparison of median times to DSS scores between males (dashed lines) and females (continuous lines).
Survival analysis from time of onset to death due to multiple sclerosis for males (dashed line) and females (continuous line) with primary progressive multiple sclerosis.
Survival analysis from onset of PP-multiple sclerosis to DSS 6 (A) and DSS 8 (B) for low (30 years or less; continuous lines), intermediate (between 31 and 50 years; short-dashed lines) and high (50 years or more; long-dashed lines) ages of onset.
Survival analysis from onset of PP-multiple sclerosis to DSS 6 (A), DSS 8 (B) and DSS 10 (death due to multiple sclerosis) (C) for groups with one system at onset, either motor (n = 70), sensory (n = 52; short-dashed lines), cerebellar (n = 18; long-dashed lines) or others which include cerebral, brainstem and visual (n = 22; dotted lines).
Survival analysis from onset of PP-multiple sclerosis sclerosis to DSS 6 (A), DSS 8 (B) and DSS 10 (death due to multiple sclerosis) (C) for different numbers of systems involved at onset. A total of 162 patients had one system involved at onset (continuous lines), 47 had two (short-dashed lines, and seven had three or more (long-dashed lines).
Survival analysis from onset of PP-multiple sclerosis to DSS 8 for early rates of progression. In A, early rates of progression are defined as those reaching DSS 3 in <2 years, n = 94, and late as taking >2 years, n = 97. In B, early is defined as reaching DSS 3 in <5 years, n = 168, and late as >5 years, n = 33. Progression: early = continuous lines; late = dashed lines.
Survival analysis of SP- and PP-multiple sclerosis populations from first onset of multiple sclerosis. (A) Survival curves to DSS 8, (B) survival curves to death due to multiple sclerosis. Continuous lines = primary progressive; dashed lines = secondary progressive.
Actuarial analysis of SP- and PP-multiple sclerosis populations from the onset of the progressive phase of the disease to DSS 8 (A) and to death due to multiple sclerosis (B). Continuous lines = primary progressive; dashed lines = secondary progressive.
We wish to thank Lamia Abid, Mary Hader, Cheryl Johnson, Debra King, Jennifer Pritchard, Marianne Russell and Rita Schuhmacher for their enthusiastic help, and Don Paty who saw many of these original patients prior to his departure in 1980. Financial support was received from The Multiple Sclerosis Society, Ontario Division, and Schering AG.
References
Bonduelle M, Albaranes R. Etude statistique de 145 cas de la sclerose en plaque.
Charcot JM. Disseminated sclerosis: its symptomatology. In: Charcot JM. Lectures on the diseases of the nervous system. London: New Syndenham Society; 1877. p. 209–17.
Confavreux C, Aimard G, Devic M. Course and prognosis of multiple sclerosis assessed by the computerized data processing of 349 patients.
Cottrell DA, Kremenchutzky M, Rice GPA, Hader W, Baskerville J, Ebers GC. The natural history of multiple sclerosis: a geographically based study. 6. Applications to planning and interpretation of clinical therapeutic trials in primary progressive multiple sclerosis.
Ebers GC, Paty DW. Natural history studies and applications to clinical trials. In: Paty DW, Ebers GC, editors. Multiple sclerosis. Philadelphia: F. A. Davis; 1998. p. 192–228.
Hader WJ, Elliot M, Ebers GC. Epidemiology of multiple sclerosis in London and Middlesex County, Ontario, Canada.
Hyllested K. Lethality, duration and mortality of disseminated sclerosis in Denmark.
Kremenchutzky M, Baskerville J, Cottrell DA, Rice GPA, Ebers GC. Progressive-relapsing and relapsing-progressive multiple sclerosis: a reevaluation [abstract].
Lublin FD, Reingold SC. Defining the clinical course of multiple sclerosis: results of an international survey.
Minderhoud JM, van der Hoeven JH, Prange AJ. Course and prognosis of chronic progressive multiple sclerosis. Results of an epidemiological study.
Nelson LM, Franklin GM, Jones MC. Risk of multiple sclerosis exacerbation during pregnancy and breast-feeding.
Noseworthy JH, Ebers GC, Vandervoort MK, Farquhar RE, Yetisir E, Roberts R. The impact of blinding on the results of a randomized, placebo-controlled multiple sclerosis clinical trial.
Olerup O, Hillert J, Fredrikson S, Olsson T, Kam-Hansen S, Moller E, et al. Primarily chronic progressive and relapsing/remitting multiple sclerosis: two immunogenetically distinct disease entities.
Patzold U, Pocklington PR. Course of multiple sclerosis. First results of a prospective study carried out on 102 multiple sclerosis patients from 1976–1980.
Phadke JG. Survival pattern and cause of death in patients with multiple sclerosis: results from an epidemiological survey in north east Scotland.
Poser S, Poser W, Schlaf G, Firnhaber W, Lauer K, Wolter M, et al. Prognostic indicators in multiple sclerosis.
Poser S, Kurtzke JF, Poser W, Schlaf G. Survival in multiple sclerosis.
Revesz T, Kidd D, Thompson AJ, Barnard RO, McDonald WI. A comparison of the pathology of primary and secondary progressive multiple sclerosis.
Robertson NP, Clayton D, Fraser M, Deans J, Compston DA. Clinical concordance in sibling pairs with multiple sclerosis.
Runmarker B, Andersen O. Prognostic factors in a multiple sclerosis incidence cohort with twenty-five years of follow-up.
Runmarker B, Andersen O. Pregnancy is associated with a lower risk of onset and a better prognosis in multiple sclerosis [see comments].
Sackett DL, Haynes RB, Tugwell P. Making a prognosis. In: Sackett DL, Haynes RB, Tugwell P. Clinical epidemiology: a basic science for clinical medicine. Boston: Little, Brown; 1985. p. 159–69.
Shepherd DI, Downie AW. A further prevalence study of multiple sclerosis in north-east Scotland.
Thompson AJ, Kermode AG, MacManus DG, Kingsley DP, Kendall BE, Moseley IF, et al. Pathogenesis of progressive multiple sclerosis [letter].
Verdru P, Theys P, D'Hooghe MB, Carton H. Pregnancy and multiple sclerosis: the influence on long term disability.
Weinshenker BG, Bass B, Rice GP, Noseworthy J, Carriere W, Baskerville J, et al. The natural history of multiple sclerosis: a geographically based study. 1. Clinical course and disability.
Weinshenker BG, Bass B, Rice GP, Noseworthy J, Carriere W, Baskerville J, et al. The natural history of multiple sclerosis: a geographically based study. 2. Predictive value of the early clinical course.
Weinshenker BG, Bulman D, Carriere W, Baskerville J, Ebers GC. A comparison of sporadic and familial multiple sclerosis.
Weinshenker BG, Rice GP, Noseworthy JH, Carriere W, Baskerville J, Ebers GC. The natural history of multiple sclerosis: a geographically based study. 3. Multivariate analysis of predictive factors and models of outcome.
Weinshenker BG, Rice GP, Noseworthy JH, Carriere W, Baskerville J, Ebers GC. The natural history of multiple sclerosis: a geographically based study. 4. Applications to planning and interpretation of clinical therapeutic trials.
Whitacre CC, Blankenhorn E, Brinley FJ, Collier E, Duquette P, Fox H, et al. Sex differences in autoimmune disease: focus on multiple sclerosis. Science. In press 1999.

