


Abstract
Idiopathic Parkinson's disease (PD) is often accompanied by a pattern of executive deficits similar to those found in patients with frontal lobe lesions. We investigated whether such cognitive deficits are attributable to frontal lobe dysfunction as a direct consequence of impaired mesocortical dopaminergic transmission or an indirect consequence of impaired nigrostriatal dopaminergic function. For this purpose, changes in synaptic dopamine levels during task performance were monitored using a marker of dopamine D2-receptor availability 11C-raclopride (RAC) PET. During RAC PET, seven patients with early symptomatic PD and seven age-matched healthy controls performed two types of behavioural task, a spatial working memory task (SWT) and a visuomotor control task (VMT). The SWT involves an executive process which is known to be impaired by both frontal lobe lesions and PD while the VMT is a control test for the visuomotor component of the SWT. Parametric images of RAC binding potential during performance of each task were generated, and compared between the tasks using voxel-based statistical parametric mapping as well as region of interest analysis. In controls, RAC binding was reduced in the dorsal caudate during performance of the SWT compared with the VMT, compatible with increased levels of endogenous dopamine release due to the executive process. In PD patients, this RAC binding reduction was not observed. In contrast, RAC binding in the anterior cingulate cortex within the medial prefrontal cortex was reduced by a comparable level during the SWT both in controls and PD patients. Statistical comparisons between controls and PD patients confirmed significantly attenuated dopamine release in the dorsal caudate in PD, but preserved levels of medial prefrontal dopamine release. Our data suggest that executive deficits in early patients with PD are associated with impaired nigrostriatal dopaminergic function resulting in abnormal processing in the cortico-basal ganglia circuit. In contrast, mesocortical dopaminergic transmission appears well preserved in early PD patients.
Introduction
Idiopathic Parkinson's disease (PD) is often accompanied by deficits of executive functions along with motor symptoms even in early stages of the disease (Brown and Marsden, 1990; Sawamoto et al., 2002). These cognitive deficits are similar to those seen in patients with frontal lobe lesions (Owen et al., 1992). Since the pathological hallmark of PD is degeneration of ascending projections of the midbrain dopamine neurons, it seems possible that such deficits are attributable to frontal lobe dysfunction as a direct consequence of impaired meso-frontal dopaminergic transmission or a secondary consequence of impaired nigro-striatal dopaminergic function.
Anatomical and physiological evidence suggests that motor and cognitive processes originating from the frontal cortex are facilitated by parallel loops that link the cortex to the basal ganglia and thalamus (Alexander et al., 1986). Human and monkey data show that the presence of dopamine deficiency in the motor portion of the striatum alters the pattern of neuronal discharges of cortico-basal ganglia projections (Wichmann and DeLong, 2003). It is proposed that these altered neural discharges are the correlate of motor symptoms in PD. Given this, it seems plausible that the executive deficits in PD also result from dopamine deficiency in the cognitive portion of the striatum causing functional disruption of cortico-basal ganglia loops (Owen et al., 1998; Dagher et al., 2001; Lewis et al., 2003; Sawamoto et al., 2007).
An alternative hypothesis, however, is that the cognitive deficits reflect a functional disturbance of the frontal cortex itself caused by locally impaired dopaminergic transmission (Mattay et al., 2002). Animal studies have demonstrated that dopamine in the frontal cortex plays an essential role in modulating cognitive processes, especially working memory (Murphy et al., 1996; Watanabe et al., 1997). In addition, levels of dopamine in the frontal cortex of PD patients are found to be reduced at post-mortem although the reductions are not as severe as those seen in the striatum (Scatton et al., 1982).
The aim of the present study was to investigate whether the cognitive deficits in early patients with PD are associated with impaired dopaminergic transmission in the striatum or frontal cortex or both. For this purpose, we monitored changes in regional synaptic dopamine levels using a marker of D2-receptor availability 11C-raclopride (RAC) PET (Sawamoto et al., 2004). During RAC PET, patients with PD and age-matched healthy controls conducted a spatial working memory task (SWT: Fig. 1) (Owen et al., 1992) and a visuomotor control task (VMT). The SWT involves an executive process which has been shown to be impaired by both frontal lobe lesions and PD. It has also been reported that the performance deterioration of the SWT in PD patients is ameliorated by dopamine replacement therapy suggesting that the deterioration is attributable, at least in part, to dopamine deficiency (Lange et al., 1992). We applied the VMT as a control test for the visuomotor component of the SWT.
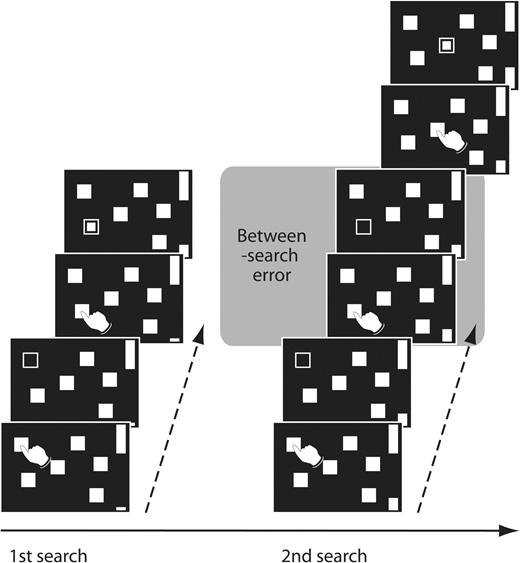
The spatial working memory task (SWT). Subjects searched through arrays of boxes in order to discover a token hidden inside one of the boxes. Once a token had been found, subjects began a next search without returning to boxes which had already contained a token. There were two types of search errors: subjects may return to a box already opened in the same search (within-search error), or return to a box in which a token has already been found during the previous searches (between-search error).
The present PET methodology utilizing competition between endogenous dopamine and RAC was crucial for evaluating regional dopaminergic transmission linked to task performance. Previous activation studies with H215O PET and functional MRI have measured a signal related to blood flow changes during tasks to infer the neuroanatomy of dopaminergic transmission (Owen et al., 1998; Dagher et al., 2001; Cools et al., 2002; Mattay et al., 2002; Lewis et al., 2003; Monchi et al., 2004, 2007; Sawamoto et al., 2007). However, blood flow changes can reflect brain activity both in the primary site of dopaminergic transmission and also in the areas indirectly affected. In addition, blood flow can either increase or decrease in response to dopamine release depending on whether the transmission leads to excitatory or inhibitory post-neuronal consequences (Groves et al., 1995; Wichmann and DeLong, 2003). It is, therefore, difficult to correlate local blood flow with changes in dopaminergic transmission. The present RAC PET methodology allows us to examine dopaminergic transmission more directly by evaluating changes in D2-receptor availability rather than a signal related to blood flow.
Materials and Methods
Subjects
We studied seven early PD patients (mean ± SD; age 53.9 ± 8.2, one female; Table 1) diagnosed according to UK PD Society Brain Bank criteria (Hughes et al., 1992), and seven age-matched healthy control subjects (age 51.4 ± 7.6, four females). The patients were examined in a practically defined off state after withdrawal of l-dopa/carbidopa and selegiline for at least 12 h and dopamine agonists for at least 24 h. Subjects were screened for dementia using Mini-Mental State Examination (PD patients 28.9 ± 2.0, controls 29.4 ± 1.1) and spatial short-term memory task (PD patients 5.0 ± 1.4, controls 6.4 ± 1.6) from the Cambridge Neuropsychological Test Automated Battery (Lange et al., 1992; Owen et al., 1992). Subjects were asked to abstain from nicotine and caffeine on the day of the scan. All subjects were right-handed, and none of them had a history of any neurological or psychiatric disorders other than PD. All gave written informed consent in accordance with the dictates of the Hammersmith Hospitals Trust Ethics Committee. Permission to administer radioactive RAC was obtained from the Administration of Radioactive Substances Advisory Committee of the United Kingdom.
Clinical characteristics of the Parkinson's disease patients
| Patient no | Age (year) | Duration since diagnosed (year) | UPDRS total score | Medication (per day) |
|---|---|---|---|---|
| 1 | 54 | 4.5 | 12 | Ropinirole 4.5 mg |
| 2 | 38 | 3.0 | 27 | Ropinirole 4.5 mg |
| 3 | 53 | 0.5 | 11 | None |
| 4 | 58 | 3.5 | 26 | Ropinirole 8 mg |
| 5 | 60 | 0.3 | 18 | None |
| 6 | 51 | 2.3 | 16 | l-DOPA 600 mg, Selegiline 1.25 mg |
| 7 | 63 | 5.3 | 36 | None |
| Mean (SD) | 53.9 (8.2) | 2.8 (1.9) | 20.9 (9.1) |
UPDRS = Unified Parkinson's Disease Rating Scale. The scale was assessed just before the PET scans.
l-DOPA was prescribed in combination with peripheral decarboxylase inhibitor (carbidopa).
Behavioural tasks
We measured RAC binding potentials (BP) during two types of behavioural tasks; the SWT and VMT. The SWT was taken from the Cambridge Neuropsychological Test Automated Battery, a suite of computerized cognitive tasks (Lange et al., 1992; Owen et al., 1992). The tasks were presented on a touch-sensitive monitor suspended within ∼30 cm reach.
During the SWT, subjects were required to collect blue tokens hidden inside arrays of red boxes (Fig. 1) (Lange et al., 1992; Owen et al., 1992). For each search, a single token was hidden in one of these boxes. Subjects opened the boxes by touching each one with their right index finger in order to reveal their contents. Once a token had been found, it was transferred to fill an empty column on the side. Then, subjects started a new search to collect the next token. A key instruction was that in successive searches the boxes in which subjects had already found a token would not be used again to hide a token. Thus, subjects had to remember the previous token location and develop a search strategy. Two types of search error were possible: within- and between-search error. Within-search errors occurred when subjects returned to a box already opened in the same search. Between-search errors occurred when subjects returned to a box in which a token had already been found in previous searches. In a trial, each box was used once to hide a token. When subjects had found tokens in all the boxes, a new array of red boxes was presented. Therefore the number of boxes corresponded to the number of tokens to be collected. Four, six or eight randomly located boxes were presented in a pseudorandom order, in succession without a pause. To control for the number of touches across individuals, the number of locations visited before a token came up was determined by the computer program excluding errors. To control the task speed, each touch was paced by an auditory tone generated every 3 s.
In the VMT, the same series of arrays of red boxes as for the SWT were presented. Once every 3 s, one of the boxes was highlighted by opening it with an auditory tone in a random sequence. Subjects were instructed simply to touch the box in order to close it by using the right index finger. The number of touches required for each array of red boxes corresponded to the number of touches required in the SWT excluding errors. Thus, the number of touches for a particular array of red boxes was different between the VMT and SWT if subjects make erroneous responses in the SWT. However, the total number of motor responses required during the whole scanning period was same between the two tasks since motor responses were cued every 3 s during the scans. The VMT task was used as a visuomotor control so that BP changes dependent on the cognitive element of the SWT could be assessed.
Behavioural data analysis
Performance of the SWT was evaluated by counting the number of between-search errors in line with previous studies (Lange et al., 1992; Owen et al., 1992). The averaged numbers of between-search errors corresponding to four, six and eight box trials were submitted to repeated measures analysis of variance (RM-ANOVA) applying a Greenhouse–Geisser correction, with the groups as a between-subject factor and with search box size (i.e. four, six and eight boxes) as a within-subject factor. Differences with a P value less than 0.05 were considered statistically significant.
Imaging protocol
PET scans were performed using an ECAT EXACT HR++ tomograph (CTI/Siemens 966; Siemens, South Iselin, NJ) in three-dimensional mode, acquiring 95 slice images with an interslice spacing of 2.42 mm (Spinks et al., 2000). Subjects were scanned twice on separate days, and each scan was assigned to one of the two behavioural tasks in a random order. The tasks started 5 min prior to the injection of RAC, and continued until the end of the scans (Morris et al., 1995; Goerendt et al., 2003). PET data were acquired in list mode (event-by-event) with post-acquisition frame re-binning in order to obtain 19 sequential frames over 60 min (1 × 15 s, 1 × 5 s, 1 × 10 s, 1 × 30 s, 4 × 60 s, 11 × 300 s time frames), beginning at the time of bolus injection of 185 MBq RAC intravenously. Head movement during the scan was minimized with an elastic head band restraint. Involuntary head movement was monitored using a Polaris system (Northern Digital Inc.) and corrected post acquisition with list mode motion correction followed by frame-by-frame realignment (Kinahan and Rogers, 1989; Montgomery et al., 2006; Thielemans et al., 2006). The data were corrected for effects of radiation attenuation using a 5 min transmission scan with a rotating 137Cs source prior to radioligand injection. The dimensions and pixel size of the reconstructed images were 128 × 128 pixels and 2.10 mm, respectively. The transaxial and axial resolution were 5.9 and 5.1 mm at full-width half-maximum. Magnetic resonance imaging (MRI) T1 structural images were also acquired with 1.0 Tesla scanner (HPQ scanner Marconi Medical Systems, Highland Heights, OH).
Imaging data analysis
Parametric images of RAC BP were generated using a simplified reference region model (Lammertsma and Hume, 1996; Gunn et al., 1997). For the reference region, regular circular (15*15) region of interest (ROI) were defined on each cerebellar hemisphere in five contiguous planes on the integrated RAC image (Sawle et al., 1990; Goerendt et al., 2003). Images were analysed by using statistical parametric mapping (SPM2; Wellcome Department of Cognitive Neuroscience, Institute of Neurology) and Analyze (version 6.0, BRU, Mayo Foundation, Rochester, MN, USA) software.
ROI analysis: MRI structural images were coregistered to the parametric images of each subject by employing an integrated RAC image (Studholme et al., 1997). ROIs were traced on the MRI for the SWT and VMT individually, to obtain BP values for the ventral striatum, dorsal caudate and dorsal putamen (Mawlawi et al., 2001). The boundary between ventral and dorsal striatal structures was defined according to the atlas of Mai et al. (2004). Other boundaries were visually determined. For statistical evaluation, the regionally computed values of BP were submitted to RM-ANOVA applying a Greenhouse–Geisser correction, with the groups as a between-subject factor and with tasks (the SWT and VMT), regions (the ventral striatum, dorsal caudate and dorsal putamen, right and left side individually) as within-subject factors. Then, to examine the group differences in baseline RAC binding in each striatal area, separate unpaired t-tests were used to compare mean values of BP during the VMT between controls and PD patients. In addition, to identify significant changes in synaptic dopamine level associated with cognitive processing during task performance, paired t-tests were used to interrogate mean values of BP during the SWT and VMT for each group. We also evaluated the mean group differences in degree of dopamine release during task performance by comparing percent BP reduction during the SWT relative to the VMT in each ROI with unpaired t-tests. The statistical threshold was set at P-value <0.05.
Voxel-based approach: The BP images associated with SWT and VMT performance were interrogated to localize changes of D2-receptor availability at a voxel level. The BP images were transformed to Montreal Neurological Institute (MNI) space by using a normal template of integrated RAC uptake (Meyer et al., 1999). Then, the spatially transformed BP images were smoothed with a Gaussian filter of 6 mm and were subjected to statistical analysis by applying the general linear model (Friston et al., 1995). Within-group comparisons of mean RAC BP values between the SWT and VMT were performed for both controls and PD patients. A between-group comparison of controls versus PD patients evaluated the difference in BP reductions during the SWT compared to the VMT. Statistical maps were initially generated using a threshold P-value <0.001 uncorrected with minimum cluster threshold of two contiguous voxels for significance. We then conducted a correction for multiple comparisons with a familywise error of P-value <0.05. We set up an a priori hypothesis that the brain areas involved would be those identified as showing significant RAC BP reductions during the SWT compared to the VMT in healthy controls in our previous study (Sawamoto et al., 2004). For the hypothesed areas, we applied a 10 mm diameter sphere small volume correction centred at the statistical peaks of the reduction.
The magnitude of BP changes was further examined in clusters showing a significant decrease with relation to SWT performance. Voxels with peak Z values showing a significant decrease in the SWT compared with the VMT were identified in the striatum and frontal cortex based on the above analysis in each group. If no significant decreases in activity were observed for either one of the two groups, then the coordinates of the peak Z values in the other group were employed to represent the activity of the area. The BP values were subjected to RM-ANOVA applying a Greenhouse–Geisser correction, with the groups as a between-subject factor and with the tasks as a within-subject factor. A critical P-value of 0.05 was used to test the statistical significance. Statistical analysis was performed with the SPSS program (SPSS Inc., Chicago, IL, USA) on a personal computer.
Results
The behavioural performance of the SWT progressively worsened as the number of boxes in arrays increased for both controls and PD patients (RM-ANOVA; box size—df = 1.23, F = 36.74, P < 0.001; Fig. 2). PD patients tended to make more between-search errors than controls at four boxes and the group differences widened as the number of boxes was increased to six and eight, although neither main effect of groups nor interaction of groups and box size reach statistical significance (RM-ANOVA; groups—df = 1, F = 1.09, P = 0.32; groups × box size—df = 1.23, F = 0.63, P = 0.47). These findings are generally in agreement with previously reported data on the performance of the SWT testing larger numbers of controls and PD patients (Owen et al., 1992).
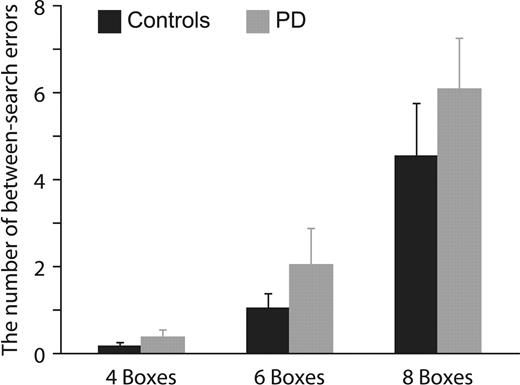
The averaged number of between-search errors corresponded to a four-, six- and eight-box trial. The number of between-search errors in PD patients tended to be more than controls especially at six- and eight-box trials, although group difference did not reach statistical significance. Error bars indicate standard error of mean.
ROI analysis of RAC BP for the entire data set demonstrated no main effect of groups (RM-ANOVA; df = 1, F = 0.10, P = 0.76) but a significant main effects of tasks (df = 1, F = 13.21, P < 0.01) and regions (df = 2.72, F = 50.21, P < 0.001). The analysis revealed that interactions among groups, tasks and regions did not reach a statistically significant level (df = 2.88, F = 1.98, P = 0.14). Separate unpaired t-tests also showed that RAC BPs were not different between controls and PD patients during VMT performance (ventral striatum: left—df = 12, t = −0.02, P = 0.98, right—df = 12, t = −0.12, P = 0.91; dorsal caudate: left—df = 12, t = 0.06, P = 0.96, right—df = 12, t = −0.34, P = 0.74; dorsal putamen: left—df = 12, t = 0.85, P = 0.41, right—df = 12, t = 0.72, P = 0.48). This lack of group difference is in apparent conflict with a previous study which detected attenuated dopamine release during hand movements in PD patients (Goerendt et al., 2003). However, since that study evaluated, as a measure of dopamine release, within-subject BP changes due to hand movements rather than comparing between-subject BP differences during hand movements as examined here, our failure to detect group differences may simply reflect our reduced power. Paired t-tests revealed significant RAC BP decreases during the SWT compared to the VMT in the right dorsal caudate (df = 6, t = −4.18, P < 0.01) and ventral striatum (df = 6, t = −4.34, P < 0.01) in controls (Table 2). Decreases were also seen in these areas in PD but these were not significant (right dorsal caudate—df = 6, t = −1.92, P = 0.10; right ventral striatum—df = 6, t = −1.40, P = 0.21). The degree of percentage BP reduction during the SWT relative to the VMT tended to be smaller in the right dorsal caudate and ventral striatum in PD patients, although the group differences did not reach a statistically significant level (unpaired t-tests; ventral striatum: left—df = 12, t = −0.26, P = 0.80, right—df = 12, t = 1.57, P = 0.14; dorsal caudate: left—df = 12, t = −0.84, P = 0.42, right—df = 12, t = 1.51, P = 0.16; dorsal putamen: left—df = 12, t = −0.52, P = 0.61, right—df = 12, t = 1.14, P = 0.28).
Effect of behavioural conditions on 11C-raclopride binding potential; region of interest analysis in the striatum
| Controls | PD patients | |||||||||||
|---|---|---|---|---|---|---|---|---|---|---|---|---|
| Ventral striatum | Dorsal caudate | Dorsal putamen | Ventral striatum | Dorsal caudate | Dorsal putamen | |||||||
| L | R | L | R | L | R | L | R | L | R | L | R | |
| SWT | 2.04 (0.22) | 1.97a (0.21) | 2.21 (0.21) | 2.11a (0.16) | 2.53 (0.22) | 2.55b (0.26) | 2.01 (0.46) | 2.05 (0.39) | 2.13 (0.48) | 2.12 (0.48) | 2.72 (0.61) | 2.81 (0.64) |
| VMT | 2.08 (0.23) | 2.17 (0.29) | 2.25 (0.20) | 2.29 (0.21) | 2.57 (0.28) | 2.67 (0.29) | 2.08 (0.49) | 2.15 (0.52) | 2.27 (0.60) | 2.22 (0.53) | 2.83 (0.74) | 2.87 (0.69) |
| Δ (%) | −2.09 | −9.00 | −2.02 | −7.63 | −1.35 | −4.21 | −3.03 | −3.21 | −4.87 | −3.80 | −2.69 | −1.48 |
Data represent mean (SD). SWT = Spatial working memory task, VMT = Visuomotor control task.
Reduction of 11C-raclopride binding potential during the SWT compared to the VMT at P < 0.01 (a) and P < 0.05 (b) in paired t-test. Δ indicates changes in binding potential given in percentage from values after the VMT.
The voxel-based SPM approach showed generally parallel results to the ROI analysis (Fig. 3 and Table 3). Within-group comparisons showed that during the SWT when compared to the VMT, RAC BP decreased significantly in the right dorsal caudate in controls whereas this decrease was not observed in PD patients. RAC BP decreased significantly in the right anterior cingulate cortex (ACC) within the medial prefrontal cortex in both groups. No significant RAC BP decreases were detected in other brain areas in either group. A between-group comparison demonstrated that the magnitude of BP decrease was greater in controls than PD patients in the dorsal caudate but not in the ACC.
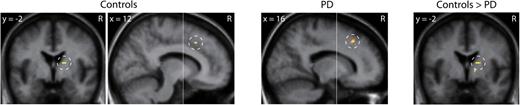
Brain areas exhibiting reduction in 11C-raclopride binding potential during the spatial working memory task compared to the visuomotor control task. Within-group comparison showed reduction in the dorsal caudate in controls and the anterior cingulate cortex both in controls and patients with PD. Between-group comparison showed greater reduction in the dorsal caudate in controls than in patients with PD. Statistical parametric maps were superimposed on the averaged MRI slice images. The vertical anterior-commissural line is shown as a white line. R, the subject's right side.
Brain regions showing reductions in 11C-raclopride binding potential during the spatial working memory task compared to the visuomotor control task; statistical parametric mapping analysis
| Within-group comparison | Between-group comparison | ||||||||||||
|---|---|---|---|---|---|---|---|---|---|---|---|---|---|
| Controls | PD patients | Controls > PD patients | |||||||||||
| Regions (Brodmann area) | x | y | z | Z score | x | y | z | Z score | x | y | z | Z score | |
| Dorsal caudate | R | 16 | −2 | 12 | 3.42 | 18 | −2 | 12 | 3.64 | ||||
| Medial prefrontal cortex (32) | R | 12 | 20 | 42 | 3.35 | 16 | 22 | 42 | 3.22 | ||||
We plotted RAC BP during the SWT and VMT in regions showing significant changes (Fig. 4). RAC BP decreased during the SWT compared with the VMT in the dorsal caudate in controls but not in patients with PD. In contrast, RAC BP decreased in the ACC in both groups. This visual impression was supported by a statistical evaluation since RM-ANOVA demonstrated an interaction between the groups and tasks in the dorsal caudate (df = 1, F = 24.69, P < 0.001) but not in the ACC (df = 1, F = 0.07, P = 0.79).
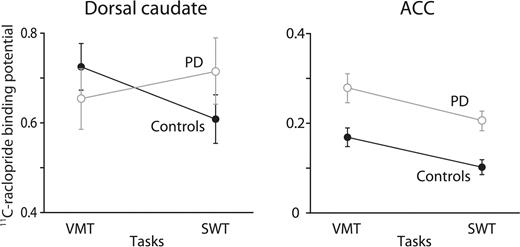
The values of 11C-raclopride binding potential during the spatial working memory task (SWT) and the visuomotor control task (VMT) in the right dorsal caudate and the right anterior cingulate cortex (ACC). Error bars indicate standard error of mean.
The present findings were obtained from seven controls and seven patients. It has been suggested that the price one pays for using a relatively small sample size of seven subjects in voxel-based SPM approach, when compared with larger sample sizes such as 33, is an increase in false negatives rather than false positives in H215O PET activation studies (Andreasen et al., 1996). The false negatives mainly occur in regions that have a smaller Z score and so fail to reach the statistical threshold for significance. Accordingly, one might argue that in our study the RAC reduction seen in the dorsal caudate of PD patients during visual searching was falsely judged to be non-significant at the current threshold. However, we feel this is unlikely as the average RAC BP in the dorsal caudate in PD patients did not decrease during the SWT (Fig. 4).
The ROI analysis identified BP decreases during the SWT compared with VMT not only in the right dorsal caudate but also in the right ventral striatum and dorsal putamen in controls (Table 2). However, the voxel-based approach judged neither the ventral striatum nor dorsal putamen to be statistically significant. The failure to localise statistically significant changes in these regions with the voxel based approach might be attributable to more stringent statistical threshold than the ROI analysis or the low power provided by the small number of participants. The contribution of those areas, therefore, should be investigated in future studies.
Discussion
Binding of RAC to dopamine D2 receptors was reduced in the dorsal head of caudate during the spatial working memory task compared with the visuomotor control task in healthy controls. This reduction was not observed in early patients with PD. In contrast, RAC binding in the ACC within the medial prefrontal cortex was reduced during the spatial working memory task both in controls and PD patients by a comparable level. The lack of RAC reduction in the dorsal caudate is unlikely to reflect motor impairments in PD since they were taken into account by subtracting the pattern of RAC activity during the visuomotor control task and the dorsal caudate is a non-motor area. Additionally, the BP reduction was observed in the right hemisphere ipsilateral to the side of the movement. Thus, it is conceivable that the different patterns of dopaminergic transmission found between controls and PD patients in the dorsal caudate reflect the executive processing involved in the spatial working memory task.
Interpretation of neuroimaging findings of behaviourally impaired patients is influenced by task performance (Price and Friston, 1999). It has been reported that performance of the spatial working memory task deteriorates as PD progresses. Our present data showed relatively preserved performance of the spatial working memory task in early PD patients and so the lack of RAC reduction in the dorsal caudate is unlikely to reflect the absence of required performance. Instead, the lack of RAC reduction may imply that the dopaminergic transmission is not essential for this task. However, this is unlikely since several lines of evidence suggest a link between dopamine depletion in the caudate nucleus and deficits in cognitive tasks sensitive to frontal lobe function including working memory in PD (Collins et al., 2000; Bruck et al., 2001; Cheesman et al., 2005; Frank, 2005; O’Reilly and Frank, 2006). Therefore, we interpret the present findings as showing that the executive deficits in PD are associated with impaired dopaminergic transmission in the dorsal caudate resulting in abnormal processing in the cortico-basal ganglia loop.
The present RAC PET findings of healthy controls suggest that dopaminergic transmission in the dorsal caudate and medial prefrontal cortex is involved in performance of working memory (Sawamoto et al., 2004). This idea is supported by H215O PET and functional MRI studies showing blood flow increases in the striatum and medial prefrontal cortex during performance of working memory tasks (Owen et al., 1996; Postle and D’Esposito, 1999, 2003). The idea is also supported by behavioural observations of patients with both striatal and frontal lobe lesions who are found to suffer from working memory deficits (Owen et al., 1990; Lawrence et al., 1996; Levitt et al., 2002).
A role for dorsal caudate and medial prefrontal cortex dopaminergic transmission in working memory is also in accord with biologically based computational models. One model proposes that dopamine D2 transmission in the dorsal striatum influences the updating mechanism of working memory in the prefrontal cortex via basal ganglia thalamocortical circuits (Frank, 2005; O’Reilly and Frank, 2006). Another model proposes that phasic activation of D2 receptors in the prefrontal cortex is involved in updating of contextual information at the site by decreasing inhibition of afferent information (Seamans et al., 2001; Ridderinkhof et al., 2004; Seamans and Yang, 2004; O’Reilly, 2006). These series of biological and computational approaches imply that dopaminergic transmission in the dorsal caudate and medial prefrontal cortex plays a critical role in performance of working memory task.
Several lines of evidence propose that reduction of functional dopamine release in the dorsal caudate, caused by dopamine depletion, impairs executive processing in PD patients. Post-mortem evidence has demonstrated that dopamine is significantly depleted in the dorsal caudate as well as motor subdivision of the striatum in PD (Kish et al., 1988). In vivo PET evidence connects caudate dopamine depletion and executive deficits in PD patients by showing a correlation between reduction in 18F-dopa uptake and deterioration of working memory (Bruck et al., 2001; Cheesman et al., 2005). Evidence from a monkey study further supports a causal relationship between dopamine depletion and executive dysfunction since caudate dopamine loss disturbs the ability to select an appropriate box which hides a reward based on memory of its location (Collins et al., 2000). In addition, H215O PET and functional MRI studies provide evidence that the blood flow response of the caudate nucleus is attenuated when PD patients perform cognitive tasks although the precise neurochemical bases of the signal reduction is uncertain (Dagher et al., 2001; Lewis et al., 2003; Sawamoto et al., 2007). Based on these lines of evidence, the present findings suggest that functional dopamine release in the dorsal caudate is disrupted during executive performance in PD patients.
RAC-binding reductions in the ACC during the spatial working memory task were comparable between healthy controls and early PD patients. The lack of difference may be attributable to an insufficient cognitive load to induce higher levels of dopamine release and differences could conceivably have become apparent by increasing this load. However, this seems unlikely since normal levels of RAC-binding reduction have been reported within frontal areas including the ACC in advanced patients with PD after amphetamine exposure which induces high levels of dopamine release (Piccini et al., 2003). Alternatively, the lack of a difference in RAC BP reductions between the groups in the ACC may reflect the lower signal to noise ratio compared to the striatum. A higher affinity marker of D2-receptor availability could make subtle differences become apparent (Farde et al., 1988; Ito et al., 1999). This view is in line with post-mortem analyses of PD patients which have shown that dopamine levels in the frontal and cingulate cortices are mildly but significantly decreased (Scatton et al., 1982). However, 18F-dopa PET has suggested that dopaminergic terminals in the ACC are hyperactive in early stages of PD and maintain dopamine storage capacity even in advanced stages of PD (Rakshi et al., 1999). This in vivo18F-dopa PET study together with RAC PET findings of the amphetamine and present studies imply that dopaminergic transmission in the ACC is relatively preserved in patients with early PD.
In H215O PET and functional MRI studies, frontal regions subserving working memory tasks showed greater activity in PD patients withdrawn from medication than healthy controls (Mattay et al., 2002; Monchi et al., 2007) and this hyperactivity was normalized after dopamine replacement therapy (Cools et al., 2002; Mattay et al., 2002). Single unit recordings have demonstrated that dopamine depletion in the frontal cortex degrades task related activity relative to background activity at the site (Sawaguchi, 2000). Based on this evidence, it has been speculated that the greater frontal activity in PD patients during executive tasks represents a compensatory response, extraneous neuronal assemblies being recruited to counter the degraded neuronal activity resulting from dopamine depletion. However, this hypothesis is not supported by our present findings as frontal dopamine release seems preserved in PD.
Recently, degraded neuronal activity subserving motor tasks has been demonstrated in the medial premotor cortex of 1-methyl-4-phenyl-1,2,3,6-tetrahydropyridine (MPTP)-treated monkeys where dopamine depletion is most likely to be affecting the frontal cortex indirectly via striatal projection dysfunction (Escola et al., 2003). Therefore, the greater frontal activity seen in untreated PD cases during executive tasks may conceivably be a compensatory response to recover the degraded neuronal activity in the frontal cortex arising from striatal dopamine depletion. A final possibility is that the frontal hyperactivity may represent a switch from defective striatal circuitry to the use of different, intact neuronal circuitry involving frontal non-dopaminergic system (Haslinger et al., 2001). These latter two speculations may be more in tune with our present findings which point to an involvement of striatal rather than frontal dopamine depletion in the cognitive deficits in PD patients.
We demonstrated disturbed striatal dopamine release related to cognitive deficits in PD patients by monitoring synaptic dopamine levels with a D2-receptor radioligand. Since PD is characterized by degeneration of presynaptic dopaminergic terminals with subsequent dopamine depletion in the brain, D1-receptor-mediated transmission is also likely to be affected. The present study did not evaluate dopamine D1 transmission which is known to be involved in cognitive behaviour, especially dependent on lateral prefrontal function (Sawaguchi and Goldman-Rakic, 1991). In addition, the present observation does not rule out possible contribution of other transmitter systems such as the cholinergic and serotonergic systems.
The pattern of dopaminergic transmission in the present study does not support the conclusions of previous H215O PET and functional MRI studies which have proposed that frontal dopamine depletion plays a major role in the cognitive deficits in PD patients. Instead, the present findings support an alternative hypothesis that striatal dopamine depletion is involved in the executive deficits in mildly symptomatic patients with PD. Our findings imply that frontal dopaminergic transmission is relatively preserved in mild PD patients. Therefore, for dopamine replacement therapy the benefit to the striatum and the detrimental effects in the frontal cortex should be properly evaluated since excessive stimulation of dopamine receptors in the frontal cortex may possibly impair its function (Zahrt et al., 1997).
Acknowledgements
We thank S. Ahier, H. McDevitt, A. Blyth and L. Schnorr for their expert help with scanning.
References
Abbreviations:
- MRI
Magnetic resonance imaging
- ROI
region of interest
- SWT
spatial working memory task
- VMT
visuomotor control task
Author notes
*Present address: Human Brain Research Center, Kyoto University Graduate School of Medicine, Shogoin, Sakyo-ku, Kyoto 606-8507, Japan

