


Abstract
Four subtypes of frontotemporal lobar degeneration with TDP-43 immunoreactive inclusions have been described (types A–D). Of these four subtypes, motor neuron disease is more commonly associated with type B pathology, but has also been reported with type A pathology. We have noted, however, the unusual occurrence of cases of type C pathology having corticospinal tract degeneration. We aimed to assess the severity of corticospinal tract degeneration in a large cohort of cases with type C (n = 31). Pathological analysis included semi-quantitation of myelin loss of fibres of the corticospinal tract and associated macrophage burden, as well as axonal loss, at the level of the medullary pyramids. We also assessed for motor cortex degeneration and fibre loss of the medial lemniscus/olivocerebellar tract. All cases were subdivided into three groups based on the degree of corticospinal tract degeneration: (i) no corticospinal tract degeneration; (ii) equivocal corticospinal tract degeneration; and (iii) moderate to very severe corticospinal tract degeneration. Clinical, genetic, pathological and imaging comparisons were performed across groups. Eight cases had no corticospinal tract degeneration, and 14 cases had equivocal to mild corticospinal tract degeneration. Nine cases, however, had moderate to very severe corticospinal tract degeneration with myelin and axonal loss. In these nine cases, there was degeneration of the motor cortex without lower motor neuron degeneration or involvement of other brainstem tracts. These cases most commonly presented as semantic dementia, and they had longer disease duration (mean: 15.3 years) compared with the other two groups (10.8 and 9.9 years; P = 0.03). After adjusting for disease duration, severity of corticospinal tract degeneration remained significantly different across groups. Only one case, without corticospinal tract degeneration, was found to have a hexanucleotide repeat expansion in the C9ORF72 gene. All three groups were associated with anterior temporal lobe atrophy on MRI; however, the cases with moderate to severe corticospinal tract degeneration showed right-sided temporal lobe asymmetry and greater involvement of the right temporal lobe and superior motor cortices than the other groups. In contrast, the cases with no or equivocal corticospinal tract degeneration were more likely to show left-sided temporal lobe asymmetry. For comparison, the corticospinal tract was assessed in 86 type A and B cases, and only two cases showed evidence of corticospinal tract degeneration without lower motor neuron degeneration. These findings confirm that there exists a unique association between frontotemporal lobar degeneration with type C pathology and corticospinal tract degeneration, with this entity showing a predilection to involve the right temporal lobe.
Introduction
The frontotemporal lobar degenerations (FTLD) are a group of heterogeneous pathological disorders that are associated with the frontotemporal dementia (FTD) clinical syndromes (Neary et al., 1998; McKhann et al., 2001; Josephs, 2008; Josephs et al., 2011). Three main proteins have been associated with FTLD, including microtubule-associated protein tau (Hutton et al., 1998), transactive response-DNA–binding protein of 43 kDa (TDP-43) (Arai et al., 2006; Neumann et al., 2006) and fused in sarcoma protein (Neumann et al., 2009). Pathological disorders associated with TDP-43 are subsumed under the umbrella term FTLD-TDP (Mackenzie et al., 2009; Josephs et al., 2011) and account for the majority of cases of FTLD (Josephs et al., 2004; Lipton et al., 2004).
FTLD-TDP can be further subclassified by assessing the distribution and morphological features of the TDP-43 immunoreactive inclusions that define FTLD-TDP, in frontotemporal neocortex and in hippocampal dentate granular cells (Mackenzie et al., 2006; Sampathu et al., 2006). Initially, two different classification schemes were published (Mackenzie et al., 2006; Sampathu et al., 2006), although a recent harmonized classification scheme has linked the two initial schemes (Mackenzie et al., 2011). Based on the harmonized scheme, four subtypes of FTLD-TDP (types A–D) are recognized (Mackenzie et al., 2011). FTLD-TDP type A (MacKenzie type 1, Sampathu type 3) is characterized by a mixture of neuronal cytoplasmic inclusions, short dystrophic neurites and intranuclear inclusions; FTLD-TDP type B (MacKenzie type 3, Sampathu type 2) by a predominance of neuronal cytoplasmic inclusions; FTLD-TDP type C (MacKenzie type 2, Sampathu 1) by a predominance of long thick dystrophic neurites in the neocortex and Pick body-like inclusions in the dentate granular cells of the hippocampus and FTLD-TDP type D by a predominance of intranuclear inclusions. In addition, cases of FTLD-TDP can be independently classified as having motor neuron degeneration (FTLD-MND) (Josephs et al., 2011). Cases of FTLD-MND have characteristic histological features of FTLD, as well as characteristic features of MND, such as Bunina bodies, TDP-43 immunoreactive inclusions in hypoglossal nucleus or anterior horn cells, skein-like and Lewy body-like inclusions, anterior horn cell loss and corticospinal tract degeneration (CSTD) (Josephs et al., 2006). Cases of FTLD-MND are almost always associated with type B pathology (Mackenzie et al., 2006; Snowden et al., 2007; Geser et al., 2009; Josephs et al., 2009), although a few cases have been associated with type A pathology (Cairns et al., 2007; Whitwell et al., 2010), particularly when associated with a hexanucleotide repeat expansion sequence in the chromosome 9 opening reading frame (C9ORF72) gene (Murray et al., 2011).
For the past 3 years, however, we have observed cases of FTLD-TDP type C pathology associated with severe corticospinal tract degeneration (CSTD) but without other features of MND (Josephs et al., 2009). Such cases have not been previously emphasized. To better understand this unusual combination of histological features, we aimed to assess the severity of CSTD in a large cohort of cases with FTLD-TDP type C, and to determine what proportion of cases have moderate to severe CSTD. This is important, as cases with FTLD-TDP type C with moderate to severe CSTD would be atypical and could represent a distinct FTLD entity. We aimed to assess clinical, genetic and imaging features of these cases compared with those with absent or equivocal to mild CSTD.
Materials and methods
Subject selection
The neuropathological databases at Mayo Clinic Rochester, MN and Jacksonville, FL, USA were queried to identify all cases with FTLD-TDP type C pathology. A total of 32 cases were identified.
Standard neuropathological procedure
All patients underwent standardized neuropathological evaluation using the recommended diagnostic protocol for Alzheimer’s disease (Mirra et al., 1991). Pathological diagnoses were conducted by one of our two experienced neuropathologists (J.E.P. or D.W.D.). After removal, the brain was divided into right and left hemibrains. One hemibrain was fixed in 10% buffered formaldehyde for 7 to 10 days, and then sectioned. In all cases, we sampled mid-frontal, superior temporal, inferior parietal and occipital cortex, amygdala, hippocampus and cingulate gyrus, nucleus basalis, basal ganglia, thalamus, midbrain, pons, medulla and cerebellum. Samples were processed in paraffin and stained with haematoxylin and eosin and modified Bielschowsky or Gallyas silver impregnation, and they were immunostained with antibodies to amyloid-β (clone 6F/3D, 1:10 dilution; Novocastra Vector Labs), phospo-tau (CP-13, 1:100, Peter Davies, Albert Einstein College of Medicine or clone AT8, 1:1000 dilution; Endogen), α-synuclein [NACP, 1:3000 (Gwinn-Hardy et al., 2000; Beach et al., 2008) or LB509, 1:200 dilution; Zymed], neurofilament (SMI-31, 1:20 000, Sternberger–Meyer or clone 2F11, 1:75 dilution; Dako), ubiquitin (Ubi-1, 1:40 000, EnCor Biotechnology or Dako polyclonal, 1:100 dilution) and TDP-43 (rabbit polyclonal, 1:3000; ProteinTech group or a custom made rabbit polyclonal to C-terminal epitope; Zhang et al., 2009).
All 32 cases were re-stained for this study with an anti-TDP-43 antibody to a C-terminal epitope (Zhang et al., 2009) that permits visualization of pathological TDP-43 without normal nuclear staining, and they were re-reviewed by one neuropathologist (D.W.D.) to ensure that all cases met the most recent published criteria for FTLD-TDP type C pathology (Mackenzie et al., 2011). Specifically, there had to be long thick dystrophic neurites throughout laminar I–VI of the frontotemporal neocortex and Pick body-like neuronal cytoplasmic inclusions in dentate granular cells of the hippocampus (Fig. 1) (Josephs et al., 2009). Features of MND, such as Bunina bodies, TDP-43 immunoreactive inclusions in hypoglossal nucleus, nucleus ambiguus or anterior horn cells, skein-like and Lewy body-like inclusions, anterior horn cell loss and CSTD, were assessed. The presence of neuronal intranuclear inclusions was assessed. Eleven randomly selected cases were independently reviewed by another neuropathologist (J.E.P.) with 100% concordance for the diagnosis of FTLD-TDP type C.
Histological findings included long thick dystrophic neurites in neocortex (A) and Pick body-like inclusions in hippocampal dentate granular cells (B). High power ×400 magnification.
To assess the specificity of the findings to FTLD-TDP type C pathology, we also assessed the corticospinal tract and hypoglossal nucleus of the medulla in 86 cases of FTLD-TDP type A (n = 61) and B (n = 25). Type A cases were characterized by the presence of dystrophic neurites and neuronal cytoplasmic inclusions typically associated with neuronal intranuclear inclusions (Mackenzie et al., 2009, 2011). Type B cases were characterized by the presence of neuronal cytoplasmic inclusions in the absence of dystrophic neurites (Mackenzie et al., 2009, 2011).
The study was approved by the Mayo Clinic Institutional Review Board, and in all cases, informed consent was given before death.
Semi-quantitative assessment of corticospinal tract degeneration
A paraffin section of brainstem medulla was used to generate slides for histological assessment of the corticospinal tract at the level of the medullary pyramids. In one case, a medulla section was not available; hence, this case was excluded from further analysis. Slides of medulla of the remaining 31 cases were stained with Luxol fast blue to assess for the degree of myelin loss. Immunohistochemistry with ionized calcium binding adaptor molecule 1 (IBA-1) was performed to assess for the presence and burden of activated and phagocytic microglia (Ahmed et al., 2007). A semi-quantitative six-point scale was used to determine the degree of myelin loss observed with Luxol fast blue stain as follows: 0 = no myelin loss; 0.5 = slight loss; 1 = mild loss; 2 = moderate loss; 3 = severe loss; and 4 = very severe loss. A similar six-point scale was used to semi-quantitate activated/phagocytic microglia burden as follows: 0 = no activated/phagocytic microglia observed; 0.5 = scant number of activated/phagocytic microglia; 1 = small number of activated/phagocytic microglia; 2 = a moderate number of activated/phagocytic microglia; 3 = a severe number of activated/phagocytic microglia; and 4 = a very severe number of activated/phagocytic microglia. The concept of including a ‘very severe’ category was based on pathological procedures recommended for assessing severity of cortical α-synuclein pathology in dementia with Lewy bodies (McKeith et al., 2005).
Semi-quantitative assessment of motor cortex degeneration
Sections of motor cortex were available from 22 of the 31 cases. A semi-quantitative four-point scale was used to document the degree of motor cortex degeneration on haematoxylin and eosin, based on the degree of neuronal loss and gliosis, as follows: 0 = none; 1 = mild neuronal loss and gliosis; 2 = moderate neuronal loss and gliosis; and 3 = severe neuronal loss and gliosis with evidence of status spongiosis. We also performed TDP-43 immunohistochemistry and graded the number of TDP-43 immunoreactive inclusions or dystrophic neurites that were present in motor cortex, as follows: 0 = no inclusions/neurites identified; 1 = a few inclusions/neurites present; 2 = moderate number of inclusions/neurites present; and 3 = a striking number of inclusions/neurites present.
Additional pathological analyses
Immunohistochemistry with IBA-1 antibody was performed to assess for the presence and severity of activated and phagocytic microglia (Ahmed et al., 2007) in motor cortex. The presence of myelin loss in the medial lemniscus and the olivocerebellar tract was assessed with Luxol fast blue stain in the same sections used to evaluate CSTD. The presence of axonal loss of the corticospinal tract fibres at the level of the pyramids was assessed with antibodies to phosphorylated neurofilament (SMI-31). The presence of athero- and arteriosclerotic vascular disease throughout the brain was assessed on haematoxylin and eosin stain, Lewy bodies with α-synuclein immunohistochemistry and senile plaques and cerebral amyloid angiopathy with amyloid-β immunohistochemistry or thioflavin-S fluorescent microscopy. Braak and Braak staging (Braak and Braak, 1991) of neurofibrillary pathology was performed based on silver stain (Bielschowsky) or thioflavin-S fluorescent microscopy.
Pathological grouping
All cases were grouped into one of three pathological groups based on the severity of the semi-quantitative analyses of the medullary pyramids as follows: Group 1 = cases without any myelin loss or activated/phagocytic microglia [no corticospinal tract degeneration/CSTD(−)]; Group 2 = cases with slight-mild myelin loss or a scant to small number of activated/phagocytic microglia [equivocal corticospinal tract degeneration/CSTD(±)]; and Group 3 = cases with moderate to very severe myelin loss and a moderate to striking number of activated/phagocytic microglia [definite corticospinal tract degeneration/(CSTD(+)].
Clinical information
The medical records of all 31 FTLD-TDP type C cases were reviewed for the abstraction of clinical information, including demographics, presenting signs and symptoms, signs and symptoms that developed later in the disease course and family history of any neurodegenerative disease. Disease duration was calculated as the difference in time from death to time from first symptom onset as reported by the patient/carer and documented in the medical records. Presence or absence of the following additional signs and symptoms that have been reported in FTLD-TDP was abstracted: prosopagnosia (a report of patient not recognizing family members in the medical records) (Snowden et al., 2004; Josephs et al., 2008b), topographagnosia (difficulty navigating in familial areas/surroundings) and psychosis (hallucinations and delusions) (Claassen et al., 2008; Lillo et al., 2010; Snowden et al., 2012). Bedside cognitive testing scores (Mini-Mental State Examination; Folstein et al., 1975) were recorded, and the motor examinations were specifically reviewed for any evidence of MND, including dysarthria, hyper-reflexia, increased muscle tone, Babinski sign, ankle clonus, fasciculation or muscle weakness. A retrospective clinical diagnosis was rendered, if possible, using the international criteria for FTD (Neary et al., 1998), by an expert behavioural neurologist (K.A.J.) blinded to pathological findings. MRI reports were available in 25 of the 31 cases. Of these 25 cases, 13 had an MRI from our institution, whereas 12 had an MRI at another institution. The findings that had been documented by the radiologists in all 25 cases, based on visual assessment of the pattern of atrophy at the time of clinical assessment, were recorded.
Genetic screening
All 31 cases were screened for genetic mutations in the progranulin gene (GRN) as previously described (Baker et al., 2006) and for the newly described hexanucleotide repeat expansion sequence in the C9ORF72 gene (DeJesus-Hernandez et al., 2011). In brief, for C9ORF72, PCR was performed with 100 ng/µl of genomic DNA in the presence of 1 M betaine (Sigma), 5% dimethyl sulphoxide (Sigma), 5 mM of deoxycytidine triphosphate, deoxyadenosine triphosphate, deoxythymidine triphosphate (Promega) and 7-deaza-2-deoxy-guanosine triphosphate (Roche) in substitution for deoxyguanosine triphosphate. The cycling programme included an initial denaturation at 98°C for 10 min followed by 10 cycles of denaturation at 97°C for 35 s, annealing at 64°C for 2 min and extension at 68°C for 8 min, followed by 25 cycles of denaturation at 97°C for 35 s, annealing at 64°C for 2 min and extension at 68°C for 8 min plus an additional 20 s for each cycle (DeJesus-Hernandez et al., 2011). These two genes were selected, as they are associated with FTLD-TDP pathology.
Quantitative magnetic resonance imaging analysis
A total of 12 cases had undergone an ante-mortem standardized volumetric head MRI protocol at 1.5 T that included a T1-weighted 3D spoiled gradient echo sequence; hence, they were available for quantitative morphometric analysis (age at scan = 67 ± 8 years; 58% female). The first available MRI was used in each case. Each of these subjects was matched by age and gender to two healthy control subjects, resulting in a matched cohort of 24 control subjects (age at scan = 67 ± 7 years, 58% female). All control subjects had undergone the same standardized MRI protocol at 1.5 T.
All images underwent preprocessing that included corrections for gradient non-linearity (Jovicich et al., 2006) and intensity inhomogeneity using both the N3 bias correction (Sled et al., 1998) followed by the Statistical Parametric Mapping (SPM5)-based bias correction. Patterns of grey matter atrophy were assessed using the automated and unbiased technique of voxel-based morphometry (Ashburner and Friston, 2000), implemented using SPM5 (http://www.fil.ion.ucl.ac.uk/spm). Briefly, all images were normalized to a customized template and segmented using unified segmentation (Ashburner and Friston, 2005), followed by the hidden Markov random field clean-up step (Zhang et al., 2001). All grey matter images were modulated and smoothed with an 8-mm full-width at half-maximum smoothing kernel. A full factorial model was used to assess patterns of grey matter loss in each of the FTLD-TDP type C groups compared with control subjects. Results were assessed before and after correction for multiple comparisons using the false discovery rate correction at P < 0.01. As the CSTD(+) group consisted of cases considered to be novel, a direct comparison was also performed comparing this group with a group consisting of all the other FTLD-TDP type C cases [all CSTD(−) and CSTD(±) cases]; assessed uncorrected at P < 0.001.
In addition, atlas-based parcellation was applied using SPM5 and an in-house modified version of the automated anatomic labelling atlas (Tzourio-Mazoyer et al., 2002), as previously described (Whitwell et al., 2009), to generate grey matter volumes for specific regions; selected based on the voxel-based morphometry results. First, grey matter volume was calculated for the left and right temporal lobes. An asymmetry score was also calculated as follows: (left temporal lobe volume − right temporal lobe volume) × 2/(left temporal lobe volume + right temporal lobe volume), as previously published (Whitwell et al., 2010). Second, grey matter volume was calculated for the left and right motor cortex. All regional volumes were divided by total intracranial volume to correct for differences in head size.
Statistical methods
Statistical analyses were performed using the JMP computer software (JMP Software, version 8.0.0; SAS Institute Inc) with α set at 0.05 two-tailed. All binary data were compared across groups with Pearson’s χ2 test; Fisher’s exact test for any analysis with small numbers. Kruskal–Wallis test was performed across all three groups for analysis of continuous data and, if significant, was followed by Mann–Whitney U-test comparisons across two groups. Spearman Rank order correlation was used to correlate degree of myelin loss and activated/phagocytic microglia burden and to correlate myelin loss and activated/phagocytic microglia burden to disease duration. Logistic regression analysis was used to determine whether MRI volumes predicted the CSTD(+) group, after adjusting for disease duration. Linear regression analysis was used to determine whether there was a difference in Luxol fast blue/IBA-1 severity across groups after adjusting for disease duration.
Results
Pathological groupings
A total of 31 cases of FTLD-TDP type C were analysed for this study. On gross brain examination, there was often striking atrophy of the anterior medial and inferior temporal lobe with relative sparing of the hippocampus (Fig. 2). Of the 31 cases, 74% showed evidence of some corticospinal tract pathology, ranging from mild to very severe. Eight cases were determined to not have any corticospinal tract pathology and were, therefore, classified as CSTD(−). Fourteen cases showed equivocal CSTD and were classified as CSTD(±). The remaining nine cases showed moderate to very severe myelin loss and a moderate to striking number of lipid-laden macrophages; hence, they had definite CSTD and were classified as CSTD(+).
On gross brain inspection, there was evidence of anterior medial and inferior temporal atrophy, with enlargement of the temporal horn.
Corticospinal tract findings
Semi-quantitative analyses revealed that the degree of corticospinal tract degeneration was significantly different across the three groups (Table 1) without any difference between the CSTD(±) and CSTD(−) groups. A representative case from each of the three groups showing CSTD findings is shown in Fig. 3. There was no overlap in the average Luxol fast blue and IBA-1 scores between the nine CSTD(+) cases and the remaining 22 cases (Fig. 4). As expected, there was a significant correlation between myelin loss and activated/phagocytic microglia severity (r = 0.9, P < 0.0001). The average myelin loss/activated/phagocytic microglia severity did correlate to disease duration across all 31 cases (r = 0.6, P = 0.004). However, when both disease duration and group was put in a linear regression model as predictors and average myelin loss/activated/phagocytic microglia severity as the outcome, group was a much stronger predictor (P < 0.0001) compared with disease duration (P = 0.04). In other words, after adjusting for disease duration, there remained a strong association between group and average Luxol fast blue/IBA-1 severity.
Histological findings from a representative case from each of the three groups. A CSTD(−) case shows normal myelination of medial lemniscus and olivocerebellar fibres (A), normal myelination of corticospinal tract fibres (B), and only resting microglia, but no activated or phagocytic microglia (C). A CSTD(±) case shows normal myelination of medial lemniscus and olivocerebellar fibres (D), subtle evidence of myelin loss (E) with rare activated and phagocytic microglia (F). A CSTD(+) case shows normal myelination of medial lemniscus and olivocerebellar fibres (G), severe myelin loss (H) with numerous activated and phagocytic microglia (I). Luxol fast blue stain (A, B, D, E, G and H) and actin binding protein IBA-1 antibody (C, F and I). Sections taken at the level of the medullary pyramids. Magnification ×200 for all images.
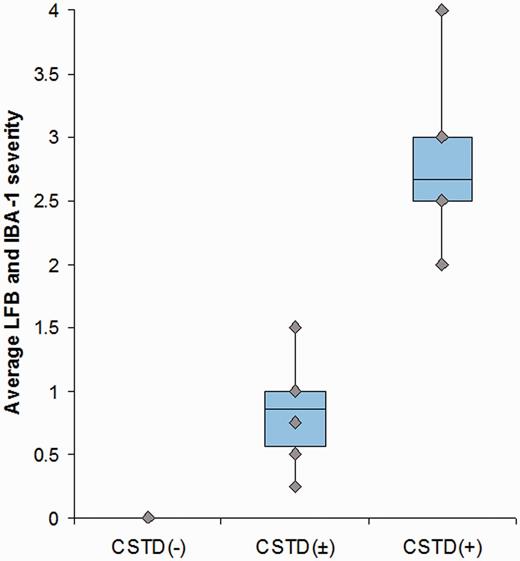
Box-plot showing the average Luxol fast blue/IBA-1 severity in the CSTD(−), CSTD(±) and CSTD(+) cases. Boxes represent 25th and 75th percentiles with means for all 31 cases. Whiskers extend to minimum and maximum values. Plots show no overlap in values between the nine CSTD(+) cases and the remaining 22 cases. LFB = Luxol fast blue.
Semi-quantitative findings in the 31 cases of FTLD-TDP type C by group
| CSTD(+) (n = 9) | CSTD(±) (n = 14) | CSTD(−) (n = 8) | P-value | |
|---|---|---|---|---|
| Corticospinal tract | ||||
| Luxol fast blue | 2.4 ± 0.7 | 0.7 ± 0.5 | 0.0 ± 0.0 | <0.0001 |
| IBA-1 | 2.9 ± 0.6 | 1.0 ± 0.5 | 0.0 ± 0.0 | <0.0001 |
| Motor cortex | ||||
| Haematoxylin and eosin | 1.9 ± 0.7 | 0.2 ± 0.4 | 0.0 ± 0.0 | <0.0001 |
| TDP-43 | 3.4 ± 0.5 | 2.1 ± 0.6 | 1.2 ± 0.4 | 0.0004 |
Data shown as means ± standard deviation.
Motor cortex findings
Gross atrophy of the motor cortex was observed in some CSTD(+) cases (Fig. 5). Similar to the findings in medullary pyramids, there was a significant difference in neuronal loss and gliosis in motor cortex across all three groups (Table 1), without any difference between the CSTD(±) and CSTD(−) groups. Sections of motor cortex were available in seven of the nine CSTD(+) cases. All seven showed subjective decrease in density of Betz cells in lamina V with neuronophagia in some cases and neuronal pyknosis in others (Fig. 6); one case had eosinophilic cytoplasmic inclusions that were not consistent with Bunina bodies. There was also degeneration of the molecular layer (Fig. 6). Sections of motor cortex were available in five CSTD(−) cases, and none had evidence of the aforementioned pathologies. Of the 10 CSTD(±) cases with sections of motor cortex available for analysis, only two showed mild neuronal loss and neuronal pyknosis, whereas the other eight did not have any of the aforementioned pathologies. TDP-43 pathology in the motor cortex was also significantly greater in the CSTD(+) group compared with the other two groups, but it was also greater in the CSTD(±) group compared with the CSTD(−) group (P = 0.01).
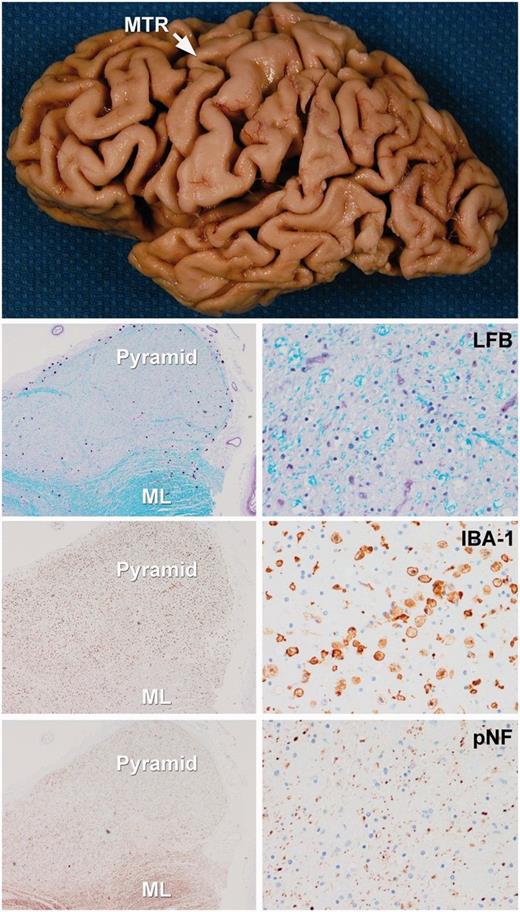
Figure demonstrating gross and histological features of a typical CSTD(+) case. There is gross atrophy of the motor cortex. Low power microscopic images (left images = ×100 magnification; right images = ×200 magnification) reveal loss of myelin on Luxol fast blue (LFB) stain, axonal loss on neurofilament (pNF) stain and the presence of activated microglia with IBA-1 in the medullary pyramids. In contrast, there is preservation of myelinated fibres in the adjacent medial lemniscus (ML). MTR = motor cortex.
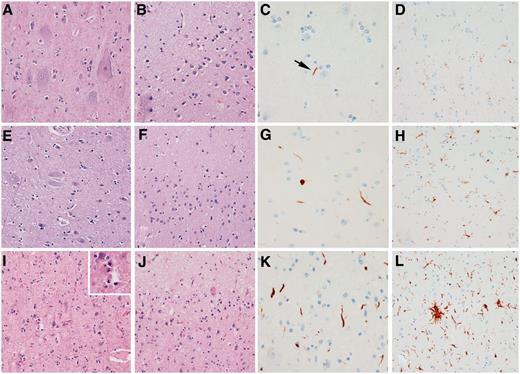
Motor cortex from the three representative cases that are shown in Fig. 3. In the CSTD(−) case, Betz cells are present (A), there is preservation of the molecular layer (B), only scant dystrophic neurites (C) and scant activated microglia (D) are observed. In the CSTD(±) case, Betz cells can be identified, although less prominent compared with the CSTD(−) case (E), there is less preservation of the molecular layer (F), more dystrophic neurites (G) and more activated microglia (H) can be observed. In the CSTD(+) case, Betz cells are absent (I), there is spongiosis in the molecular layer (J), there are a moderate number of dystrophic neurites (K) and a frequent number of activated microglia (L). The inset in I shows neuronophagia in lamina V in the CSTD(+) case. Haematoxylin and eosin low power (×200) images (A, B, E, F, I and J), TDP-43 (C, G and K) and IBA-1 (D, H and L) high power (×400) images (C, D, G, H, K and L).
Lower motor neuron findings
None of the 31 cases had evidence of lower motor neuron degeneration, specifically Bunina bodies, skein-like and Lewy body-like inclusions, TDP-43 immunoreactive inclusions in cranial nerve XII or anterior horn cells or anterior horn cell loss for those cases in which spinal cord was available for study (n = 2).
Additional pathological findings
Assessment for other pathologies, including two other brainstem tracts that are in close proximity to the corticospinal tract, the medial lemniscus and olivocerebellar tract, revealed an absence of pathology in all cases across the three groups (Fig. 3A, D and G). Immunohistochemistry to neurofilament revealed a striking loss of axons of corticospinal tract fibres in the CSTD(+) cases (Fig. 5). One CSTD(±) case was found to have Lewy bodies with density and distribution consistent with incidental Lewy bodies (Gibb and Lees, 1988). Non-neuritic senile plaques were identified in approximately one-third of the cases, equally divided between the three groups. One CSTD(−) case showed cerebral amyloid angiopathy. The presence of vascular pathologies, including athero- and arteriosclerotic vascular disease, was identified in one CSTD(+) case and three CSTD(±) cases. After excluding all cases with other degenerative pathologies that could be associated with microglia activation in motor cortex, only a handful of cases remained. Of the four remaining cases, activated microglial burden was greatest in the two CSTD(+) cases compared with the other cases, one each from the CSTD(±) and CSTD(−) groups. Braak and Braak staging was low across all three groups [CSTD(+) = 1.0 ± 0.9; CSTD(±) = 1.4 ± 1.0; CSTD(−) = 1.3 ± 0.9] and was not statistically different (P = 0.73).
Corticospinal tract findings in types A and B
Of the 61 FTLD-TDP type A cases, two had moderate to severe degeneration of the corticospinal tract and motor cortex, without involvement of the hypoglossal nucleus; hence, there was no evidence for lower motor neuron degeneration. None of the 25 FTLD-TDP type B cases had evidence of degeneration of the corticospinal tract and motor cortex in the absence of lower motor neuron disease, that is, all type B cases with CSTD also showed neuropathology affecting the hypoglossal nucleus. Therefore, compared with 9/31 (29%) FTLD-TDP type C cases with CSTD(+) pathology, only 2/86 (2%) of the other FTLD-TDP types had CSTD(+) pathology (P < 0.0001 on χ2 testing).
Demographic findings
There were no significant differences across the three groups, with the exception of total disease duration (Table 2). The CSTD(+) group had a significantly longer disease duration than both the CSTD(−) (P = 0.01) and CSTD(±) groups (P = 0.03). There was no difference in disease duration between the CSTD(−) and CSTD(±) groups (P = 0.41).
Demographics of the 31 cases of FTLD-TDP type C by group
| Demographics | CSTD(+) (n = 9) | CSTD(±) (n = 14) | CSTD(−) (n = 8) | P-value |
|---|---|---|---|---|
| Sex female:male | 5:4 | 6:8 | 4:4 | 0.83 |
| Right-handed | 100% | 78% | 100% | 0.18 |
| Education, years | 15.8 ± 3.3 (12–21) | 15.6 ± 3.9 (10–21) | 12.8 ± 3.0 (8–16) | 0.35 |
| Age at death, years | 74.3 ± 8.5 (58–81) | 74. 4 ± 8.8 (61–93) | 71. 5 ± 5.6 (60–78) | 0.68 |
| Age at onset, years | 59.0 ± 8.3 (46–70) | 63.3 ± 10.8 (47–87) | 61.6 ± 4.6 (53–69) | 0.26 |
| Total disease duration, years | 15.3 ± 4.4 (11–22) | 10.8 ± 2.7 (6–15) | 9.9 ± 2.9 (6–15) | 0.03 |
| MMSE at initial evaluation | 14.8 ± 11.5 (3–27) | 23.9 ± 3.1 (18–29) | 24.0 ± 3.3 (18–27) | 0.52 |
Data shown as means ± standard deviation (range).
MMSE = Mini-Mental State Examination.
Clinical findings
The frequency of examination features suggestive of MND did not differ across the three groups (Table 3), although 42% of the CSTD(+) group had at least one feature suggestive of corticospinal tract degeneration. Examination features suggestive of CSTD included hyper-reflexia and increased muscle tone. In the CSTD(+) group, three cases were unable to ambulate later in the disease course. No cases in the other two groups had difficulty ambulating. In no case were features of lower motor neuron disease reported, such as fasciculations or muscle atrophy. Only one case, in the CSTD(±) group, had a positive family history in which the case’s aunt and uncle both had dementia with onset age <65 years. Prosopagnosia was noted to be present across all three groups. Topographagnosia was only identified in the CSTD(+) group. Psychosis was extremely rare.
Clinical features
| CSTD(+)(n = 7) | CSTD(±)(n = 12) | CSTD(−)(n = 8) | P-value | |
|---|---|---|---|---|
| Presented with behavioural change or prosopagnosia | 86% | 42% | 38% | 0.11 |
| Positive family history | 0% | 8% | 0% | 0.52 |
| Prosopagnosiaa | 43% | 25% | 13% | 0.41 |
| Topographagnosiaa | 43% | 0% | 0% | 0.008 |
| Psychosisa | 14% | 0% | 0% | 0.23 |
| Any examination features suggestive of MNDa,b | 42% | 33% | 13% | 0.42 |
| Increased muscle tone | 1 | 0 | 1 | |
| Hyper-reflexia | 2 | 4 | 0 | |
| Babinski sign | 1 | 0 | 0 | |
| Unable to ambulatec | 43% | 0% | 0% | 0.008 |
| Expert clinical diagnosis | ||||
| Semantic dementia | 71% | 92% | 74% | 0.78 |
| bvFTD | 0% | 0% | 13% | |
| NA | 29% | 8% | 13% | |
| Proportion of semantic dementia cases with rSD | 80% | 18% | 0% | 0.01 |
| MRI findings based on the radiologist report | CSTD(+)(n = 6) | CSTD(±)(n =11) | CSTD(−)(n =8) | |
| R > L temporal | 66% | 18% | 0% | 0.03 |
| L > R temporal | 0% | 82% | 50% | |
| Bilateral | 17% | 0% | 25% | |
| Frontotemporal | 17% | 0% | 0% | |
| Mild age-related | 0% | 0% | 25% | |
a Noted at any time during the disease course.
b Findings are not mutually exclusive (i.e. a patient could have hyper-reflexia and a Babinski sign).
c Feature was noted to occur late in the disease course.
bvFTD = behavioural variant FTD; rSD = right-sided dominant features; L = left; R = Right; NA = Not able to provide retrospective diagnosis according to current clinical criteria.
In the CSTD(+) group, the most common presenting symptom was behavioural change, followed by difficulty naming objects, loss of word meaning and difficulty recognizing faces. In the CSTD(±) group, the most common presenting symptoms were similar to the CSTD(+) group, except that behavioural changes and prosopagnosia as a presenting symptom were much less frequent. In the CSTD(−) group, difficulty naming and finding words were the presenting symptoms in the majority of cases, with just one subject showing personality change.
The most common expert diagnosis rendered across all 31 cases was semantic dementia (Table 3). Of those diagnosed with semantic dementia, the CSTD(+) group had a higher proportion of cases with right-sided dominant clinical features, such as behavioural changes, topographagnosia and prosopagnosia. In keeping with these clinical findings, MRI reports by the evaluating radiologists based on visual assessment showed a significatly higher proportion of cases with right more than left focal anterior temporal atrophy in the CSTD(+) group (Table 3 and Fig. 7A). The majority of cases in the other two groups showed left > right focal anterior temporal lobe atrophy (Table 3 and Fig. 7A). One CSTD(+) case had multiple MRI with progressive temporal atrophy observed (Fig. 7B).
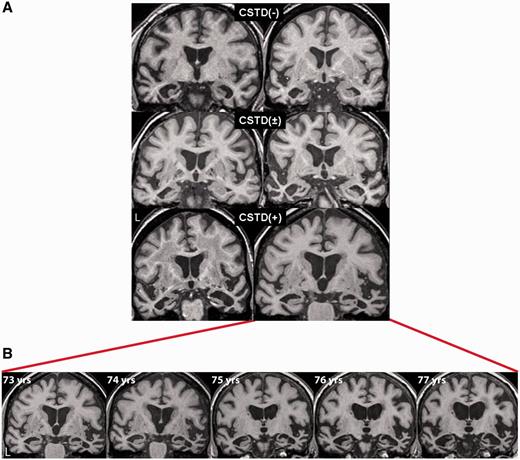
Coronal volumetric MRI for representative CSTD(−), CSTD(±) and CSTD(+) cases shown at the level of the anterior temporal lobes (A). The CSTD(+) cases both show right > left temporal atrophy, whereas the other cases show left > right temporal atrophy. One of the CSTD(+) cases had annual brain MRI scans for a period of 5 years, demonstrating progressive atrophy of both temporal lobes, although the right temporal lobe remained the more affected at each time point (B).
The two cases of FTLD-TDP type A that had CSTD were male with onset age 56 and 66 years and disease duration of 7 years and 9 months, respectively. Both patients presented with falling and difficulty swallowing, with neurological examination findings of prominent extrapyramidal features. The first case also had striking upper motor neuron signs and was wheelchair bound before death. Both patients had been diagnosed with progressive supranuclear palsy. MRI and PET scans were reported to be normal in both cases.
Genetic findings
In no case was a GRN mutation identified. One case, in the CSTD(−) group, was found to have a hexanucleotide repeat expansion in the C9ORF72 gene.
Quantitative magnetic resonance imaging findings
Voxel-based morphometry
Of the 12 cases with volumetric imaging, five were classified as CSTD(−), five were classified as CSTD(±) and two were classified as CSTD(+). Grey matter loss in all three groups was largely restricted to the temporal lobes (Fig. 8). Only the CSTD(+) cases showed atrophy of bilateral motor cortices compared with control subjects (Fig. 8). After correcting for multiple comparisons, both the CSTD(−) and CSTD(±) groups showed greater involvement of the left hemisphere, with loss observed in anterior regions of the left temporal lobe, involving temporal pole, fusiform gyrus, inferior and middle temporal gyrus, amygdala and hippocampus. In contrast, the CSTD(+) cases showed more bilateral patterns of temporal lobe loss, with greater involvement of the right hemisphere. The temporal pole, fusiform gyrus, inferior and middle temporal gyrus, amygdala and hippocampus were involved in both hemispheres, although to a greater degree on the right. The CSTD(+) cases showed significantly greater loss in the right amygdala, fusiform gyrus, parahippocampal gyrus, superior temporal gyrus and bilateral superior motor cortices, than the group of subjects that consisted of both the CSTD(−) and CSTD(±) cases, on direct comparison (Fig. 9). The CSTD(−) and CSTD(±) group did not show any regions of greater loss than the CSTD(+) cases.
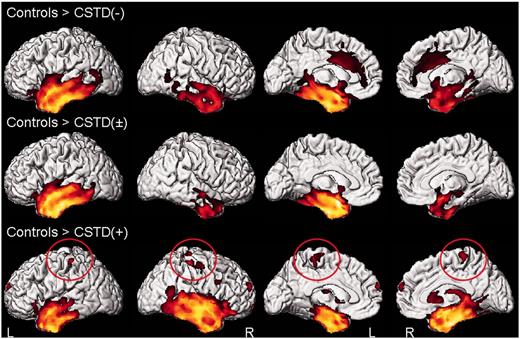
Patterns of grey matter loss in the CSTD(−), CSTD(±) and CSTD(+) groups compared with control subjects. Results are shown on 3D renderings uncorrected for multiple comparisons. Findings in the motor cortex are circled. L = left; R = right.
![Regions that showed greater grey matter loss in the CSTD(+) subjects compared with the rest of the FTLD-TDP type C cases [CSTD(−) and CSTD(±)]. Results are shown on 3D renderings and on representative coronal and axial slices, uncorrected for multiple comparisons. L = left; R = right.](https://oup.silverchair-cdn.com/oup/backfile/Content_public/Journal/brain/136/2/10.1093_brain_aws324/3/m_aws324f9p.jpeg?Expires=1716355773&Signature=tjl-F9DVLqZVoowM9rF-Pq8TsvbAqeY90aXXw875I9ND8-~zYWisHW9uDfyWVPQAGgeItNbjcSWODpX~BRBctxBq-N2dgXo4YdCL84WTYJdOa7kZHTfCDALTABK8E1siJUBymadLD5jX5mimpfEHt~48b6hnxfNHDodGVlc9hjY6f5RFd8zbhilMaTZfjpUOIPudBcIST-tvL5L2PZ5s~JQVltFNLDhaULOMGJlIw9NOC7qUmKZaISCWVg~pn6lV7ve0H4TsKVQTmy2CbcSez~tYO72pX6mlBIk0MVj0bvZoz46PN0ESu3BsPodB9Hr8ivE8mjyKwGucHPmqZASM8A__&Key-Pair-Id=APKAIE5G5CRDK6RD3PGA)
Regions that showed greater grey matter loss in the CSTD(+) subjects compared with the rest of the FTLD-TDP type C cases [CSTD(−) and CSTD(±)]. Results are shown on 3D renderings and on representative coronal and axial slices, uncorrected for multiple comparisons. L = left; R = right.
Atlas-based parcellation
Eleven of the 12 cases had a temporal lobe asymmetry score greater than control subjects, demonstrating the presence of asymmetry. Seven cases showed greater involvement of the left hemisphere and four showed greater involvement of the right hemisphere. The average asymmetry score in the CSTD(+) subjects was 0.24 ± 0.08, with both subjects showing right-sided asymmetry. In contrast, the average asymmetry score in the group that consisted of both CSTD(−) and CSTD(±) cases was −0.20 ± 0.27, with only 20% (2/10) of subjects showing right-sided asymmetry. Volumes of the right temporal lobe (P = 0.001) and right motor cortex (P = 0.001) were smaller in the CSTD(+) group after adjusting for disease duration, compared with the rest of the cases (Fig. 10A and B). No differences were observed in the left hemisphere.
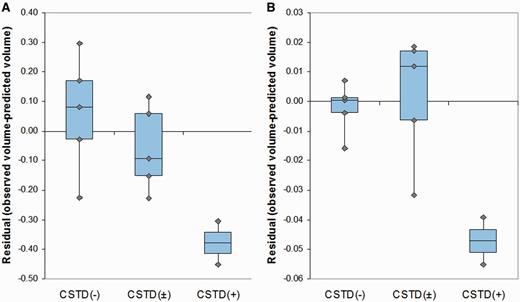
Box-plots showing right temporal (A) and motor cortex (B) residual volumes after regressing out the effect of disease duration for CSTD(−), CSTD(±) and CSTD(+) cases. Residuals rather than the observed volumes were plotted to graphically illustrate groupwise differences after accounting for disease duration. Residual volumes were obtained by fitting a linear regression model of regional volume (y-axis) versus disease duration (x-axis) and then calculating the raw volume minus the predicted volume.
Discussion
We have identified a novel pathological entity characterized by focal temporal lobe atrophy, FTLD-TDP type C pathology and moderate to very severe CSTD. This combination of features has not been previously emphasized, yet the identification of this entity has important implications for FTLD classification.
Of cases with FTLD-TDP type C pathology, those with moderate to very severe CSTD accounted for almost 30% of cases; hence, they are not uncommon. Importantly, however, these cases were not associated with pathological features of lower motor neuron degeneration, which is the cardinal feature of FTLD-MND. There is one small case series in which FTLD-TDP type C pathology has also been associated with CSTD, without pathological findings of lower motor neuron degeneration (Kobayashi et al., 2010). The authors demonstrate that such cases differed pathologically from FTLD-MND. Although CSTD(+) cases showed moderate to severe CSTD, FTLD-MND cases had only mild CSTD. In fact, at the level of the midbrain, some FTLD-MND cases did not have any evidence of CSTD. This further supports our contention that CSTD(+) cases are different from FTLD-MND. Our CSTD(+) cases also do not meet criteria for any other neurodegenerative disease. The absence of amyloid pathology excludes Alzheimer’s disease and other amyloid-related entities. The absence of α-synuclein and tau deposition eliminates all entities that are defined by the deposition of these two proteins. The absence of fused in sarcoma protein deposition excludes neuronal intermediate filament inclusion disease (Josephs et al., 2003; Cairns et al., 2004), basophilic inclusion body disease (Munoz et al., 2009) and atypical FTLD with ubiquiting-positive inclusions (FTLD-U) (Josephs et al., 2008a; Mackenzie et al., 2008). Finally, given the presence of TDP-43, our cases do not meet criteria for FTLD-U, FTLD with no inclusions (FTLD-Ni), FTLD with epitopes of the ubiquiting–proteasome system (FTLD-UPS) or dementia-lacking distinctive histology (Knopman et al., 1990; Mackenzie et al., 2009). Therefore, we are left with a pathological entity characterized by focal temporal lobe degeneration with striking CSTD, without any evidence of anterior horn cell disease and TDP-43 immunoreactive inclusions. There is currently no such recognized neurodegenerative entity (Dickson, 2003). Furthermore, the demonstration of axonal loss excludes the likelihood that it is a type of demyelinating disease.
We previously reported two cases of FTLD with CSTD that predated TDP-43 typing (Josephs and Dickson, 2007b). One of the observations from that brief report was that the two cases with CSTD had longer disease duration than typical cases of FTLD-MND. In the current study, we confirm the long disease duration in CSTD(+) cases. Compared with FTLD-MND, in which the mean disease duration is ∼2–3 years (range between 6 months and 6 years) (Hodges et al., 2003; Josephs et al., 2005; Hu et al., 2009; Coon et al., 2011a; Elamin et al., 2011); mean disease duration in our CSTD(+) cases was ∼15 years. This is not necessarily surprising, as long disease duration is associated with FTLD-TDP type C pathology (Grossman et al., 2007; Josephs et al., 2009, 2011). Surprisingly, however, the CSTD(+) cases had longer disease duration than the other cases with FTLD-TDP type C pathology. Although it is possible that the changes in the CSTD(+) group are because of longer survival, our findings do not support that hypothesis. First, the differences in severity measures of CSTD across the groups persisted after we accounted for disease duration, suggesting that disease duration alone cannot explain the findings. Second, moderate to very severe CSTD in the absence of lower motor neuron degeneration was not associated with type A and type B pathology, despite the fact that some cases with these pathologies do have long disease duration (Cairns et al., 2007; Josephs et al., 2007a; Whitwell et al., 2010), suggesting that the association is specific to type C pathology. Third, if it was simply a matter of longer disease duration and, hence, disease progression, we would expect changes to be observed in other tracts, yet we did not observe any evidence of degeneration in the olivocerebellar tract or medial lemniscus. The more likely possibilities, therefore, are that there exists a unique association between FTLD with type C pathology and CSTD, and that this is a novel neurodegenerative entity in which long disease duration is a feature of the disease. The notion that the presence of CSTD could be causing longer disease duration in FTLD-TDP type C cases is counter-intuitive and highly unlikely.
Almost all CSTD(+) cases, and in fact all FTLD-TDP type C cases, fulfilled criteria for semantic dementia (Neary et al., 1998), although in some patients, limited clinical information prevented retrospective diagnosis. The fact that the majority of cases were diagnosed with semantic dementia was not surprising, as FTLD-TDP type C has been associated with semantic dementia (Mackenzie et al., 2006; Grossman et al., 2007; Snowden et al., 2007; Josephs et al., 2009; Rohrer et al., 2011). Unexpectedly, however, clinical features of CSTD were not prominent and were reported in <50% of the CSTD(+) cases. CSTD is typically considered to be associated with striking clinical features of spastic dysarthria, dysphagia, upper motor neuron type weakness, hyper-reflexia, Babinski sign and clonus. In our CSTD(+) cases of FTLD-TDP type C, some of these features were documented, but in most cases, these features were not emphasized in the medical records. Three cases were unable to ambulate later in the disease course, which could signify upper motor neuron disease, but this was not clear from the medical records. In one reported case of semantic dementia that had pathologically confirmed FTLD-MND, it was indeed stated that the patient developed walking difficulties 1 year before death (Davies et al., 2005). The fact that upper motor neuron features were not more frequent is somewhat surprising, as one would have predicted more clinical symptoms suggestive of CSTD in more cases. Although it is possible that clinical features associated with CSTD were simply absent to mild in some of our CSTD(+) cases, it is also possible that some of these features were missed by the evaluating physicians who may have been more focused on assessing cognitive and behavioural impairment. The absence of clinical features suggestive of CSTD has been previously reported in another degenerative disease, corticobasal degeneration, where CSTD was pathologically identified (Tsuchiya et al., 2005). Clinical features suggestive of underlying CSTD were identified in only 60% of the subjects with corticobasal degeneration (Tsuchiya et al., 2005), suggesting that in some degenerative diseases with CSTD, clinical signs may not always be observed. However, it is possible that the clinical manifestations of CSTD may be a late feature of the disease (Davies et al., 2005). In a case report of a patient with semantic dementia and CSTD with detailed annual examination, clinical features in-keeping with CSTD were not observed until 17 years after disease onset (Yokota et al., 2006). In fact, in one of our patients that had yearly examinations, clinical features of CSTD were still not observed even after 9 years (Supplementary material). Findings from this study cannot answer the question of whether clinical signs of CSTD were absent or missed by the evaluating physicians; most likely it was because of a combination of both. However, the findings support the importance of performing a thorough neurological examination of both the upper and lower motor systems in all patients with an FTD syndrome, especially those with semantic dementia. We could also speculate that the lack of clinical features of CSTD may have biological underpinnings. Features of CSTD tend to be prominent in patients with strokes affecting the corticospinal tract. In such instances, there is acute damage to the corticospinal tract fibres. Features of CSTD can also be prominent in amyotrophic lateral sclerosis, in which degeneration is relatively rapid for a period of months to a few years. On the contrary, in our CSTD(+) cases, it is more likely that degeneration occurred much more gradually for a period of many years. It has been suggested that in degenerative diseases, there is more involvement of the caudal corticospinal tract than the rostral corticospinal tract, for example, more severe degeneration at the level of the pyramids than at the level of the cerebral peduncles, and, hence, a dying back phenomenon (Kato, 2008; Kobayashi et al., 2010). Although we found more TDP-43 immunoreactive inclusions in the motor cortex and changes in the molecular layer in our CSTD(+) cases compared with the other two groups, suggesting that there is involvement of the corticospinal tract beyond the level of the pyramids, we did not assess the corticospinal tract at the level of the cerebral peduncles or pons; hence, we cannot refute or support the suggestion that this may be a dying back phenomenon.
In all CSTD(+) cases that could be diagnosed, there was evidence of significant anomia, as well as varying combinations of behavioural and personality change, prosopagnosia and topographagnosia. The presence of behavioural and personality changes, topographagnosia and prosopagnosia is suggestive of involvement of the right temporal lobe (Thompson et al., 2003; Seeley et al., 2005; Josephs et al., 2008b; Chan et al., 2009), and indeed, visual assessment of the MRIs did find a predominance of right temporal lobe atrophy. In contrast, clinical and visual MRI findings in the other two groups were more consistent with left temporal lobe involvement. However, prosopagnosia was observed in the CSTD(±) and CSTD(−) groups, likely reflecting the fact that the right temporal lobe was involved to some degree, although not dominant, in some of these cases. Psychosis was rare in all FTLD-TDP type C groups, which contrasts with previous reports of psychosis being associated with FTLD-MND (Claassen et al., 2008; Lillo et al., 2010); further evidence that our CSTD(+) cases differ from FTLD-MND. The fact that only one case had a repeat expansion in the C9ORF72 gene, and none had mutations in GRN, concords with the lack of family history and the lack of psychosis, as the latter has been associated with the C9ORF72 repeat expansions (Snowden et al., 2012).
The quantitative MRI findings of predominant focal anterior temporal atrophy across all FTLD-TDP type C groups were consistent with previous reports in FTLD-TDP type C (Rohrer et al., 2010; Whitwell et al., 2010) and the clinical diagnosis of semantic dementia (Mummery et al., 2000; Chan et al., 2001; Galton et al., 2001; Gorno-Tempini et al., 2004; Josephs et al., 2008b). In the majority of cases, the temporal lobe atrophy was asymmetric. However, the CSTD(+) cases showed right-sided asymmetry, whereas left-sided asymmetry was more common in the other cases. Although there was an association between right-sided temporal atrophy and CSTD, we also had right-sided cases that did not have moderate to very severe CSTD. This disassociation suggests that not all patients with right-sided dominant semantic dementia will have CSTD, although right-sided patients may be more likely to have CSTD than patients with left-sided semantic dementia. On the other hand, one case has been previously reported with semantic dementia and CSTD with left > right temporal atrophy (Yokota et al., 2006); therefore, cases with left-sided semantic dementia could also develop CSTD. Further complicating the issue of asymmetry is that patients with right > left temporal atrophy can also be associated with FTLD-MND (Coon et al., 2011b). Such cases, however, typically have clinical features of lower motor neuron disease and have been reported to have FTLD-TDP type B pathology (Coon et al., 2011b). These cases should be differentiated from our CSTD(+) cases that have FTLD-TDP type C pathology and no clinical features of lower motor neuron disease.
In addition to differences within the temporal lobe, the CSTD(+) group also showed greater atrophy in the motor cortex compared with the other FTLD-TDP type C groups. The region-of-interest analysis revealed no overlap in motor cortex volumes, even when accounting for disease duration. Consistent with motor cortex atrophy observed on imaging was the fact that pathological analysis revealed motor cortex atrophy on gross examination, as well as motor cortex degeneration in the CSTD(+) cases.
Even after excluding the CSTD(+) cases, a high proportion of FTLD-TDP type C cases did have some evidence of CSTD (64%). However, the data did not support separating the CSTD(±) group from the CSTD(−) group. In fact, we observed no clinical, genetic or imaging differences between these two groups. Subtle involvement of the corticospinal tract, therefore, seems to be a feature of FTLD-TDP type C. However, clinical and imaging data clearly show that it is important to segregate the CSTD(+) group, which is characterized by moderate to very severe CSTD, from those cases with only subtle features of involvement of the corticospinal tract. The finding of moderate to very severe CSTD in the absence of lower motor neuron degeneration seems to be specific to FTLD-TDP type C pathology. We only observed two cases with CSTD and absent lower motor neuron degeneration out of 86 cases of FTLD-TDP type A or B. These two cases were clearly clinically different from our CSTD(+) type C cases. Both had striking extrapyramidal and pyramidal features, short disease duration and were diagnosed with progressive supranuclear palsy. Furthermore, neither case had focal temporal lobe atrophy.
There have been a few reports of semantic dementia associated with motor neuron degeneration, although these cases differ from our CSTD(+) cases. In one series of 18 pathologically confirmed cases with semantic dementia, one case was reported to have features of motor neuron degeneration (Davies et al., 2005). This case showed degeneration of medullary motor nuclei, that is, lower motor neuron degeneration; hence, it differed from our CSTD(+) cases. Another case has been reported with clinical features of semantic dementia and amyotrophic lateral sclerosis without autopsy confirmation (Kim et al., 2009). Given the neurophysiological confirmation of lower motor neuron disease in that case, one would predict FTLD-TDP type B pathology and the presence of lower motor neuron degeneration. However, features of motor neuron degeneration, including CSTD, have not been emphasized in other large clinicopathological series of semantic dementia (Godbolt et al., 2005; Hodges et al., 2010), and one study assessing motor neuron dysfunction in FTD variants did not identify corticospinal tract dysfunction in those with semantic dementia (Burrell et al., 2011). There are two possible explanations: (i) CSTD occurs late in those with semantic dementia or (ii) semantic dementia with CSTD may not have been represented in that series. Therefore, it seems that there are at least two variants of FTLD in which CSTD can be identified: (i) those with pathological findings of lower motor neuron degeneration, absent–moderate CSTD, FTLD-TDP type B pathology and relatively short disease duration (6 months to 6 years) and (ii) those without lower motor neuron degeneration yet moderate to very severe CSTD, FTLD-TDP type C pathology and long disease duration (10–20 years). The former is FTLD-MND and is predominantly associated with behavioural variant FTD or agrammatic aphasia and features of lower motor neuron disease, whereas the latter could be referred to as FTLD-CSTD and is predominantly associated with semantic dementia and no features of lower motor neuron disease.
In summary, we have identified a group of cases with FTLD-TDP type C pathology with moderate to very severe CSTD, that is, FTLD-CSTD, presenting as semantic dementia predominantly with right-sided features (Box 1). This entity seems to be associated with right predominant temporal lobe atrophy and evidence of motor cortex grey matter atrophy. Given that our quantitative imaging analysis was limited by a small number of cases in some categories, confirmation of these imaging findings will be needed in larger cohorts. This distinct clinicopathological entity represents a relatively high proportion of FTLD-TDP type C cases and, therefore, should not be ignored. In fact, it might be important to separate out such cases in future genetic studies of FTLD-TDP.
Clinical features
Demographic
Long disease duration
Cognitive
Prosopagnosia and topographagnosia
Behavioural and personality change
Anomia and loss of word meaning
Motor
Hyper-reflexia
Babinski sign
Clonus
Upper motor neuron pattern weakness
Spasticity
Imaging features
Right > left anterior temporal lobe atrophy
Atrophy of the motor cortex
Funding
Funding for this study was received from the National Institutes of Health (NIH) (R01 AG037491, P50 AG16574, P01 AG03949 and P50 NS72187).
Supplementary material
Supplementary material is available at Brain online.
Acknowledgements
The authors acknowledge the histological assistance of Virginia Phillips and Linda Rousseau and immunohistochemistry support of Monica Casey-Castanedes. They thank Dr Leonard Petrucelli for generous donation of C-terminal TDP-43 antibody used for immunohistochemistry.
Abbreviations
- CSTD
corticospinal tract degeneration
- FTD
frontotemporal dementia
- FTLD
frontotemporal lobar degeneration
- MND
motor neuron degeneration

