


Abstract
Laquinimod is an orally administered compound that is under investigation in relapsing-remitting multiple sclerosis. To understand the mechanism by which laquinimod exerts its clinical effects, we have performed human and murine studies assessing its immunomodulatory properties. In experimental autoimmune encephalomyelitis, the therapeutic administration of laquinimod beginning during the recovery of SJL mice, prevented further relapses as expected and strongly reduced infiltration of CD4+ and CD8+ T cells in the central nervous system. We hypothesized that this beneficial effect was mediated by dendritic cells, since we and others found a modulation of different dendritic cell subsets under treatment. According to the findings on antigen-presenting cells in the murine system, we found a reduced capacity of human monocyte-derived dendritic cells treated with therapeutic concentrations of laquinimod, upon maturation with lipopolysaccharide, to induce CD4+ T cell proliferation and secretion of pro-inflammatory cytokines. Furthermore, laquinimod treatment of mature dendritic cells resulted in a decreased chemokine production by both murine and human dendritic cells, associated with a decreased monocyte chemo-attraction. In laquinimod-treated patients with multiple sclerosis we consistently found reduced chemokine and cytokine secretion by conventional CD1c+ dendritic cells upon lipopolysaccharide stimulation. Similarly to the animal model of relapsing-remitting multiple sclerosis, dendritic cell subsets were altered in patients upon laquinimod treatment, as the number of conventional CD1c+ and plasmacytoid CD303+ dendritic cells were decreased within peripheral blood mononuclear cells. Moreover, laquinimod treatment in patients with multiple sclerosis and mice modified the maturation of dendritic cells demonstrated by an upregulation of CD86 expression in vivo. Our data suggest that inhibition of the NF-κB pathway is responsible for the changes observed in dendritic cell maturation and functions. These findings indicate that laquinimod exhibits its disease-modulating activity in multiple sclerosis by downregulating immunogenicity of dendritic cell responses. We suggest that monitoring dendritic cell properties in multiple sclerosis should be implemented in future therapeutic trials.
Introduction
Laquinimod is a new oral immunomodulatory agent that is under development for the treatment of relapsing-remitting multiple sclerosis. Phase III trials in patients with relapsing-remitting multiple sclerosis indicate effects of 0.6 mg laquinimod on relapse rate, disease progression and accumulation of brain tissue loss (as measured by MRI) coupled with a favourable safety and tolerability profile. Its structure is derived from roquinimex, a compound that showed anti-inflammatory activity in experimental autoimmune encephalomyelitis (EAE), an animal model of multiple sclerosis, and in clinical studies. Due to serious cardiopulmonary toxicities reported during phase III trials, the clinical development of roquinimex was halted (Noseworthy et al., 2000). Like its parent compound, laquinimod exerts an inhibitory effect on disease progression in acute EAE, being 20-fold more efficient than roquinimex (Jonsson et al., 2004) but without any adverse events. As laquinimod provoked no pro-inflammatory reaction (Jonsson et al., 2004), it was selected for further investigations and clinical studies. In placebo-controlled phase II/IIb studies, laquinimod treatment reduced disease activity, as seen by MRI, and exhibited a good safety profile (Polman et al., 2005; Comi et al., 2008). In 2-year phase III clinical trials, laquinimod significantly slowed the progression of disability and reduced the annualized relapse rate [ALLEGRO study (NCT00509145); Comi et al., 2012]. Furthermore, laquinimod treatment over 24 months was associated with significantly reduced brain atrophy rates compared with placebo. Animal studies revealed a potential neuroprotective effect of laquinimod (Wegner et al., 2010), which is supported by the fact that laquinimod can be detected in the CNS after oral administration (Bruck and Wegner, 2011).
Furthermore, studies on rodents have indicated that laquinimod has an impact on inflammatory cytokine production such as inhibition of IFNγ, TNFα, IL-12 or IL-17 and enhancement of IL-4 and TGF-β, suggesting a downregulation of Th1 and Th17 immune responses (Zou et al., 2002; Yang et al., 2004; Wegner et al., 2010).
Interestingly, microarray analysis of human peripheral blood mononuclear cells incubated with laquinimod confirmed this modulation of T cell responses (Gurevich et al., 2010). In EAE, fewer infiltrating immune cells were found in the CNS of treated mice (Brunmark et al., 2002). This decreased infiltration has been attributed to the reduction of the lymphocyte adhesiveness to VCAM-1, which was not due to a reduced VLA-4 expression (Wegner et al., 2010). Besides a potential direct action of laquinimod on T cells, these effects could be mediated indirectly through modulation of T cell responses by accessory cells. It has now been established that antigen-presenting cells are key players during EAE and multiple sclerosis development and intriguing therapeutic targets in this context. Here, we demonstrate a regulatory effect of laquinimod, mediated by the NF-κB pathway, on murine and human dendritic cells, the most potent antigen-presenting cells in vitro as well as in laquinimod-treated patients with multiple sclerosis, with regards to cytokine and chemokine patterns as well as the maturation marker CD86.
Materials and methods
Animals
C57BL/6 mice were purchased from the Central Animal Facility Institution of the University of Mainz and SJL/J mice from Janvier. Animal procedures were performed under the supervision of authorized investigators in accordance with the European Union normative for care and use of experimental animals.
Induction and assessment of active experimental autimmune encephalomyelitis
C57BL/6 and SJL female mice were immunized with 50 µg of MOG35–55 peptide (Research Genetics) or 250 µg murine PLP139-151 (Pepceuticals), respectively, emulsified in complete Freund’s adjuvant (Difco Laboratories) and supplemented with 10 mg/ml of heat-inactivated Mycobacterium tuberculosis H37RA (Difco Laboratories). Emulsion was administered as a 100 µl subcutaneous injection in the tail base for C57BL/6 mice or four subcutaneous injections of 50 µl in the flank for SJL mice. Mice received 200 ng of pertussis toxin (Sigma Aldrich) intraperitoneally on the day of immunization and 2 days later.
EAE was assessed clinically on a daily basis according to the following criteria: 0, no disease; 1, decreased tail tone; 2, impaired righting reflex and partial hind limb paralysis; 3, complete hind limb paralysis; 4, hind limb paralysis with partial fore limb paralysis; 5, moribund or dead.
Laquinimod (TEVA) was diluted in purified water (B. Braun) and kept at 4°C. The treatment (25 mg/kg) was given daily after the clinical assessment at a volume of 100 µl per oral administration (os) per mouse. The control mice were given 100 µl water.
In vivo T cell proliferation and differentiation assay
CD4+ T cells were isolated from spleen and lymph nodes of CD90.1+ or CD90.2+ 2D2 mice by positive selection using MACS beads (Miltenyi Biotec) according to the manufacturer’s instructions. After washing the cells twice in 10 ml PBS, pH 7.4, they were incubated with 0.5 mM carboxyfluorescein succinimidyl ester in 1 ml PBS per 107 cells at room temperature for 7 min. To stop the reaction, 8 ml RPMI plus 10% foetal calf serum was added. Cells were washed twice in 10 ml RPMI, resuspended in an appropriate volume of PBS and 5–10 × 106 T cells were injected intravenously on Day 6 into the C57BL/6 mice, which were treated with laquinimod or water. The mice were immunized with MOG35-55 peptide on Day 7. Five days later, lymphocytes were isolated from peripheral lymphoid organs and subjected to flow cytometric analysis.
Flow cytometric analysis
For analysis of murine cells, we used antibody conjugates to the following antigens: CD4, CD8, CD90.1, IL-17A, IFNγ, CD25, FoxP3, CD45.2, CD11c and CD11b. For staining of human cells, the following antibody conjugates were used: anti-CD11c-APC, anti-CD14-APC, anti-CD40-PE-Cy7, anti-HLA-DR-V450, CD4-V450, CD83-PE, CD86-PE, anti-CD45RA-APC. Antibodies were obtained from BD Biosciences or eBioscience. Intracellular staining for Foxp3 was performed using the Foxp3 Staining Set (Natutec) according to the manufacturer’s instructions. Intracellular stainings for IFNγ and IL-17A were performed using the Cytofix/Cytoperm kit from BD Biosciences. Stained cells were measured by FACSCanto II (BD Biosciences) and analysed with FlowJo software (Tree Star).
Isolation of splenic dendritic cells
Spleens were removed and injected with 2 ml Hank’s balanced salt solution (Gibco) containing 100 U/ml collagenase D and DNase I, cut into pieces and incubated at 37°C for 30 min. A spleen cell suspension was obtained by passing tissue through a nylon cell strainer (40 μm, BD Falcon). Cells were subsequently stained for flow cytometric analysis.
Isolation of T cells from the central nervous system
Extraction of mononucleated cells from inflamed CNS tissue was performed as described previously (Siffrin et al., 2009). Mononucleated cells were stimulated in RPMI 1640 (Gibco) containing 10% foetal bovine serum supplemented with phorbol 12-myristate 13-acetate (50 ng/ml), ionomycin (500 ng/ml) and brefeldin A (1 μg/ml) for 4 h at 37°C.
Generation of murine bone marrow-derived dendritic cells
Femurs and tibiae of C57BL/6 mice were aseptically removed. Bone marrow cells were isolated by flushing bones. The cells were grown in 100 mm Petri dishes in RPMI-1640 with penicillin, streptomycin, glutamine, 2-mercaptoethanol and 10% heat-inactivated foetal bovine serum (Biochrom) supplemented with granulocyte macrophage-colony stimulating factor containing supernatant from a transfected 293FT HEK cell line. Laquinimod was added at different concentrations. On Days 3, 6 and 8, fresh medium and granulocyte macrophage-colony stimulating factor supernatant were added; dendritic cells were harvested on Day 10.
Generation of human dendritic cells
Heparinized peripheral blood of healthy donors or cord blood was collected in accordance with the regulations set by the local ethics committee. Human peripheral blood mononuclear cells were isolated from buffy coats (Transfusion Centre, University Medical Centre, Mainz) by Ficoll Hypaque density gradient centrifugation (PAA Laboratories). Monocytes were sorted from human peripheral blood mononuclear cells using human anti-CD14 microbeads (Miltenyi Biotec). Their purity was checked by flow cytometry using an antigen-presenting cell-labelled anti-human CD14 antibody (BD Pharmingen). The resulting CD14+ monocyte fraction was cultured at 4 × 10⁶ cells/ml in the presence of recombinant human granulocyte macrophage-colony stimulating factor (50 ng/ml) and recombinant human IL-4 (20 ng/ml) as well as in different concentrations of laquinimod. On Day 3, fresh medium, granulocyte macrophage-colony stimulating factor and IL-4 were added. For differentiation into mature dendritic cells, immature dendritic cells were also stimulated on Day 6 with lipopolysaccharide (1 µg/ml) for 24 h. On Day 7, immature and mature dendritic cells were harvested.
T cell proliferation assays
In a mixed leucocyte reaction assay, human mature dendritic cells were co-cultured with varying ratios of allogeneic CD4+ T cells isolated from healthy donors using the CD4+ T Cell Isolation Kit (Miltenyi Biotec). Murine mature dendritic cells loaded with MOG35-55 peptide were co-cultured with varying ratios of naïve 2D2 T cells. Isolated CD4+ T cells were polyclonally stimulated with anti-CD3 and anti-CD28 monoclonal antibodies. To measure the level of T cell response, cells were cultured for 3 days in 96-well round-bottom plates followed by an additional 16 h pulse in the presence of 3H-thymidine (37 kBq/well, Amersham). Thymidine incorporation was measured in a β-scintillation counter (Microbeta; Wallac).
Activation of naïve T cells by allogeneic dendritic cells
Mature dendritic cells (1 × 10⁵ cells/ml) were co-cultured with allogeneic naïve CD4+ T cells (1 × 10⁶ cells/ml) purified from cord blood using human CD4 microbeads (Miltenyi Biotec). After 2 weeks of co-culture, cells were restimulated with phytohaemagglutinin (2.4 µg/ml) plus phorbol 12-myristate 13-acetate (1 ng/ml) for 5 h followed by intracellular cytokine staining (IL-2, IFNγ, TNFα and IL-4).
Activation of polyclonal MBP85-99-specific T cells by autologous dendritic cells
For in vitro induction of MBP85-99-specific T cells, a total of 4 × 10⁶ unfractioned human peripheral blood mononuclear cells of an HLA-DRB1*1501 donor in 24-well-plates at a volume of 2 ml/well was stimulated with 25 µg/ml MBP85-99, similar to a protocol described by Eiz-Vester et al. (2006). A quantity of 10 U/ml IL-2 was added on Day 3. On Days 7 and 14, CD4+ sorted T cells from this culture were restimulated with MBP85-99 (25 µg/ml)-pulsed autologous irradiated human peripheral blood mononuclear cells. After two restimulation cycles, the induced MBP85-99-specific CD4+ T cells (1 × 10⁶ cells/ml) were co-cultured with mature dendritic cell (1 × 10⁵ cells/ml). After 1 week of co-culture, the cells were stimulated with anti-CD3 and anti-CD28 monoclonal antibodies for 4 h, followed by intracellular cytokine staining (IFNγ, TNFα, IL-17).
Cytokine and chemokine assays
Supernatants were collected from lipopolysaccharide-matured dendritic cells or sorted CD1c+ dendritic cells. Cytokine concentrations were measured with the FlowCytomix (eBioscience) Human Th1/Th2/Th9/Th17/Th22 13plex kit (IFNγ, IL-1β, IL-2, IL-4, IL-5, IL-6, IL-9, IL-10, IL-12 p70, IL-13, IL-17A, IL-22, TNFα) or FlowCytomix Simplex Mouse kits for IL-1β, IL-6, IL-10 and TNFα. Chemokine concentrations were measured with the FlowCytomix Human Chemokine 6plex kit (G-CSF, IL-8, MCP-1, MIG, MIP-1α, MIP-1β) or FlowCytomix Simplex Mouse kits for MIP-1α, MIP-1β and MCP-1. Data were analysed with FlowCytomix Pro 2.4.
Chemotaxis assay
For assessment of chemotaxis, 50 000 calcein-stained monocytes isolated from human peripheral blood mononuclear cells in 100 µl migration assay medium were added to transwell insert (HTS FluoroBlok Inserts, Becton Dickinson). In the lower chamber, 700 µl of mature monocyte-derived dendritic cell supernatants were added, either untreated or treated with laquinimod. After 2 h incubation at 37°C, the transwell inserts were lifted and cells that had migrated to the lower chamber were counted.
Phagocytosis measured by fluorescein isothiocyanate-dextran incorporation
Human immature monocyte-derived dendritic cells (1 × 10⁵) were resuspended in 100 µl PBS containing 1% human AB serum and incubated with fluorescein isothiocyanate-dextran (Sigma, 1 mg/ml) at 37°C and 0°C (negative control) for 30 min. The incubations were stopped by adding 2 ml ice-cold PBS containing 1% human serum and 0.02% sodium azide. The cells were washed three times with cold PBS-azide and analysed on a FACSCanto II flow cytometer.
Analysis of dendritic cells from laquinimod-treated patients
Heparinized peripheral blood of healthy donors (n = 15), untreated patients with multiple sclerosis (n = 13) and laquinimod-treated patients with multiple sclerosis (n = 14) were drawn in accordance with the regulations set by the local ethics committee (Table 1). All samples were collected with informed written consent and appropriate ethical approval at the respective sites. Conventional dendritic cells were sorted from human peripheral blood mononuclear cells with a CD1c (BDCA-1)+ Dendritic Cell Isolation Kit (Miltenyi Biotec). Purity and surface expression of CD86, HLA-DR and CD1c of isolated conventional CD1c+ dendritic cells were assessed by flow cytometry. Thereafter, these cells were plated in a round-bottom 96-well plate, 4 × 10⁴ cells/well. To stimulate the secretion of cytokines and chemokines, the cells were incubated with 1 µg/ml lipopolysaccharide. For messenger RNA analysis, dendritic cells were snap frozen after 4 h. To determine the levels of cytokines and chemokines produced, supernatants were collected after 24 h.
Patients details
| Group | Female/ male | Age | Disease duration | Laquinimod- treatment duration |
|---|---|---|---|---|
| Healthy donors (n = 15) | 10/5 | 41.8 ± 8.4 (28–54) | n.d. | n.d. |
| Untreated patients with multiple sclerosis (n = 13) | 11/2 | 36.6 ± 12.4 (24–60) | 4.1 ± 3.6 (0.1–10) | n.d. |
| Laquinimod-treated patients with multiple sclerosis (n = 14) | 10/4 | 40.8 ± 10.2 (28–57) | 9.5 ± 4.2 (3–18) | 4.2 ± 1.9 (1–7) |
Age, disease duration and laquinimod-treatment duration are presented as mean ± SD (range) expressed in years. n.d. = not determined.
Flow cytometric analysis of human dendritic cell subsets
Human peripheral blood mononuclear cells were labelled with anti-CD3/anti-CD14/anti-CD19-FITC, anti-HLA-DR-PE-Cy5, CD11c-APC-Cy7, CD1c-Pacific Blue, CD141-APC, CD303-PE and CD16-PE-Cy7. Dendritic cell subsets were analysed by flow cytometry. Dendritic cells were characterized as CD3-/CD14-/CD19-, HLA-DR+ cells. Conventional dendritic cells were defined as CD11c+ and CD1c+, CD16+ or CD141+. Plasmacytoid dendritic cells were characterized as CD11c- and CD303+.
RNA isolation and quantitative polymerase chain reaction analysis
Total RNA from cultured human CD1c+ dendritic cells and bone marrow-derived dendritic cells was isolated using the RNeasy® Mini Kit (Qiagen). One additional DNase I treatment (Roche) was performed to avoid genomic DNA contamination. The quality and integrity of total RNA preparation was confirmed using a NanoDrop 2000c Spectrophotometer (Thermo Scientific). The total RNA was used to obtain complementary DNA by the SuperScript® III First Strand Synthesis System and random hexamer primers (Invitrogen) following the manufacturer’s instructions. Amplification primers for real-time PCR analysis of the human (Table 2) and mouse (Table 3) transcripts were designed using Beacon Designer 8 Software (PREMIER Biosoft International) according to the manufacturer’s guidelines and subsequently tested for efficiency and specificity. Real-time PCR was performed by using iQ™ SYBR® Green supermix (BioRad Laboratories) and the iCycler iQ (Bio-Rad). Relative changes in gene expression were determined using the ΔΔCt method (Livak and Schmittgen, 2001) with GAPDH, β-actin, PPIA or EF1α as reference genes.
Sequences of the oligonucleotides used for real-time PCR amplification of human samples
| Gene | Accession number | Forward primer (5′-3′) | Reverse primer (5′-3′) | Amplicon size (bp) |
|---|---|---|---|---|
| β-Actin* | NM_001101.3 | TTAGTTGCGTTACACCCTTTC | ACCTTCACCGTTCCAGTT | 150 |
| Glyceraldehyde-3-phosphate dehydrogenase (GAPDH)* | AF261085.1 | TATGACAACAGCCTCAAG | TTCCACGATACCAAAGTT | 99 |
| Chemokine (C-C motif) ligand 3 (CCL3, MIP-1α) | NM_002983.2 | TCCACAGAATTTCATAGC | CTTGGTTAGGAAGATGAC | 76 |
| Chemokine (C-C motif) ligand 4 (CCL4, MIP-1β) | NM_207007.2 | GCATCTCCTCCATACTCA | CCTAATACAATAATACAGCACAT | 89 |
| Interleukin 1 beta (IL-1β) | M15330.1 | CTTCAGCCAATCTTCATT | CACTGTAATAAGCCATCAT | 88 |
| Tumor necrosis factor alpha (TNF-α) | NM_000594.2 | CCTGACATCTGGAATCTG | CTGGAAACATCTGGAGAG | 128 |
*genes used as housekeeping genes.
Sequences of the oligonucleotides used for real-time PCR amplification of mouse samples
| Gene | Accession number | Forward primer (5′-3′) | Reverse primer (5′-3′) | Amplicon size (bp) |
|---|---|---|---|---|
| Elongation factor 1 alpha (EF1α)* | X13661.1 | TACAGTCAGAAGAGATACG | GAACCAAGGCATATTAGC | 150 |
| Glyceraldehyde-3-phosphate dehydrogenase (GAPDH)* | GU214026.1 | CAGCAACTCCCACTCTTC | TGTAGCCGTATTCATTGTCAT | 101 |
| Peptidylprolyl isomerase A (cyclophilin A, PPIA)* | NM_008907.1 | CAAGACCAGCAAGAAGAT | GCAGAGATTACAGGACATT | 146 |
| Inhibitor of kappaB kinase beta (IKK-β) | NM_010546.2 | CGGCTCTTAGATACCTTCA | GCTCCTTGGCATATCCTA | 126 |
| Inhibitor of kappaB kinase gamma (IKK-γ, NEMO) | AY112937.1 | ACCTCCTGACTTCTGTTG | TCTGCTGCTCCTACTCTA | 98 |
| Intercellular adhesion molecule 1 (ICAM-1) | NM_010493.2 | ACTGGACTATAATCATTC | CCTTCTGTAACTTGTATA | 114 |
| Interleukin 1 receptor, type I (IL-1R1) | NM_008362.2 | GCCATATACAATGCTCTC | TCTGCTTAATGAACTGAATA | 109 |
| Interleukin 1 receptor, type II (IL-1R2) | NM_010555.4 | AGACAATACCAGCATCATT | TAAGCAGCCGAGATAAAC | 124 |
*genes used as housekeeping genes.
Protein isolation and western blot analysis
For western blot analysis, 20–50 µg of cytosolic protein lysates from murine bone marrow- or monocyte-derived dendritic cells were used. The separation of cytosolic and nuclear extracts used buffers containing 10 mM Tris, 10 mM NaCl, 3 mM MgCl and 1% NP-40. SDS-PAGE (4–12% gradient gels) and polyvinylidene difluoride membrane were performed with antibodies against IκBα (Santa Cruz) and p100 (Cell Signaling). Antibodies against β-Actin (Santa Cruz) or tubulin (Cell Signaling) were used as loading controls.
Statistical analysis
All data were analysed using PRISM5 (Graphpad software). Data are presented as mean ± SEM from two independent experiments (EAE, in vivo assays) and at least three independent experiments (in vitro experiments). Statistical analysis of the data was conducted using a non-parametric test (Mann–Whitney or Kruskal–Wallis tests) followed by a Dunn’s multiple comparison test.
Results
Beneficial therapeutic effect of laquinimod on experimental autoimmune encephalomyelitis development
To test the efficacy of laquinimod in disease prevention, we treated C57BL/6 as well as SJL mice by daily oral administration with 25 mg/kg of laquinimod, starting the day of disease induction with MOG35-55 or PLP131-151 peptides, respectively. As recently reported for C57BL/6 mice (Wegner et al., 2010; Schulze-Topphoff et al., 2012), this treatment also completely abolished disease development in SJL mice (Fig. 1A). In line with the data produced by Schulze-Topphoff et al. (2012), similar treatment of SJL/J mice prevented disease relapse when administered at the post-recovery stage (Fig. 1B). When we analysed the T cell infiltrates at Day 28 in the CNS of these therapeutically treated SJL/J animals, we found very few CD4+ T cells compared with water-treated control mice (Fig. 1C). Moreover, the total number of CNS-infiltrating CD8+ T cells was also significantly reduced. Among infiltrating CD4+ T cells, we did not observe a significant difference in the ratio of Th1 versus Th17 T cells in the relapse phase (data not shown). Of note is that the initial disease curve progression between the three experimental groups is identical, suggesting comparable T cell activation and infiltration into the CNS among the different groups at this disease stage prior to the significant difference in the relapse rate (Fig. 1B).
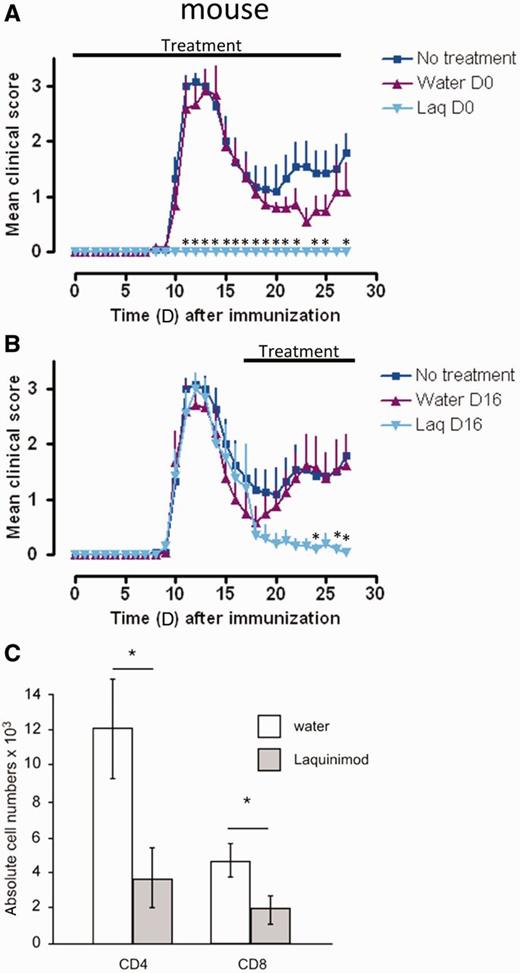
Laquinimod effectively blocks induction and relapse in EAE and reduces CNS T cell infiltration. (A) Preventive treatment of mice with laquinimod suppresses the clinical signs of disease in SJL/J mice immunized with PLP139-151. (B) Therapeutic treatment of SJL/J mice immunized with PLP139-151 from Day 16 after immunization with laquinimod ameliorates clinical disease. (C) PLP139-151 immunized SJL/J mice received laquinimod as a therapeutic treatment (started at Day 16). At Day 28 CNS-infiltrating CD4+ and CD8+ T cells were isolated, analysed by flow cytometry and absolute numbers were calculated. Shown are representatives of two individual experiments. The graphs show the mean score ± SEM of six mice per group. *P < 0.05 water versus laquinimod treatment. Laq = laquinimod.
Inhibiting influence of laquinimod on T cell proliferation
Analysing the effect of laquinimod on murine T cell proliferation in vivo using the protocol highlighted in Fig. 2A, we found a slight reduction of the 2D2 T cell proliferation compared with control mice (Fig. 2A). This response could have been caused by a direct effect of laquinimod on T cells or an indirect effect mediated via antigen-presenting cell.
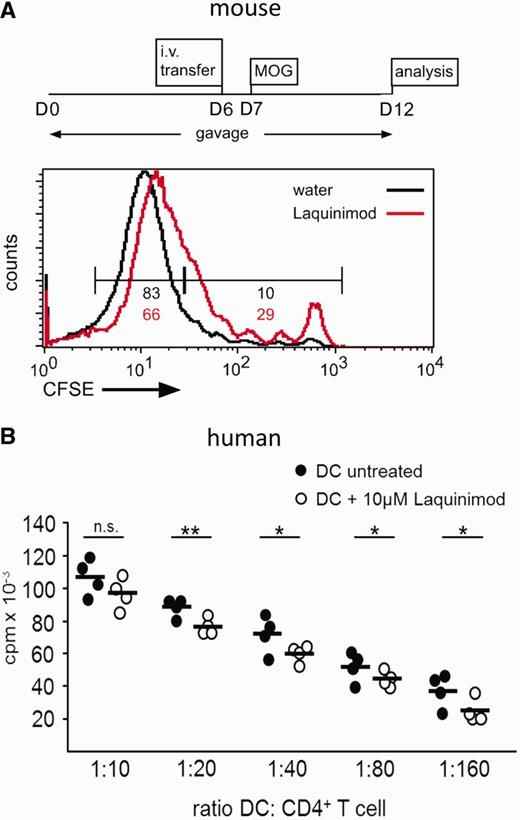
Laquinimod negatively influences T cell proliferative capacity of dendritic cells. (A) CFSE-labelled 2D2+ CD4+ T cells were transferred intravenously (i.v.) into either water- or laquinimod-treated C57BL/6 mice that received a MOG35–55 immunization 1 day later. Proliferation of transferred T cells was analysed by flow cytometry 5 days after immunization. MOG-specific transferred T cells in laquinimod-pretreated mice failed to proliferate as well as their counterparts in water-treated control mice. The graph shows one representative mouse per group of two independent experiments (B) Human monocyte-derived dendritic cell/T cell proliferation assay. CFSE = carboxyfluorescein succinimidyl ester; cpm = counts per minute; DC = dendritic cell. *P < 0.05, **P < 0.01.
To evaluate whether laquinimod has anti-proliferative properties on human T cells, CD4+ T cells of healthy subjects were polyclonally stimulated with anti-CD3 and anti-CD28 monoclonal antibody and proliferation was determined. T cell proliferation was not impaired in the presence of laquinimod (Supplementary Fig. 1A). Upon polyclonal stimulation of murine CD4+ T cells in vitro, the proliferation was not impaired by therapeutically relevant concentrations of laquinimod. However, treatment of T cells with laquinimod at very high doses (≥100 µM) showed a trend towards a reduced proliferation (Supplementary Fig. 1B).
We therefore hypothesized an indirect effect of laquinimod by antigen-presenting cells and thus most likely by dendritic cells. Proliferation of allogeneic human CD4+ T cells in response to mature monocyte-derived dendritic cells was slightly but significantly reduced when dendritic cells were pretreated with laquinimod (Fig. 2B). These data indicate that laquinimod slightly reduces the T cell stimulatory capacity of dendritic cells.
Laquinimod modulates T cell differentiation
Interestingly, we found a marked reduction in the in vivo differentiation of the transferred CD90.1+ 2D2 T cells to IL-17A-producing cells in both spleen and lymph nodes of laquinimod-treated mice (Fig. 3A). Additionally, a significant reduction in the frequency of Th1 cells could be observed in the lymph nodes. Furthermore, a small elevation in the percentage of regulatory T cells was observed, but only from the host T cells, since hardly any of the transferred 2D2 T cells differentiated into regulatory T cells.
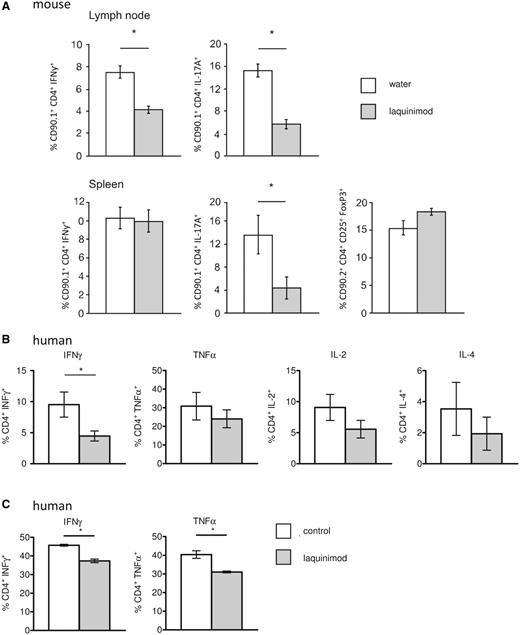
Laquinimod modulates T cell differentiation. (A) Peripheral lymphoid organ MOG-specific T cell populations from either water- or laquinimod-treated MOG35–55 immunized mice were analysed by flow cytometry. Cells were stained with CD90.1, CD4, CD25 and intracellularly with IFNγ (Th1), IL-17A (Th17) or FoxP3 (regulatory T cell). Th1 and Th17 populations were significantly reduced, while the regulatory T cell population was increased in laquinimod-treated mice compared with water-treated mice. (B) Laquinimod-treated monocyte-derived dendritic cells were co-cultured with naïve allogenic T cells, which led to a modified T helper cell differentiation with significantly reduced IFNγ-producing T cells. Detection of cytokine production of naïve T cells primed with allogeneic mature dendritic cells at a dendritic cell/T cell ratio of 1:10 by intracellular flow cytometric analysis and gating on lymphocytes. (C) Antigen-specific restimulation of autologous MBP85-99-specific T cells with MBP85-99-pulsed laquinimod-treated monocyte-derived dendritic cells led to a modified T helper cell activation with significantly reduced IFNγ- and TNFα-producing T cells. Values represent means ± SEM (n = 3), *P < 0.05.
To study the influence of laquinimod on polarization of human T cells, naïve cord blood T cells were primed by allogeneic mature monocyte-derived dendritic cells generated in the presence or absence of laquinimod (Jonuleit et al., 2000). Intracellular cytokine staining revealed a majority of TNFα- and IFNγ-producing T cells and a minority of IL-4-producing T cells when co-cultured with untreated monocyte-derived dendritic cells, which is in accordance with published literature (Klein et al., 1997; Chen et al., 2012) (Fig. 3B). Notably, IL-17 was not detectable, which is in line with previously reported findings that mature monocyte-derived dendritic cells fail to promote Th17 differentiation from naïve CD4+ T cells (Acosta-Rodriguez et al., 2007). Naïve T cells primed with laquinimod-treated monocyte-derived dendritic cells showed significantly less IFNγ-producing cells (Fig. 3B). Furthermore, we observed no significant difference in the proportion of TNFα-IL-4 and IL-2-producing cells.
To translate the antigen-specific effect of laquinimod treatment on 2D2 T cells in MOG35-55-immunized mice to the human system, in vitro-induced human MBP85-99-specific T cells were restimulated with MBP85-99-pulsed autologous mature monocyte-derived dendritic cells that had been generated in the presence or absence of laquinimod. Antigen-specific restimulation with laquinimod-treated monocyte-derived dendritic cells resulted in significantly less IFNγ- and TNFα-producing cells (Fig. 3C).
Together, these data indicate that treatment with laquinimod impaired T cell stimulatory properties of dendritic cells.
Absence of toxic effect of laquinimod at therapeutic doses in vitro
As laquinimod seems to slightly impair T cell proliferation by modulating dendritic cell properties (Fig. 2A and B), we aimed to investigate this effect on dendritic cells in mice and humans. First, a dose-effect experiment was performed to establish whether this compound could have a toxic effect on dendritic cells. Bone marrow-derived dendritic cells were incubated with different concentrations of laquinimod ranging from 1 to 250 µM. Only the highest concentration decreased the final total cell number (Supplementary Fig. 2A). In human monocyte-derived dendritic cells, no toxic effects were detectable with laquinimod-concentrations up to 10 µM. At 100 µM concentration, laquinimod significantly reduced dendritic cell yields (Supplementary Fig. 2B). Therefore, laquinimod does not exert a toxic effect on dendritic cells when applied at therapeutically relevant doses between 0.1 and 1 µM (Gurevich et al., 2010).
Finally, uptake of soluble antigens by endocytosis was measured in human immature monocyte-derived dendritic cells. Immature monocyte-derived dendritic cells demonstrated a high uptake of fluorescein isothiocyanate-dextran. However, treatment of laquinimod did not significantly alter antigen uptake by immature monocyte-derived dendritic cells (data not shown).
Laquinimod modifies a murine splenic dendritic cell subset in vivo
To assess the effect of laquinimod on dendritic cell populations in vivo, flow cytometric analysis of splenic dendritic cell subsets of C57BL/6 mice treated with laquinimod was performed. As previously described, CD4+ dendritic cells could barely be detected after 9 days of treatment and the relative proportion of CD8+ and CD4−CD8− dendritic cells were increased (Fig. 4A) (Schulze-Topphoff et al., 2012). Interestingly, one single oral administration of laquinimod was sufficient to induce modification of the dendritic cell subsets as the proportion of CD4+ dendritic cells was already reduced in the spleen by Day 1 (Fig. 4B), which is an earlier point in time than reported by Schulze-Topphoff et al. (2012). Furthermore, we observed a decrease in the mean fluorescence intensity of CD8 by laquinimod in the splenic CD8+ dendritic cells (Fig. 4C). The analysis of the co-stimulatory molecules on splenic conventional CD11c+CD11b+ dendritic cells revealed an upregulation of CD86 upon laquinimod treatment (Fig. 4D). Therefore, laquinimod affects dendritic cell subsets and their phenotypes in vivo.
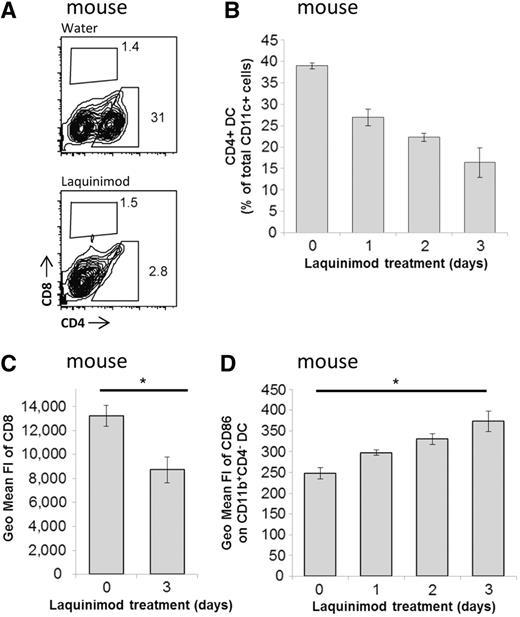
Laquinimod treatment affects dendritic cells. (A) Mice were treated daily with water or laquinimod as described. Flow cytometric analysis of splenic dendritic cells (CD11chigh) from laquinimod-treated compared with water-treated control mice revealed a reduction of the CD4+ dendritic cell population, whereas the CD8+ dendritic cell population showed a slight, yet insignificant increase. (B) Kinetics of splenic CD4+ dendritic cell depletion upon laquinimod treatment. (C) Mean fluorescence intensity of CD8 on CD11c+CD8+ dendritic cells after 3 days of laquinimod treatment. (D) Kinetic of mean fluorescence intensity (FI) of CD86 on CD11c+CD11b+CD4- dendritic cells upon laquinimod treatment in the mouse. Values represent means ± SEM (n = 3), *P < 0.05; DC = dendritic cell.
Effect of laquinimod on human dendritic cell surface markers in vitro
To analyse whether laquinimod is able to impair the maturation process of dendritic cells, we analysed surface expression levels of maturation markers and co-stimulatory molecules on human monocyte-derived dendritic cells. Upon stimulation with lipopolysaccharide, CD83 was induced and expression of CD80, CD86, CD40 and HLA-DR was upregulated in control dendritic cells as well as in laquinimod-treated dendritic cells. Of all analysed molecules, only CD86 was consistently less inducible and exhibited a lower mean fluorescence intensity on laquinimod-treated monocyte-derived dendritic cells compared with control cells (Supplementary Fig. 3A and Supplementary Data).
Laquinimod alters cytokine and chemokine expression in conventional dendritic cells with an impact on migratory properties of monocytes
Dendritic cells are a major source of different cytokines important for initiation and regulation of an immune response. Therefore, we performed a screen using multiplex kits (see ‘Materials and methods’ section) to select relevant targets, excluding undetectable factors. In supernatants of human mature monocyte-derived dendritic cell cultures treated with laquinimod, the pro-inflammatory cytokines TNFα und IL-1β were significantly reduced compared with control cultures, whereas IL-6 secretion was not modified (Fig. 5A). Levels of immunoregulatory cytokine IL-10 were also significantly decreased in the supernatants of laquinimod-treated mature monocyte-derived dendritic cells (Fig. 5A).
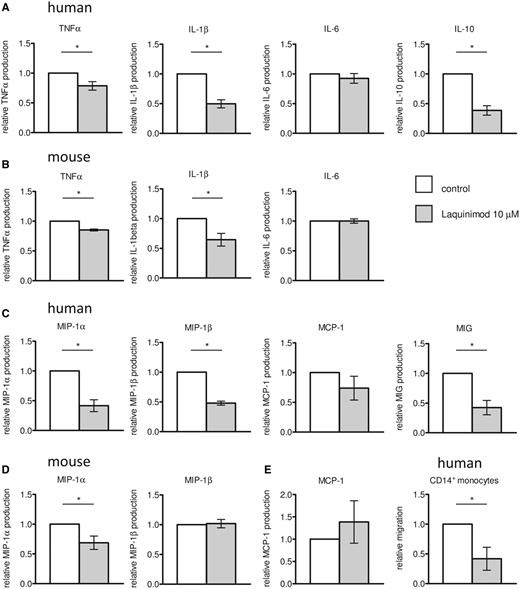
Cytokine and chemokine production by murine and human dendritic cells. Mature dendritic cells were generated by treatment with 10 µM laquinimod, their supernatants collected and cytokines (A and B) and chemokines (C and D) measured from mature monocyte-derived dendritic cell cultures (A and C) or mature bone marrow-derived dendritic cell cultures (B and D). The experimental results were summarized as mean values of relative cytokine and chemokine production ± SEM (n ≥ 3), *P < 0.05. (E) Migration of human CD14+ monocytes in response to chemokine production of human mature dendritic cells.
In accordance with the findings in human cell cultures, laquinimod decreased levels of TNFα and IL-1β in the supernatant of murine mature bone marrow-derived dendritic cells (Fig. 5B). No variation of IL-6 production was observed (Fig. 5B) and IL-10 was not detectable.
Interestingly, laquinimod also modulates the chemokine secretion by human mature monocyte-derived dendritic cells. MIP-1α, MIP-1β and MIG were significantly reduced in the supernatant of laquinimod-treated mature dendritic cells compared with untreated dendritic cells (Fig. 5C). Additionally, there was a trend towards reduced MCP-1 production. In supernatants from murine bone marrow derived-dendritic cells, MIP-1α levels were significantly decreased whereas the production of MIP-1β and MCP-1 was unchanged upon treatment with laquinimod (Fig. 5D).
Functional relevance of reduced chemokine production by mature dendritic cells was assessed in the human system by a chemotaxis assay with monocytes. Supernatants from laquinimod-treated dendritic cells demonstrated a reduced monocyte attraction compared with untreated dendritic cells (Fig. 5E). A direct inhibiting effect of laquinimod on monocyte migration was excluded by control experiments using culture medium complemented with fresh laquinimod.
Laquinimod alters cytokine and chemokine expression in vivo and reduces the frequencies of CD1c+ dendritic cells and plasmacytoid dendritic cells in blood
To translate our findings to patients, we collected blood from patients with multiple sclerosis receiving 0.6 mg laquinimod daily, untreated patients with multiple sclerosis and healthy donors (Table 1). Age should not be a confounding factor, since the mean age of the different groups is the same and, moreover, ageing has no influence on conventional dendritic cells in the age range studied (Orsini et al., 2012). The laquinimod-treated and the untreated patients with multiple sclerosis demonstrated a comparable disability as assessed by the Expanded Disability Status Scale (Table 1). The amount of human peripheral blood mononuclear cells isolated from these three groups was similar (Fig. 6A). Among these cells, the number of isolated conventional CD1c+ dendritic cells was significantly decreased in laquinimod-treated patients [1.82 ± 0.25 × 10⁵ (mean ± SEM)] in comparison with untreated patients (3.45 ± 0.63 × 10⁵) and healthy donors (4.57 ± 0.47 × 10⁵). Flow cytometric analysis of human peripheral blood mononuclear cells confirmed that among conventional dendritic cells (determined as lineage −CD11c+HLA-DR+), the percentage of the CD1c+ subset was significantly decreased under laquinimod treatment compared with healthy donors and untreated patients but also in untreated patients versus healthy donors. In contrast, the proportions of CD16+ and CD141+ conventional dendritic cell subsets were not affected (Fig. 6A). Furthermore, the proportion of plasmacytoid dendritic cell (lineage −CD11c−HLA-DR+CD303+) was significantly reduced in laquinimod-treated patients compared with the other groups (Fig. 6A).
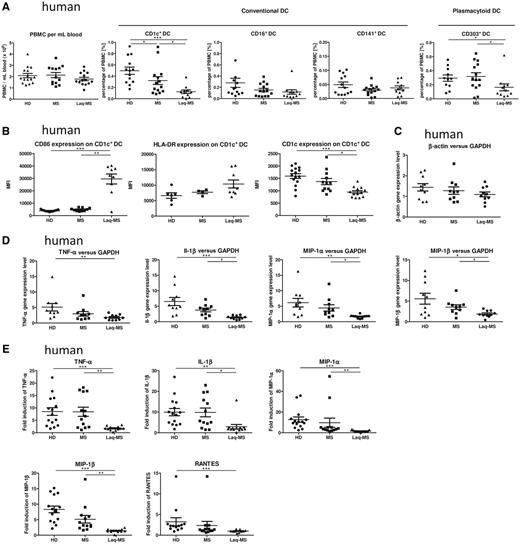
Laquinimod affects dendritic cell function in patients with multiple sclerosis. (A) Comparison of the absolute number of human peripheral blood mononuclear cells per millilitre of whole blood and comparison of peripheral blood percentages of the conventional dendritic cells: CD1c+, CD16+ and CD141+ dendritic cells, and CD303+ plasmacytoid dendritic cells. Mean values ± SEM are shown, (n ≥ 13). (B) Laquinimod significantly increases CD86 surface expression assessed by flow cytometry on isolated CD1c+ cells, whereas HLA-DR expression remains unchanged. The CD1c surface expression on these cells was significantly decreased. Mean values ± SEM are shown (n ≥ 13), ***P < 0.001. (C) Relative β-actin expression normalized to GAPDH expression in CD1c+ cells was not significantly different between the groups in our experiment conditions, thus rendering them suitable as housekeeping genes. Data are shown as mean ± SEM (n = 10). (D) Gene expression level of cytokines (TNFα, IL-1β) and chemokines (MIP-1α, MIP-1β) in isolated conventional CD1c+ cells following stimulation with lipopolysaccharide after 4 h. The experimental results represent the fold induction of the gene expression after stimulation with lipopolysaccharide normalized to GAPDH expression and are expressed as mean ± SEM (n = 10). (E) The supernatants of CD1c+ cells cultured with or without lipopolysaccharide for 24 h were collected and concentrations of cytokines (TNFα, IL-1β) and chemokines (MIP-1α, MIP-1β, RANTES) were determined with FlowCytomix. The experimental results represent the fold induction of protein secretion after stimulation with lipopolysaccharide. Mean values ± SEM are shown (n ≥ 10), *P < 0.05, **P < 0.01, ***P < 0.001. DC = dendritic cells.
Interestingly, mean fluorescence intensity of CD1c expression was also significantly reduced in laquinimod-treated patients in comparison with untreated patients and healthy donors (Fig. 6B). Moreover, we demonstrated a significant upregulation of CD86 in isolated CD1c+ cells from laquinimod-treated patients compared with untreated patients and healthy controls in the same way as in splenic conventional dendritic cells in laquinimod-treated mice (Fig. 4D), whereas HLA-DR was not significantly regulated (Fig. 6B).
TNFα, IL-1β, MIP-1α and MIP-1β gene expression was analysed with quantitative PCR in CD1c+ dendritic cells in the presence and absence of lipopolysaccharide stimulation. These genes exhibited less induction upon lipopolysaccharide treatment in dendritic cells isolated from patients treated with laquinimod versus untreated patients or healthy donors (Fig. 6D). There was no difference in gene expression between untreated patients and healthy donors (Fig. 6D). The results were consistent, independent of the housekeeping gene used (GAPDH or β-actin). The analysis of β-actin expression normalized to GAPDH expression showed no difference between the different groups, indicating that the differences observed with the genes of interest are specific (Fig. 6C).
The protein measurement realized with the supernatants of CD1c+ dendritic cells cultivated one day in the presence or absence of lipopolysaccharide corroborated this result. Upregulation of TNFα, IL-1β, MIP-1α and MIP-1β secretion upon lipopolysaccharide stimulation were similar between healthy donors and untreated patients, but significantly reduced in laquinimod-treated patients (Fig. 6E). Moreover, RANTES secretion was significantly higher in healthy donors than in laquinimod-treated patients (Fig. 6E). MIG concentration was not detectable in these experiments. Thus, CD1c+ dendritic cell isolated from laquinimod-treated patients demonstrated a significantly reduced responsiveness to lipopolysaccharide stimulation.
The biological effect of laquinimod is mediated by an inhibition of the NF-κB pathway in the mouse and the human dendritic cell
To understand the mechanisms underlying the activity of laquinimod, bone marrow-derived and monocyte-derived dendritic cells were generated in the presence or absence of laquinimod. The analysis by quantitative PCR of the expression of IKKβ and NEMO revealed that, while dendritic cells upregulate these kinases upon maturation, the incubation with laquinimod tends to counteract this (Fig. 7A and B). These two kinases are important for the degradation of IκB, an inhibitor of NF-κB. Interestingly the protein analysis revealed that in both species, the quantity of IκB was increased when the dendritic cell were submitted to laquinimod treatment (Fig. 7C). This protein is an important regulator of the canonical NF-κB pathway that is known to promote, for example, the transcription of IL-1β, TNFα or MIP-1β. Indeed, we found that the secretion of these cytokines and chemokine was reduced by dendritic cell treated with laquinimod (Fig. 5A–C) and the corresponding messenger RNA levels were downregulated in laquinimod-treated patients (Fig. 6B). In bone marrow-derived dendritic cells, the stimulation with lipopolysaccharide increased the IL-1β gene expression in control cells significantly, whereas this increase was not significant when the cells were cultured in the presence of laquinimod (Fig. 7D). Interestingly, the analysis of IL-1R2 gene expression revealed a strong upregulation by laquinimod in both immature and mature dendritic cells (Fig. 7E), whereas no modulation of IL-1R1 gene expression was detected (Fig. 7F). ICAM-1 expression is also regulated by the canonical NF-κB pathway and we were able to show that while it is highly upregulated upon lipopolysaccharide stimulation in control cells, in laquinimod-treated dendritic cells this upregulation was abolished (Fig. 7G). This could explain the reduced Th1-polarizing capacity of mature bone marrow-derived dendritic cells co-cultured with 2D2 T cells (Supplementary Fig. 4). The analysis of the non-canonical NF-κB pathway revealed that it was also altered by laquinimod treatment as the degradation of p100 to p52 was strongly impaired (Fig. 7H).
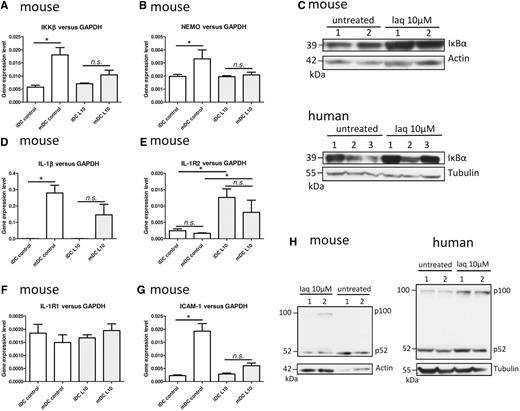
Laquinimod impairs the NF-κB pathway in dendritic cells. (A) Gene expression level of IKKβ and (B) NEMO in bone marrow-derived dendritic cells treated or not with 10 µM laquinimod (laq). (C) Western blot analysis of IκBα in cytosolic protein lysates of bone marrow- or monocyte-derived dendritic cells treated or not with 10 µM laquinimod. (D) Gene expression level of IL-1β, (E) IL-1R2, (F) IL-1R1 and (G) ICAM-1 in bone marrow-derived dendritic cells treated or not with 10 µM laquinimod. (H) Western blot analysis of p100 processing to p52 in cytosolic protein lysates of bone marrow- or monocyte-derived dendritic cells treated or not with 10 µM laquinimod. Quantitative PCR data are expressed as mean ± SEM (n = 4 independent cultures). *P < 0.05, **P < 0.01, ***P < 0.001.
Discussion
Laquinimod exerts a dose-dependent effect and the oral administration of 25 mg/kg was able to prevent EAE disease development in C57BL/6 mice immunized with MOG35-55 (Runstrom et al., 2006; Wegner et al., 2010). Having confirmed these data (data not shown), we chose a relapsing-remitting disease model by immunization of SJL mice with PLP139-151 (McRae et al., 1992) to better mimic the patient situation. Upon preventive treatment, these mice were completely resistant to EAE induction demonstrating that this effect is not strain or model dependent. Importantly, therapeutic laquinimod treatment during the first phase of remission in a PLP139-151 peptide EAE model suppressed further relapses and decreased lymphocyte infiltration to the CNS, as recently reported by Schulze-Topphoff et al. (2012) who showed a reduction in the number of the lesions within the CNS. In this model, laquinimod may either speed up the reduction of T cells from the CNS upon recovery (Di Rosa et al., 2000) or prevent a second wave of lymphocyte migration into the cerebral parenchyma. The effect of laquinimod on relapses observed in clinical trials (ALLEGRO and BRAVO trials) was slighter than one would expect from the experimental data. Interestingly, a phase II trial showed a dose-dependent effect of laquinimod on relapses and MRI lesion development (Comi et al., 2008). This discrepancy observed between mice and humans might reflect the different doses applied (25 mg/kg in mice versus 0.008 mg/kg in human), suggesting that higher doses of laquinimod in humans might improve efficiency in relapse prevention. To test this hypothesis, the drug sponsor is to initiate a third phase III clinical trial (CONCERTO trial) that will evaluate two doses of laquinimod (0.6 mg and 1.2 mg daily) in 1800 patients with relapsing-remitting multiple sclerosis for up to 24 months.
Laquinimod modulates chemokine production by dendritic cells
Dendritic cells are not only considered to be the most potent antigen-presenting cells but they are also key players in T cell differentiation and tolerance induction. Moreover, dendritic cells are an important source of chemokines (McColl, 2002). We report here that laquinimod-treated mature murine bone marrow-derived dendritic cells secrete less MIP-1α. Similarly, laquinimod significantly decreases MIP-1α, MIP-1β and MIG production by human mature monocyte-derived dendritic cells upon stimulation with lipopolysaccharide. Furthermore, we confirmed a reduced chemokine secretion in response to lipopolysaccharide in conventional CD1c+ dendritic cells isolated from laquinimod-treated patients. Interestingly, these regulations were also found at messenger RNA level, suggesting an action of laquinimod on gene transcription that is likely to be mediated by modulation of the NF-κB pathway. These chemokines are known to be involved in the induction of leucocyte recruitment to inflammatory tissue sites (Oppenheim et al., 1991). Critical in vivo evidence for an association between increase of chemokine expression in the CNS and neurological dysfunction has been published by several groups (Glabinski et al., 1998). MIP-1α, MIP-1β, MCP-1 and RANTES were reported to have increased in and around multiple sclerosis lesions and, in particular, in perivascular cells (Berman et al., 1996; McManus et al., 1998; Simpson et al., 1998). Since dendritic cells are known to localize around the vessels (Prodinger et al., 2011), they may be the relevant source of chemokine production in EAE and multiple sclerosis. A crucial role of MIP-1α over the other chemokines in the development of the disease was demonstrated by the use of anti-chemokine antibodies, which prevented the development of EAE as well as the infiltration of mononuclear cells into the CNS (Karpus et al., 1995; Manczak et al., 2002).
Interestingly, the MIP-1α receptor CCR1 was found to be under-expressed in laquinimod-treated human peripheral blood mononuclear cells from healthy subjects (Gurevich et al., 2010), which further supports an inhibition of the MIP-1α−CCR1 signalling pathway by laquinimod. This may also be explained by laquinimod-induced MIP-1α downregulation, since chemokines produced by dendritic cells not only play a role in the recruitment of other cell types but also have an auto-regulatory function, as it has been shown that they are capable of triggering and downregulating their cognate receptors (Sallusto et al., 1999). We have demonstrated the functional relevance of reduced chemokine secretion from human mature dendritic cells by significantly decreased monocyte attraction, which has been reported as being essential for the pathogenesis of EAE (Ajami et al., 2011). Interestingly, a reduced number of macrophages was found in the CNS of mice treated with a suboptimal concentration of laquinimod (0.75 mg/kg) (Thone et al., 2012). Considering these findings, the reduced secretion of chemokines by laquinimod-treated dendritic cells may be responsible for the impaired recruitment of immune cells into the CNS.
Laquinimod changes the proportions of dendritic cell subsets
One of the most important features of the dendritic cell family is that they comprise different subsets with different functions. Murine splenic dendritic cells can be classified based on surface expression of CD4 and CD8 (Vremec et al., 2000). Schulze-Topphoff et al. (2012) reported a decreased proportion of CD4+ dendritic cells, a potent dendritic cell subset, in the spleen, which we confirmed in our studies. An identical effect has already been described in mice treated with ABR-215757 (Paquinimod), another quinolone-3-carboxamide that is currently in clinical development for the treatment of systemic lupus erythematosus (Stenstrom et al., 2010). For ABR-215757, it has been suggested that the reduced number of CD4+ dendritic cells may be a result of the blockade of CD4+ dendritic cell precursor development in the spleen or a consequence of their induced emigration to the periphery (Stenstrom et al., 2010). Modification of the CD4+ dendritic cell subset is not the only one observed in the mouse spleen, as CD8 surface expression was significantly reduced on the conventional CD8+ dendritic cell subset. A model of viral antigen injection demonstrated that mouse splenic dendritic cells are plastic and that their expression of CD8 and CD4 changes after the challenge (Moron et al., 2002). Moreover, a correlation between CD8 expression and IL-12 production by dendritic cells has been proposed (Hochrein et al., 2001) that might partially explain why laquinimod treatment is associated with a reduced Th1 cell priming capacity mediated by dendritic cells, as IL-12 is a major cytokine implicated in the induction of Th1 cells (Trinchieri, 1998). This is supported by the reported decrease of intracellular IL-12/IL-23p40 staining in splenic CD11c+ dendritic cells of laquinimod-treated mice (Schulze-Topphoff et al., 2012).
In patients, it is possible to isolate conventional CD1c+ dendritic cells from human peripheral blood mononuclear cells. Here, we report a decrease of their number in human peripheral blood mononuclear cells from laquinimod-treated patients versus untreated patients and healthy controls. Recently, one study demonstrated phenotypic and functional similarities (cytokine secretion, induction of allogeneic CD4+ T cell responses) between human blood and human spleen dendritic cell subsets (Mittag et al., 2011) that might be counterparts of the mouse splenic dendritic cell (Robbins et al., 2008; Mittag et al., 2011). In this study, human CD1c+ conventional dendritic cells were suggested to be the equivalent of murine CD8-CD11b+ splenic dendritic cells. This leads us to postulate that the strong effect of laquinimod observed in murine splenic dendritic cell subsets could be translated to the patients.
CD1c expression was significantly reduced on CD1c+ dendritic cells from laquinimod-treated patients. The CD1c antigen is expressed on the major subset of conventional dendritic cells in human blood, which induces a Th1-polarized Th response (Dzionek et al., 2000; Grabbe et al., 2000). This molecule belongs to a family involved in lipid antigen presentation (Skold and Behar, 2005). Whereas originally, the speculated antigens at the origin of autoimmune attack were myelin proteins, recent data suggested that lipids can be potential targets in the context of multiple sclerosis (Kanter et al., 2006).
Furthermore, CD86 expression on conventional dendritic cells was also modulated by laquinimod administration in vivo in mice and patients with multiple sclerosis. Mean fluorescence intensity of CD86 was increased in murine splenic and human CD1c+ dendritic cells in peripheral blood. A similar observation for laquinimod has been reported on mouse monocytes (Thone et al., 2012). Other activation markers studied were not modulated. CD40 and CD80 are co-stimulatory molecules involved in Th1 responses, whereas CD86 is associated with Th2 responses (Kuchroo et al., 1995; Weber et al., 2007) and the induction of low dose oral tolerance in EAE (Liu et al., 1999). Accordingly, upregulation of CD86 on ‘semi-mature’ dendritic cells has been reported as associated with tolerance induction (Lutz and Schuler, 2002). It has been demonstrated that oestriol, a pregnancy-specific oestrogen with therapeutic efficacy in multiple sclerosis (Sicotte et al., 2002), generates tolerogenic conventional dendritic cells with upregulation of CD86, which protects against development of EAE (Papenfuss et al., 2011). Therefore, the observation of CD1c+ dendritic cells with CD86 upregulation in the blood of laquinimod-treated patients suggests that laquinimod acts through the promotion of a semi-mature differentiation-locked tolerogenic dendritic cell phenotype. CD86 was found to be induced less in vitro on human laquinimod-treated monocyte-derived dendritic cells upon lipopolysaccharide-maturation compared with control. An explanation for this pretended discrepancy is that modulation of the co-stimulatory molecule CD86 by laquinimod depends on the maturation stimuli, which differ in their ability to induce semi-mature tolerogenic or mature immunogenic dendritic cells. Thus, laquinimod in patients with multiple sclerosis promotes a semi-mature dendritic cell phenotype with increased CD86 expression but locked differentiation capacity into immunostimulatory dendritic cells, upon lipopolysaccharide treatment. This is in line with reduced chemokine and cytokine responsiveness to lipopolysaccharide stimulation of conventional dendritic cells. Additionally, we cannot exclude that modulation of CD86 expression by laquinimod differs among the different conventional dendritic cell subsets analysed in vitro and in vivo.
Laquinimod treatment in patients with multiple sclerosis also decreases the plasmacytoid dendritic cell ratio in peripheral blood, the major producers of IFNαβ required for pathogen clearance, activated by Toll-like receptor stimulation (Mittag et al., 2011). An increased percentage of plasmacytoid dendritic cells at relapse of multiple sclerosis with a subsequent decrease after short intravenous methylprednisolone therapy has been reported (Krystyna et al., 2009). How plasmacytoid dendritic cells contribute to altered immunoregulation in multiple sclerosis is poorly understood. However, immunomodulatory therapy in multiple sclerosis with IFNβ has previously been shown to act at the level of plasmacytoid dendritic cell homeostasis (Schwab et al., 2010), which suggests that laquinimod-induced reduction of plasmacytoid dendritic cells may be of therapeutic relevance.
Laquinimod affects dendritic cells by interfering with the NF-κB pathway
The observed changes in dendritic cells are most likely caused by inhibition of the NF-κB pathway, since molecular components of the NF-κB signalling pathway [(Rel A, Rel B, c-Rel, p50 (NF-κB1) and p52 (NF-κB2)] are highly expressed and accumulate in the nucleus of dendritic cells (Granelli-Piperno et al., 1995; Neumann et al., 2000). In parallel, IκBα and IκBε are also upregulated during dendritic cell development (Neumann et al., 2000). To obtain mature dendritic cells, different stimuli can be used, leading to a differential activation of the NF-κB subunits (Hofer et al., 2001). Here, we show that the canonical and the non-canonical NF-κB pathways are impaired in both murine and human dendritic cell (Figs 7 and 8). The NF-κB transcription factors regulate the expression of various immune and inflammatory genes such as interleukins and chemokines. The inhibition of the NF-κB translocation to the nucleus has been shown to block dendritic cell maturation and thus prevent their ability to induce T cell differentiation (Rescigno et al., 1998; Tas et al., 2005). Interestingly, a microarray analysis carried out using human peripheral blood mononuclear cells from healthy donors and patients with multiple sclerosis revealed that a 1-day in vitro treatment with laquinimod modified the expression of proteins implicated in the NF-κB pathway (Gurevich et al., 2010). Specifically, a NF-κB inhibitor (NF-κBIE) was over-expressed, accompanied by the suppression of BTRC, an enzyme involved in the ubiquitination of NF-κBIE. The latter should lead to the inactivation of NF-κB by preventing its translocation to the nucleus. In parallel, upon treatment with laquinimod they found a downregulation of genes known to be dependent of NF-κB transcription factors such as CXCL9, LY9 or ICAM-1 (Gurevich et al., 2010). The latter is an adhesion molecule upregulated during maturation of dendritic cells (Grauer et al., 2002) and highly expressed by spinal perivascular macrophages during EAE (Hofmann et al., 2002). Through its interaction with LFA-1 or Mac-1, ICAM-1 may be involved in both activation and extravasation of leucocytes (Samoilova et al., 1998).
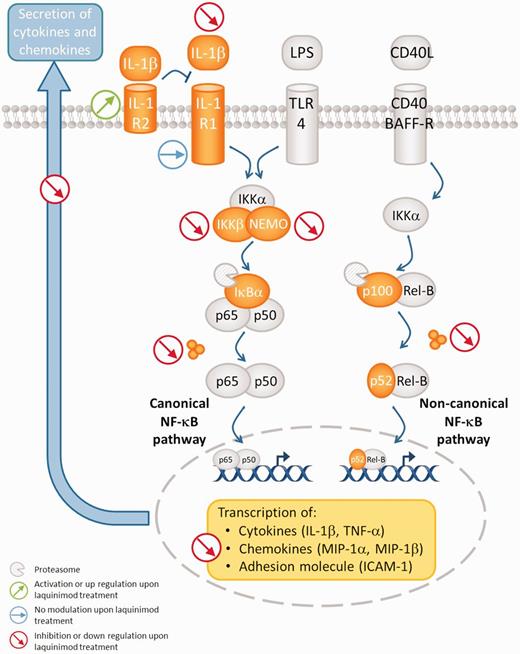
Schematic representation of laquinimod activity on dendritic cells. Upon laquinimod treatment, canonical and non-canonical NF-κB pathways are impaired in dendritic cells matured with lipopolysaccharide. These modifications lead to a decreased transcription of chemokines and cytokines.
Interestingly, a recent study on murine astrocytes also reported a modulation of NF-κB pathway upon laquinimod treatment (Bruck et al., 2012).
Lipopolysaccharide and IL-1β are two known activators of the NF-κB pathway through binding to their respective receptors, TLR4 and IL-1R1. An interesting finding we report here is that laquinimod induced an increase in IL-1R2 gene expression in bone marrow-derived dendritic cells independently if the cells were immature or matured with lipopolysaccharide. In contrast, the IL-1R1 was not regulated by laquinimod. IL-1R2 is a decoy receptor that sequesters IL-1β and cannot initiate subsequent signalling events, thereby preventing inflammation (Dinarello, 2011). At the clinical level, the expression of IL-1R2 was proposed to participate in the anti-inflammatory effect of glucocorticoids (Vambutas et al., 2009).
Laquinimod reduces T cell stimulatory capacity of dendritic cells
A reduced number of T cells in the CNS may result from a reduced T cell activation and expansion. We demonstrated in vitro that proliferation of human T cells co-cultured with laquinimod-treated mature monocyte-derived dendritic cells was slightly but significantly reduced. We conclude that laquinimod reduces the T cell stimulatory capacity of dendritic cells, which has been shown to be necessary for the survival of encephalitogenic T cells in the effector phase of the immune response (Greter et al., 2005).
Cytokines secreted by dendritic cells are critical messengers that control T cell activation and differentiation. Treatment of human and murine mature dendritic cells in vitro with laquinimod significantly reduced the production of the pro-inflammatory cytokines TNFα and IL-1β. Interestingly, a similar result was obtained with CD1c+ cells isolated from laquinimod-treated patients with multiple sclerosis. These cytokines have been shown to promote CNS tissue damage in EAE (Centonze et al., 2009; Rossi et al., 2010). In humans, IL-1β is required for Th17 differentiation (Hebel et al., 2011) and in mice, it synergizes with IL-6 and IL-23 in induction of Th17 cells (Chung et al., 2009). In addition to its potential direct toxicity, TNFα perpetuates the inflammatory process through recruitment of cells (Skarica et al., 2009). It must be stated, however, that the regulatory cytokine IL-10 was also decreased in human dendritic cells treated with laquinimod. However, the ratio of IL-10 to IL-12 defines the regulatory potential of IL-10 (Saraiva et al., 2009). Correspondingly, reduced IL-10 production of splenocytes has previously been described in MOG-immunized mice treated with laquinimod (Wegner et al., 2010).
In addition, differentiation of T cells was modified by laquinimod treatment; we found fewer Th1 (IFNγ-producing cells) and Th17 (IL-17-producing cells) cells in line with reported data (Zou et al., 2002; Yang et al., 2004; Wegner et al., 2010). Similarly, laquinimod impacted T cell differentiation shown in co-culture experiments in the human system in which naïve T cells stimulated by allogeneic laquinimod-treated monocyte-derived dendritic cells resulted in reduced IFNγ production. Therefore, laquinimod treatment of mature monocyte-derived dendritic cells reduces their Th1-polarizing capacity to prime naïve T cells. However, in this assay the stimulation of allogeneic naïve T cells is based on mismatches in human leucocyte antigen classes between the different donors for the two cell types. Therefore, to translate the antigen-specific effect on 2D2 T cells in MOG35-55-immunized laquinimod-treated mice to the human system, the antigen-specific human T cell activation by mature monocyte-derived dendritic cells was assessed in an autologous mixed leucocyte reaction. We found that restimulation of autologous MBP85-99-specific T cells with MBP85-99-pulsed laquinimod-treated monocyte-derived dendritic cells led to an altered T cell activation with significantly reduced IFNγ- and TNFα-producing T cells. These findings correspond with two recently published studies which reported that laquinimod impacts antigen-presenting capacity of dendritic cells and monocytes (Schulze-Topphoff et al., 2012; Thone et al., 2012). As a possible explanation for this altered T cell differentiation we found a reduced gene expression of ICAM-1 in mature dendritic cells treated with laquinimod. Indeed, ICAM-1 plays a central role in forming an immunological synapse at T cell–antigen-presenting cell contact sites via interaction with LFA-1, thereby enhancing immune responses (Monks et al., 1998; Grakoui et al., 1999).
In this investigation, we confirmed, to our knowledge for the first time, the modulation of dendritic cells by laquinimod in human in vitro and, most notably, in vivo. A comparable reduction of the Th1-polarizing capacity of human monocyte-derived dendritic cells as a potential action mechanism in multiple sclerosis has been reported previously for fingolimod (Muller et al., 2005) and fumarate (Ghoreschi et al., 2011). Copaxone has been shown to modulate the properties of both monocytes and dendritic cells (Weber et al., 2004, 2007). Recently, daclizumab, a humanized monoclonal antibody against CD25 with limited effects on polyclonal T cell activation, has been reported to potently inhibit activation of antigen-specific T cells through modification of mature dendritic cells (Wuest et al., 2011).
At the time of writing, given the ambiguous results from the phase III clinical trials, Teva Pharmaceutical Industries had not yet filed a new drug application to the Food and Drug Administration for laquinimod and will perform further trials. The application for regulatory approval for the European market by the European Medicines Agency is planned in the second half of 2012. Our data indicate that laquinimod exerts its disease-modulating activity by modulating dendritic cells by interfering with the NF-κB pathway and subsequently, T cell responses. These findings support the assumption that laquinimod shares activities with other disease modifiers in modulating dendritic cell function, representing a highly relevant step in the multiple sclerosis pathology.
Funding
This study has been supported by the German Research Foundation (SFB-TR 128/B4 to F.Z., SFB-TR 128/A7 to A.W.) and an unrestricted grant from Teva Pharmaceutical Industries, Nettanya, Israel.
Supplementary material
Supplementary material is available at Brain online.
Acknowledgements
We thank Dr Christina F. Vogelaar for support with quantitative PCR analysis. We thank Heike Ehrengard, Birgit Hohmann, Christin Liefländer, Christine Oswald, Ilona Kirchhoff, Heike Fraenkle and Dr Maria Emma Rodegher for technical assistance and Richard Hill and Christie Dietz for reading the manuscript as native speakers.
Abbreviation
References
Author notes
*These authors contributed equally to this work.

