


Abstract
The relationship between spontaneous brain activity and behaviour following focal injury is not well understood. Here, we report a large-scale study of resting state functional connectivity MRI and spatial neglect following stroke in a large (n = 84) heterogeneous sample of first-ever stroke patients (within 1–2 weeks). Spatial neglect, which is typically more severe after right than left hemisphere injury, includes deficits of spatial attention and motor actions contralateral to the lesion, and low general attention due to impaired vigilance/arousal. Patients underwent structural and resting state functional MRI scans, and spatial neglect was measured using the Posner spatial cueing task, and Mesulam and Behavioural Inattention Test cancellation tests. A principal component analysis of the behavioural tests revealed a main factor accounting for 34% of variance that captured three correlated behavioural deficits: visual neglect of the contralesional visual field, visuomotor neglect of the contralesional field, and low overall performance. In an independent sample (21 healthy subjects), we defined 10 resting state networks consisting of 169 brain regions: visual-fovea and visual-periphery, sensory-motor, auditory, dorsal attention, ventral attention, language, fronto-parietal control, cingulo-opercular control, and default mode. We correlated the neglect factor score with the strength of resting state functional connectivity within and across the 10 resting state networks. All damaged brain voxels were removed from the functional connectivity:behaviour correlational analysis. We found that the correlated behavioural deficits summarized by the factor score were associated with correlated multi-network patterns of abnormal functional connectivity involving large swaths of cortex. Specifically, dorsal attention and sensory-motor networks showed: (i) reduced interhemispheric functional connectivity; (ii) reduced anti-correlation with fronto-parietal and default mode networks in the right hemisphere; and (iii) increased intrahemispheric connectivity with the basal ganglia. These patterns of functional connectivity:behaviour correlations were stronger in patients with right- as compared to left-hemisphere damage and were independent of lesion volume. Our findings identify large-scale changes in resting state network interactions that are a physiological signature of spatial neglect and may relate to its right hemisphere lateralization.
Introduction
A fundamental challenge for clinical neuroscience is to understand the neural mechanisms underlying behavioural dysfunctions after brain injuries. Advances in cognitive neuroscience emphasize the importance of networks of brain regions, and their role in the segregation and integration of information required for cognition (Mesulam, 1990; Tononi et al., 1999; Friston, 2009; Bressler and Menon, 2010; Sporns, 2013). Brain networks related to specific functions (e.g. vision, attention, motor) can be identified at rest in the absence of any task or stimuli (hence resting state networks) by measuring the temporal correlation (functional connectivity) of the blood oxygenation level-dependent signal with functional MRI (Power et al., 2011; Yeo et al., 2011; Hacker et al., 2013).
It has been proposed that abnormalities in the functional organization of these networks after brain injury play a fundamental role in the pathogenesis of behavioural deficits, and their recovery (Corbetta, 2012). Accordingly, studies in brain damaged patients indicate that stroke induces changes in functional connectivity (He et al., 2007; Carter et al., 2010; Nomura et al., 2010; Ovadia-Caro et al., 2013; Varoquaux et al., 2014; Wang et al., 2014), and critically, these changes are associated with behavioural deficits [He et al., 2007; Carter et al., 2010; Wang et al., 2010; see Varsou et al. (2013) for a review]. Similar results have been reported in rodents (van Meer et al., 2012).
Here we examine changes of functional connectivity within and across large-scale resting state networks following stroke. We focus on spatial neglect, a syndrome affecting ∼20–30% of all stroke patients (Buxbaum et al., 2004; Ringman et al., 2004) (∼250–300 000 cases per year in the USA alone). Spatial neglect is characterized by a contralesional spatial bias, i.e. a deficit in processing and responding to stimuli on the side of space or body opposite the lesion (Halligan et al., 1989; Verdon et al., 2010; Corbetta and Shulman, 2011) and is correlated with deficits in vigilance/arousal that lead to delayed responses and overall poor performance (i.e. a non-spatial deficit) (Husain et al., 1997; Duncan et al., 1999; Husain and Rorden, 2003). Previous studies have also reported that spatial deficits in neglect can be fractionated into subtypes, such as perceptual versus intentional (Bisiach et al., 1990), personal space versus extra-personal space (Committeri et al., 2007), or egocentric versus allocentric representation (Chechlacz et al., 2012), suggesting that spatial neglect is a heterogeneous syndrome.
The pathogenesis of spatial neglect remains controversial despite 75 years (Brain, 1941) of intensive research (for reviews see Husain and Rorden, 2003; Corbetta and Shulman, 2011; Bartolomeo et al., 2012; Karnath and Rorden, 2012). Based on our previous studies on small samples of stroke patients, we have proposed that specialized dorsal fronto-parietal regions, despite their structural integrity, exhibit in neglect patients abnormal interhemispheric task-evoked responses (Corbetta et al., 2005; cf.Umarova et al., 2011 for opposite findings) and resting state functional connectivity (He et al., 2007; Carter et al., 2010); moreover, these dysfunctions correlate with the severity of neglect (Corbetta et al., 2005; He et al., 2007; Carter et al., 2010).
To test the hypothesis that abnormalities in functional networks not directly damaged by stroke play a central role in the pathophysiology of spatial neglect, we measured spatial neglect and functional connectivity with functional MRI in a large heterogeneous sample of right and left hemisphere stroke patients (n = 84), prospectively selected based on the presence of a first time stroke and ‘any’ neurological deficit. These inclusion criteria make the sample clinically valid and ensure an unbiased distribution of neglect-inducing lesions. In addition, we measured neglect using a combination of tasks to assess spatial and general attention (as a proxy for vigilance/arousal), and exploratory motor behaviour. Given the multi-modal sensory, motor, and cognitive impairments present in neglect (DeRenzi, 1982; Mesulam, 1985), we extended our analysis to multi-network interactions across 10 resting state networks, including sensory (visual, auditory), motor, language, and multiple control networks (default, dorsal and ventral attention, fronto-parietal, and cingulo-opecular). These networks have recently been identified using a variety of different hypothesis- and data-driven methods (Power et al., 2011; Yeo et al., 2011; Hacker et al., 2013).
We test several predictions concerning the pathogenesis of spatial neglect. First, previous studies showed a linkage between spatial and non-spatial attention deficits (Robertson et al., 1995, 1998) as well as a co-occurrence of attention, perceptual and motor impairments (DeRenzi, 1982; Mesulam, 1985). Therefore, we expect spatial and non-spatial attention deficits, as well as motor biases, to be mutually correlated. Importantly, correlated behavioural deficits will correspond to common patterns of abnormal functional connectivity across multiple networks. Based on two previous small group studies (n = 11 and n = 23, respectively; He et al., 2007; Carter et al., 2010), we predict bilateral loss of interhemispheric functional connectivity in attention-related networks. However, because neglect typically affects both sensory and motor functions (DeRenzi, 1982; Mesulam, 1985), we examined the possibility that functional connectivity disruptions will extend broadly to sensory (auditory, visual) and motor networks. Secondly, multi-network functional connectivity changes, as a correlate of neglect, should be more severe in patients with right hemisphere as compared to left hemisphere lesions. Thirdly, we investigated the relationship between behaviourally relevant changes in functional connectivity and lesion topography as well as volume. More generally, our analyses aim to shed light on the behavioural significance of spontaneous activity changes after brain injury.
Materials and methods
Participants
To obtain a sample of patients in which the frequency and severity of neglect is representative of a clinical population, patients were not selected on the basis of neurologic deficit or lesion location. Instead, individuals affected by a first stroke were enrolled within 2 weeks of stroke onset. The sample consisted of 88 patients (49 male) with an average age of 52.6 years [standard deviation (SD) = 11.4, with a range from 19 to 76 years], see Supplementary material for inclusion/exclusion criteria. The sample included 47.7% (n = 42) right hemisphere damaged (RHD), 47.7% (n = 42) left hemisphere damaged (LHD), and 4.6% (n = 4) bilateral stroke patients. Bilateral strokes were detected only after the imaging session, and were not considered in the imaging analysis. A control group of 30 healthy individuals matched for age and education was also studied [average age 55.7 years (SD = 11.5) with a range from 21 to 83 years]; see Supplementary material.
Behavioural testing
Core deficits of spatial neglect were assessed by the Posner Visual Orienting Task (Posner, 1980; Posner et al., 1984; Kincade et al., 2005) and two cancellation tests: Mesulam Unstructured Symbol Cancellation Test (Mesulam, 1985) and Behavioural Inattention Test (Wilson et al., 1987) (Fig. 1B–D). These tests were selected for their high sensitivity, as reported in our previous study (Rengachary et al., 2009). The behavioural evaluation was conducted on average 12 days (SD = 4) after the stroke episode.
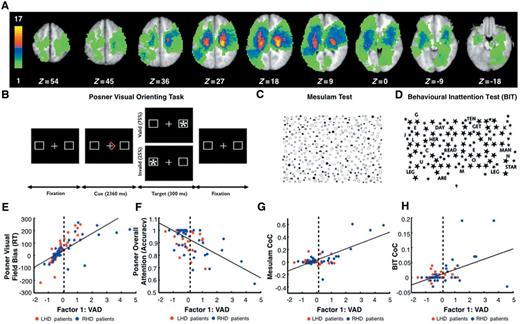
Lesion topography and performance in tests of spatial attention. (A) Lesion density in the sample of patients contributing to the functional connectivity:VAD analyses (n = 84). Colour bar indicates the number of patients with a lesion in a given voxel. (B) Posner Visual Orienting Task. (C) Mesulam Test. (D) Behavioural Inattention Test (BIT) (see ‘Materials and Methods’ section). Scatter plots show the relation between Visual Attention Deficit (VAD) and several performance measures: Posner visual field bias reaction time (RT) (E); Posner overall attention (accuracy) (F); Mesulam centre of cancellation (CoC) (G) and Behavioural Inattention Test centre of cancellation (H). Blue and red dots indicate right (RHD) and left (LHD) hemisphere damaged patients, respectively. Vertical dashed lines indicate the mean plus two standard deviations of VAD scores in age-matched controls. Patients on the right of the dashed line were classified as exhibiting neglect (N+); those on the left of the dashed line were classified as not exhibiting neglect (N−).
During the Posner task (Posner, 1980; Posner et al., 1984; Kincade et al., 2005), patients were required to maintain central fixation and to attend to one side of the monitor (left or right) based on a cue, an arrow (2360 ms) indicating the likely location of an upcoming target (left or right). After a variable delay (from 1000 to 2000 ms), the target (an asterisk) appeared for 300 ms on the left or right side. On 75% of the trials, the target appeared at the location indicated by the cue (valid condition); on 25% of the trials it appeared at the opposite location (invalid condition). Participants had to detect the target as quickly as possible with a key-press. Patients responded using the ipsilesional hand; control subjects responded using the dominant hand (Supplementary material).
The Mesulam test (Mesulam, 1985) consists of a pseudo-random array of 60 target symbols with several hundred distracters, presented on paper. Patients were asked to mark the targets with a pencil.
The Behavioural Inattention Test (Wilson et al., 1987) consists of a pseudo-random array of 54 targets with 52 distracters, presented on paper. Subjects responded with pencil marks.
Neglect measures
Six measures were derived from the Posner task scores: Posner Overall Attention (mean performance), Posner Visual Field Bias (difference in performance for target presented in the ipsilesional versus contralesional visual field) and Posner Validity Effect (difference in performance for validly versus invalidly cued target), with separate measures for reaction time and accuracy. For the Mesulam and Behavioural Inattention Test tests, we calculated the centre of cancellation, that is, the lateralized centre of mass of hits, using the software provided by Rorden and Karnath (2010), for contralesional versus ipsilesional hits. For each patient, the six measures from the Posner task and the centre of cancellation (Rorden and Karnath, 2010) scores from the Mesulam and Behavioural Inattention Test tests were entered into a principal component analysis (PCA) with oblimin rotation. The analysis was conducted using Statistical Package for the Social Sciences (SPSS, v.20) software.
Functional MRI scanning and data preprocessing
MRI was performed with a Siemens 3 T Tim-Trio scanner at the Washington University School of Medicine (WUSM). Eighty-eight patients underwent a scanning session within 1–2 weeks after the stroke (mean = 12 days, SD = 4 days), including: structural, functional and diffusion tensor scans. Structural scans consisted of: (i) a sagittal T1-weighted magnetization-prepared rapid gradient-echo (repetition time = 1950 ms, echo time = 226 ms, flip angle = 9°, voxel size = 1.0 × 1.0 × 1.0 mm); (ii) a transverse T2-weighted turbo spin-echo (repetition time = 2500 ms, echo time = 442 ms, voxel-size = 1.0 × 1.0 × 1.0 mm); and (iii) sagittal FLAIR (repetition time = 7500 ms, echo time = 326 ms, voxel-size = 1.5 × 1.5 × 1.5 mm). Resting state functional scans were acquired with a gradient echo EPI sequence (repetition time = 2000 ms, echo time = 27 ms, 32 contiguous 4 mm slices, 4 × 4 in-plane resolution) during which participants were instructed to fixate on a small cross in a low luminance environment. Seven resting state functional MRI runs, each including 128 volumes (30 min total) were acquired. Upon inspection of the anatomical images, four subjects were found to have multi-focal strokes and were removed from the imaging analysis.
Preprocessing of functional MRI data included the following steps: (i) compensation for asynchronous slice acquisition using sinc interpolation; (ii) elimination of odd/even slice intensity differences resulting from interleaved acquisition; (iii) whole brain intensity normalization to achieve a mode value of 1000; (iv) spatial realignment within and across functional MRI runs; and (v) resampling to 3 mm3 voxels in atlas space including realignment and atlas transformation in one resampling step. Cross-modal (e.g. T2-weighted → T1-weighted) image registration was accomplished by aligning image gradients (Rowland et al., 2005). Cross-modal image registration in patients was checked by comparing the optimized voxel similarity measure to the 97.5 percentile obtained in the control group. In some cases, structural images were substituted across sessions to improve the quality of registration.
In preparation for the functional connectivity MRI analysis, data were passed through several additional preprocessing steps (Fox et al., 2005, 2009): (i) spatial smoothing (6 mm full-width at half-maximum Gaussian blur in each direction); (ii) temporal filtering retaining frequencies in the 0.009–0.08 Hz band; and (iii) removal of the following sources of spurious variance unlikely to reflect spatially specific functional correlations through linear regression: (i) six parameters obtained by rigid body correction of head motion; (ii) the signal averaged over the whole brain; (iii) signal from a ventricular region of interest; and (iv) signal from a region centred in the white matter.
Quality control of resting state functional MRI data
Motion contaminated frames were identified using the DVARS measure (root mean square change of the temporally differentiated functional MRI data averaged over the brain) (Power et al., 2012). The DVARS threshold value for eliminating frames due to motion was defined as 2 SD above the mean DVARS in the age-matched control subjects (0.46 root mean square functional MRI signal change in units of %). This frame-censoring criterion was uniformly applied to all resting state functional MRI data (patients and controls) before functional connectivity computations.
Lesion segmentation
Lesions were manually segmented using Analyze biomedical imaging software (www.mayo.edu) system by inspection of the structural images (T1-weighted, T2-weighted, FLAIR), simultaneously displayed in atlas space. All segmentations were reviewed by two neurologists (M.C. and A.C.) with special attention to distinguishing lesion from CSF and haemorrhage from surrounding vasogenic oedema.
Resting state networks
In an independent sample of young adults, we defined 10 resting state networks containing 169 regions of interest (hereafter called ‘nodes’). The procedure for defining the nodes is fully described in our previous study by Hacker et al. (2013) and in Supplementary Fig. 2. Resting state networks are displayed in Supplementary Fig. 3.
Resting state functional connectivity mapping
Voxel-wise resting state functional connectivity maps were computed for each node by extracting the time course for the node and computing the correlation coefficient (Pearson r) between that time course and the time course from all other brain voxels. Pearson correlations were Fisher z-transformed before further analyses, thereby generating z(r) maps. Importantly, when computing a group voxel-wise functional connectivity map for a node, any subject whose lesion included the node was excluded. Moreover, when computing the value of a group voxel-wise functional connectivity map for a node at a particular voxel, any subject whose lesion included the voxel was excluded. Therefore, none of the functional connectivity measures in the paper were based on structurally damaged regions.
Functional connectivity:behaviour correlation
To relate behavioural deficits to whole brain functional connectivity maps, we applied a previously described technique in which behavioural measures are correlated with voxel-wise correlation maps (Baldassarre et al., 2012) (see Fig. 2 for analysis flowchart). A separate analysis was conducted for each hemisphere involving 91 nodes consisting of the nodes belonging to the hemisphere and the nodes falling on the midline. Although the nodes were confined to a single hemisphere, the generated voxel-wise maps extended over the whole brain, i.e. involved both hemispheres.
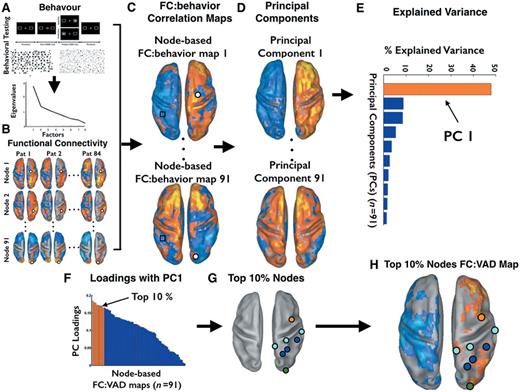
Analysis flowchart of steps involved in the computation of functional connectivity:behaviour correlation maps. The figure displays the pipeline of the functional connectivity and behaviour correlational analysis. Except panel B, all other panels display maps and bar graphs derived from real data. (A) Behavioural test: Posner Cueing Task, Mesulam and Behavioural Inattention Test, Behavioural Inattention Test (top). See ‘Behavioural Testing’ section in the main text for detailed information. On the bottom, scree plot of the PCA on the behavioural tests. (B) Voxel-wise functional connectivity. Dorsal view of voxel-wise functional connectivity maps projected on the Population-Average, Landmark- and Surface-based atlas (PALS) (Van Essen, 2005). Each row indicates a node, while columns indicate individual patients. Orange-yellow colours indicate voxels with positive functional connectivity with the node; blue-cyan colours indicate negative functional connectivity, see ‘Resting state functional connectivity mapping’ section for details. (C) Functional connectivity (FC):behaviour correlation. Dorsal view of voxel-wise functional connectivity:behaviour maps, projected on the PALS. Blue-cyan colours indicate voxels showing negative correlation between the performance measure (VAD) and the functional connectivity of that voxel (see black square) with the node. Orange-yellow colours indicate positive correlation. (D) PCA of functional connectivity: behaviour maps. Dorsal view of voxel-wise principal component (PC) maps. The PC maps are sorted by the amount of explained variance (from the highest PC #1 to the lowest, PC #91). (E) Explained variance across functional connectivity:behaviour maps. Bar graph displays the amount of explained variance by each principal component derived from the PCA on the 91 functional connectivity:behaviour maps. The first bar (in orange) refers to the PC1 accounting for the largest amount of variance across the nodes. (F) Loadings of the functional connectivity:behaviour maps for each node on the first principal component. The maps are sorted by the absolute value of the loadings. Bars in orange refer to the top 10% node-based functional connectivity:behaviour maps for the PC1. (G) The top 10% nodes with the highest loading on the first principal component. (H) The functional connectivity:behaviour map computed from the top 10% nodes. This map represents the most consistent functional connectivity:behaviour associations. Blue-cyan colours indicate negative functional connectivity:behaviour correlation (low functional connectivity = high deficit), whereas orange-yellow colours indicate positive correlation (high functional connectivity = high deficit).
The overarching logic of the analysis was to generate voxel-wise functional connectivity maps for each node (Step 1); to compute the correlation across subjects between these maps and behavioural scores (Step 2); to determine through a data reduction operation with PCA whether these voxel-wise functional connectivity:behaviour correlation maps were consistent across nodes (Step 3); to select the most representative nodes and networks, i.e. those yielding the maps with the highest loadings on the first principal component of the PCA (Step 4); to display the average functional connectivity:behaviour maps from the most representative nodes (Step 5).
As shown in Fig. 2C, 91 functional connectivity:behaviour maps were generated, one map for each node. Step 3, spatial PCA of the 91 maps yielded 91 Principal Components (PC) maps sorted by the amount of explained variance across nodes (Fig. 2D). Spatial PC1 accounted for the most variance across nodes (48% for the right hemisphere analysis, 43% for the left hemisphere analysis) (Fig. 2E). Step 4, we rank-ordered the absolute values of the loadings of PC1 (Fig. 2F) to identify the top 10% of nodes contributing to PC1 (Fig. 2G). Step 5, a functional connectivity:behaviour map was then regenerated by averaging the functional connectivity maps for the top 10% nodes and then correlating the average functional connectivity map with the visual attention deficit (VAD) scores. The Pearson r-values were transformed first into t-scores and then into Z-scores over the population (Fig. 2H). The final Z-statistic maps then were thresolded (|Z| > 3, P < 0.05, cluster size 17 voxels) to retain only statistically significant clusters accounting for multiple comparisons (Fig. 2H).
Results
Lesion topography
The distribution of lesions indicated that most strokes involved the middle cerebral artery territory, with the most common region of damage (18% of patients) bilaterally in thalamus/putamen (Fig. 1A). About half of the lesions were in the right hemisphere (47.7% of the sample). This distribution is consistent with other prospective studies (Kang et al., 2003; Wessels et al., 2006).
Principal component analysis of neglect measures
A PCA was conducted on the measures from the Posner Task, Behavioural Inattention Test and Mesulam tests (see ‘Materials and methods’ section). The PCA revealed three factors with an eigenvalue >1, accounting for 66% of the total behavioural variance (Supplementary Fig. 1A and Supplementary material). The first factor, the VAD, accounted for 34% of the variance and provided the basis for all subsequent functional connectivity:behaviour analyses. The VAD, factor reflected both the degree of visual field bias and motor bias, and the level of general performance. A higher VAD score indicated: (i) poorer performance for contralesional as compared to ipsilesional targets on the Posner Task, a measure of Visual Field Bias; (ii) centre of cancellation scores on the Mesulam and Behavioural Inattention Test tasks that were shifted more into the ipsilesional field, a measure likely reflecting both visual field bias and motor bias; and (iii) poorer overall accuracy in the Posner Task, indicating lower general performance (Fig. 1E–H). Therefore, the single factor VAD combined three correlated components of spatial neglect, consistent with the idea that spatial neglect is a multi-component syndrome (DeRenzi, 1982; Mesulam, 1985).
A patient was considered to have neglect if their VAD score was >2 SD above the average of age-matched controls (see dots to the right of the vertical dashed line in Fig. 1E–H). Twenty-four of 88 patients (27% of the sample, an incidence in line with previous studies: Buxbaum et al., 2004; Ringman et al., 2004) were classified as neglect patients, of whom 14 patients with right hemisphere strokes and left field neglect (RHD N+), and 10 patients with left hemisphere stroke and right-field neglect (LHD N+). VAD scores were significantly higher in the RHD N+ as compared to LHD N+ group [t(22) = 2.3; P = 0.03].
This result indicates that neglect occurs acutely after both right and left hemisphere lesions, as previously reported (Stone et al., 1993) (for opposing results see Suchan et al., 2012), but is more severe after right hemisphere damage (Weintraub and Mesulam, 1987; Gainotti et al., 1990). Patients with persistent neglect are mostly right hemisphere damaged (Stone et al., 1991).
The other two factors were General Attention Performance and Validity Effect, and explained 17% and 15% of the behavioural variance, respectively. General Attention Performance factor describes the general performance in the Posner Task, whereas Validity Effect factor captures the difference in performance between validly and invalidly cued trials of the Posner task. General Attention Performance factor loaded with Posner overall attention (reaction times and accuracy) (loading = 0.692 and −0.512) and Posner validity (reaction times) (loading = 0.731). A high score for General Attention Performance factor indicates poor general performance and slower responses for invalidly versus validly cued targets. Validity Effect factor loaded positively with Posner validity (Accuracy) (loading = 0.901) but negatively with Posner validity (reaction times) (loading = −0.449), and loaded positively with Behavioural Inattention Test (centre of cancellation) (loading = 0.557). Overall, patients with high score for Validity Effect factor were more accurate but slower for validly than invalidly cued targets. A more detailed description of these two factors is reported in the Supplementary material.
Principal component analysis of correlation maps between functional connectivity and neglect
Using a newly developed method based on neural network classification of resting state network assignment at the level of single subjects or groups of subjects (Hacker et al., 2013), we defined in an independent sample of young adults, 10 resting state networks and 169 regions of interest (called ‘nodes’). The 10 resting state networks consisted of: dorsal and ventral attention (DAN, VAN); visual (foveal and peripheral, VFN, VPN), motor (MN), auditory (AN), default (DMN), language (LN), and fronto-parietal and cingulo-opercular control networks (FPN, CON) (Supplementary Fig. 3A). The spatial topography of these resting state networks (Supplementary Fig. 3B) is similar to the topographies reported in other recent studies (Power et al., 2011; Yeo et al., 2011; Hacker et al., 2013).
We next asked which resting state networks and functional connectivity patterns of specific nodes were more strongly associated with neglect impairment. To extract robust information about behaviourally relevant functional connectivity patterns, we modified a method (Baldassarre et al., 2012) in which the strength of functional connectivity to/from each node is correlated with a behavioural score. The analysis is outlined in the ‘Materials and methods’ section. Here we provide an intuitive description shown in graphic form in Fig. 2. The overarching logic of the analysis was to generate voxel-wise functional connectivity maps for each node (Step 1); to compute the correlation across subjects between these maps and behavioural scores (Step 2); to determine with a PCA whether these voxel-wise functional connectivity:behaviour correlation maps were consistent across nodes (Step 3); to select the most representative nodes and networks, i.e. those yielding the maps with the highest loadings on the first principal component of the PCA (Step 4); to display the average functional connectivity:behaviour maps from the most representative nodes (Step 5).
First, the analysis was run on 91 nodes in the right hemisphere. The PCA of functional connectivity:behaviour maps for each node yielded a first principal component (PC1) that accounted for 48% of the variance across nodes in the correlation between visual attention deficit and functional connectivity [see Fig. 2E for the percentage of variance explained by each principal component (from 1 to 10) by variance]. Intuitively, PC1 is a spatial map that shows the most consistent functional connectivity patterns across many nodes that are associated with neglect. The most represented resting state networks were the dorsal attention, auditory, and motor networks (Fig. 3A). The top 10% nodes whose voxel-wise functional connectivity:behaviour maps were most similar to the PC1 map (see Fig. 2F for a distribution of loadings across different nodes) are shown in Fig. 3B. A similar analysis was conducted on the left hemisphere nodes. The first principal component (PC1) accounted for 43% of the variance, and the resting state networks and nodes most strongly associated with PC1 were again auditory, motor and dorsal attention networks (Fig. 3C and D).
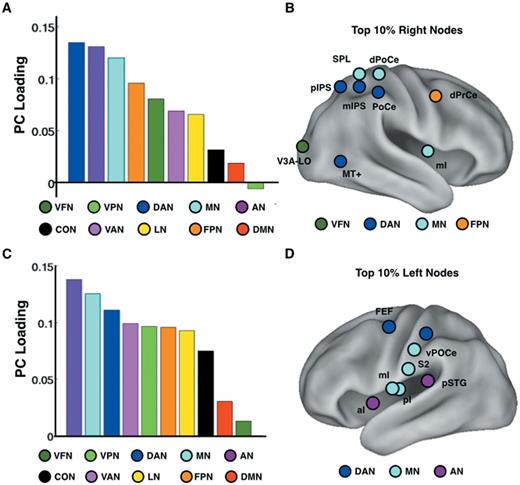
Spatial PCA of functional connectivity:VAD maps computed separately for nodes in each hemisphere. (A) Results from a PCA conducted on the functional connectivity:VAD maps for right hemisphere nodes. Each bar in the graph shows the loading of the first principal component (PC) on a particular resting state network. (B) The figure displays the 10% of right hemisphere nodes whose functional connectivity:VAD maps showed the highest loading with the first principal component. (C) Same as (A) but for left hemisphere nodes. (D) Same as (B) but for left hemisphere nodes. Networks: VFN = visual foveal representation; VPN = visual peripheral representation; DAN = dorsal attention; MN = motor; AN = auditory; VAN = ventral attention; CON = cingulo-opercular; LN = language; FPN = frontoparietal; DMN = default mode. FEF = frontal eye field; aI = anterior Insula; mI = middle Insula; pSTG = posterior superior temporal gyrus; vPoCe = ventral post-central gyrus; mIPS = middle intraparietal sulcus; SPL = superior parietal lobule; pIPS = posterior intraparietal sulcus; dPrCe = dorsal precentral gyrus; PoCe = post-central gyrus; MT+ = middle temporal area; V3A-LO = visual area 3A-lateral occipital complex.
Based on this analysis we found three topographically distinct, yet correlated, patterns of functional connectivity that were associated with spatial neglect.
Visual attention deficit and reduction of interhemispheric functional connectivity
Figure 4A shows the functional connectivity:behaviour map derived from the top 10% nodes in the right hemisphere displayed in Fig. 3B. One strong pattern is a negative correlation between the VAD score and the functional connectivity of top right hemisphere nodes with widespread regions in the left hemisphere (blue-cyan colours in Fig. 4A). The left hemisphere regions showing negative functional connectivity: VAD correlations were primarily located in the dorsal attention, motor, auditory, and fronto-parietal control networks as well as visual networks (foveal and peripheral). Therefore, higher VAD scores, i.e. greater neglect, were associated with lower interhemispheric functional connectivity in these networks. Two scatter plots (Fig. 4A) show the highly significant negative relationship between functional connectivity and VAD scores in MT+ (a node of the dorsal attention network associated with responses to coherent motion; Maunsell and Van Essen, 1983) and the post-central gyrus.
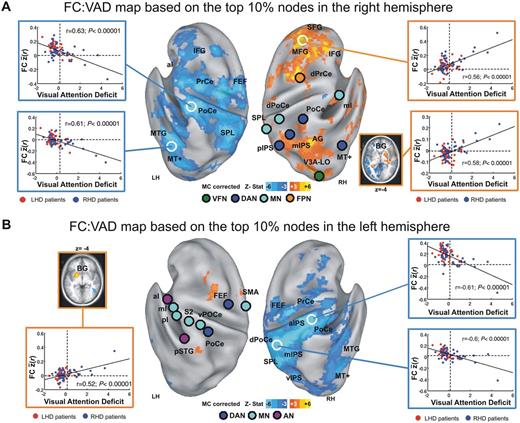
Behaviourally-relevant functional connectivity. Voxel-wise functional connectivity (FC):VAD maps based on the top 10% of nodes showing the highest loading with the first principal component from the PCA of functional connectivity:VAD maps. (A) Functional connectivity:VAD map derived from the top 10% right hemisphere nodes (n = 9) (illustrated in Fig. 3B). Nodes are displayed as circles whose colour indicates network identity, consistent with Fig. 2. Functional connectivity:VAD correlation maps are thresholded at P < 0.05 (multiple comparisons corrected, cluster size 17 voxels). Blue-cyan hues indicate negative functional connectivity:VAD correlation (low functional connectivity = high VAD); orange-yellow hues indicate positive functional connectivity:VAD correlation (high functional connectivity = high VAD). Inset scatter plots show the relation between VAD and mean functional connectivity between the nine nodes and the region demarcated by white circles. As in Fig. 1, vertical dashed lines indicate the boundary between patients with (N+) and without (N−) patients. Blue circles = RHD patients; red circles = LHD patients. Inset in lower right portion of A shows functional connectivity:VAD correlations for regions in right and left putamen (BG). Region labels correspond to Supplementary Table 1. (B) Functional connectivity:VAD map derived from the top 10% left hemisphere nodes (n = 9) (illustrated in Fig. 3D), conventions as in A. VFN = visual foveal network; DAN = dorsal attention network; MN = motor network; VAN = ventral attention network; FPN = fronto-parietal network; FEF = frontal eye field; SMA = supplemental motor area; aI = anterior insula; pI = posterior insula; mI = middle insula; pSTG = posterior superior temporal gyrus; vPoCe = ventral post-central gyrus; mIPS = middle intraparietal sulcus; SPL = superior parietal lobule; pIPS = posterior intraparietal sulcus; dPrCe = dorsal precentral gyrus; PoCe = post-central gyrus; MT+ = middle temporal area; V3A-LO = visual area 3A-lateral occipital complex.
A parallel analysis using the left hemisphere nodes yielded very similar findings. Again, widespread reductions of functional connectivity between nodes and contralateral regions in the auditory, motor, and dorsal and ventral attention networks were correlated with the severity of neglect (Fig. 4B blue-cyan colours and related scatter plots). Supplementary Fig. 4 shows that an interhemispheric loss of correlated activity can be obtained by seeding different networks, again indicating that behaviourally-relevant functional connectivity is not confined to a single network.
A between-group analysis confirmed that this dysfunctional pattern of connectivity is significantly stronger for stroke patients with neglect (N+). For instance, Supplementary Fig. 5 shows that patients with neglect, as compared to patients without neglect or healthy controls, exhibit statistically significant reduction in interhemispheric functional connectivity between homotopic nodes in the dorsal attention network (see Supplementary material for details). Interestingly, the dysfunction is not limited to homotopic connections, but spreads to other regions of the contralateral hemisphere (Supplementary Fig. 6 and Supplementary material for details).
These results, obtained both with right and left hemisphere seeds (Figs. 4A and B), indicate that reduced interhemispheric functional connectivity was associated with higher VAD scores, i.e. slower and less accurate detection of contralesional targets, a shift of visuomotor exploration (centre of cancellation scores) towards the ipsilesional field, and overall poor performance on the Posner task.
Visual attention deficit and reduced segregation between networks in the right hemisphere
The association of VAD with decreases in interhemispheric functional connectivity for both left and right hemisphere nodes is noteworthy in light of the strong association between persistent neglect and right hemisphere lesions. However, the functional connectivity:VAD map based on PC1 also included intrahemispheric changes in functional connectivity that were largely confined to the right hemisphere. Therefore, the intrahemipsheric and interhemispheric patterns were correlated but topographically distinct.
The functional connectivity:VAD map in Fig. 4A showed a positive correlation between VAD scores on the one hand and intrahemispheric functional connectivity between right hemisphere nodes and fronto-parietal (superior and middle frontal gyri) and default mode (inferior parietal lobule) networks on the other hand (right side of Fig. 4A, yellow-orange colours). The positive sign of the correlations means that high VAD scores i.e. severe neglect was associated with widespread increased intrahemispheric functional connectivity (see the scatter plots outlined in orange on the right side of Fig. 4A). We interpret this effect as a loss of segregation between two sets of networks, the dorsal attention, motor, and auditory networks on the one hand and the fronto-parietal and default mode networks on the other hand. These two sets of resting state networks normally are anti-correlated in functional connectivity data preprocessed with global signal regression (Yeo et al., 2011; Hacker et al., 2013). Notably, the intrahemispheric functional connectivity:VAD pattern was not observed for nodes in the left hemisphere (Fig. 4B, left).
Visual attention deficit and over-functional connectivity between attention/motor networks and basal ganglia
The functional connectivity:VAD map based on PC1 included a third pattern, namely a positive correlation between VAD scores and intrahemispheric functional connectivity between the top 10% nodes (Fig. 3B and D) and the basal ganglia. More severe neglect was associated with stronger functional connectivity between the basal ganglia and regions in the dorsal attention and sensory-motor networks. This effect was observed in both hemispheres (Fig. 4A and B). Therefore, the functional connectivity:VAD map based on PC1 included three topographically distinct but correlated patterns of behaviourally relevant functional connectivity.
Hemispheric asymmetry and behaviourally relevant functional connectivity
Spatial neglect is more severe after right hemisphere damage (Weintraub and Mesulam, 1987) and at the chronic stage the majority of patients who still have neglect have right hemisphere lesions (Stone et al., 1991; cf. Suchan et al., 2012). Our sample showed a similar right hemisphere bias in terms of severity. We next investigated whether RHD and LHD patients with and without neglect, showed different functional connectivity:VAD patterns. To obtain quantitative measures, we conducted an analysis in which we correlated the VAD scores with the functional connectivity of 169 nodes separately for RHD and LHD groups (both groups, n = 42).
Next, we conducted within each group a PCA on the 169 functional connectivity:VAD maps. The PCA in the RHD group revealed a first principal component accounting for 44% of the variance in the correlation between VAD and functional connectivity. In contrast, the PCA in the LHD patients yielded a first principal component accounting for only 13% of the functional connectivity:VAD variance (Fig. 5A).
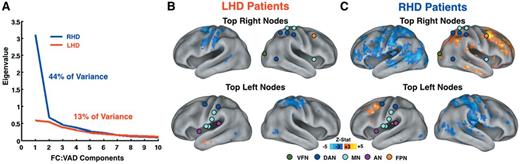
Behaviourally-relevant functional connectivity in right (RHD) and left (LHD) hemisphere damaged patients. (A) Scree plot derived from the spatial principal component analysis of 169 functional connectivity (FC):VAD correlational maps in right (RHD) and left (LHD) hemisphere damaged patients (n = 42 in both groups). Functional connectivity:VAD associations were considerably stronger in right as opposed to left hemisphere damaged patients Blue: RHD; Red: LHD. (B) Voxel-wise functional connectivity:VAD map from top 10% right nodes (n = 9) (top) and from top 10% left nodes (n = 9) (bottom) in the LHD group (n = 42). (C) Same map as in B generated in the RHD group (n = 42). The top 10% nodes were derived from the whole-sample analysis (Fig. 3B and D). (B and C) The nodes and colour scale as in Fig. 4. VFN = visual foveal network; DAN = dorsal attention network; MN = motor network; FPN = fronto-parietal network; AN = auditory network.
We then generated separately for RHD and LHD patients the functional connectivity:VAD map by seeding in the top right and left 10% nodes, derived from the whole-sample analysis (nodes displayed in Fig. 3B and D). Figure 5B and C indicate that the neglect-related changes in functional connectivity occurred predominantly in RHD patients.
Behaviourally-relevant functional connectivity in relation to structural damage
The neglect-related functional connectivity abnormalities described thus far occurred in regions that were structurally intact, as all damaged voxels were removed from the analysis. Still, it is possible that they reflect the effect of lesion volume or location indirectly, for instance through anatomical disconnection from the site of damage. These changes may also reflect adjustments to the pattern of coherence between regions within resting state network or between resting state networks. To address this question, we defined two groups of RHD patients, those with and without neglect that matched as closely as possible for lesion distribution. To match lesion topography, we optimized the spatial correlation of lesions across the two groups. For each RHD patient with neglect we calculated the spatial correlation of their lesion with the lesion of all patients in the RHD without neglect group. Applying a threshold spatial correlation of r = 0.3, we defined two groups (RHD with neglect n = 11; RHD without neglect n = 11) in which the lesion for a patient in one group had at least a spatial correlation of 0.3 with at least one patient from the other group. Figure 6A and B shows that the lesion distribution of the two groups (number of patients with lesion overlapping at each voxel) was reasonably well matched. The total lesion volume in the two groups did not differ significantly (RHD with neglect group = 171.5 mm3; RHD without neglect group = 102.6 mm3, t-test non-significant). Figure 6C shows the difference in lesion topography across RHD groups with and without neglect. Although lesion topography was well matched across groups in most of the damaged regions, some voxels in correspondence of the dorsal white matter (near/at superior longitudinal fasciculus), caudate, and thalamus, were more frequently damaged in the RHD with neglect group (3–4 patients of 11 in each group). We then determined whether neglect-related changes in functional connectivity were significantly stronger in the neglect group. To address this question, we contrasted the RHD with and without neglect groups, using the mean voxel-wise functional connectivity derived from the 12 right hemisphere nodes of the dorsal attention network. These nodes were used in place of the ‘top 10%’ to avoid bias attributable to selecting nodes directly associated with VAD. A voxel-wise t-test revealed that RHD patients with neglect showed reduced interhemispheric functional connectivity as compared to RHD patients without neglect (Fig. 6D). Furthermore, the RHD with neglect group showed increased intrahemispheric functional connectivity between right DAN nodes and right hemisphere regions belonging to the fronto-parietal, default mode, ventral attention and motor networks (Fig. 6D). This analysis indicates that for lesions that were relatively well-matched spatial neglect is associated with robust changes in functional connectivity at the cortical level.
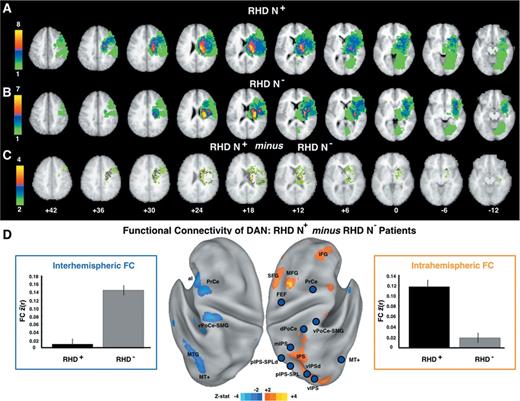
Functional connectivity in RHD patients with (N+) and without (N−) neglect and patients matched for lesion topography. (A) Lesion density in with neglect group (n = 11). (B) Lesion density in without neglect group (n = 11). (C) Difference in lesion density of the with neglect group minus the without neglect group. (D) With versus without neglect group contrast in functional connectivity (FC) averaged over 12 dorsal attention network (DAN) nodes in the right hemisphere. Surface maps show uncorrected Z-scores (|Z| > 2, P < 0.05). Blue-cyan (orange-yellow) hues indicate lower (higher) functional connectivity in the with neglect group. Left bar graph (outlined in blue) indicates the mean functional connectivity between 12 nodes in the right dorsal attention network (blue circles) and the cyan-blue voxels in the left hemisphere. Right bar graph (outlined in orange) indicates the mean functional connectivity between 12 nodes in the right dorsal attention network (blue circles) and the yellow-orange voxels in the right hemisphere. Region labels correspond to Supplementary Table 1. vIPSd = ventral intraparietal sulcus dorsal portion; MT+ = middle temporal area; MTG = middle temporal gyrus; pIPS-SPL = posterior Intraparietal Sulcus-Superior Parietal Lobule; pIPS-SPLd = posterior Intraparietal Sulcus-Superior Parietal Lobule dorsal portion; mIPS = middle intraparietal sulcus; dPoCe = dorsal post-central gyrus; vPoCe-SMG = ventral post-central gyrus-supramarginal gyrus; PrCe = precentral gyrus; FEF = frontal eye field; MFG = middle frontal gyrus; SFG = superior frontal gyrus; IFG = inferior frontal gyrus; aI = anterior insula.
Another critical question is whether neglect patients have more similar lesion topography or more similar patterns of functional connectivity dysfunction? In a second analysis, we focused on the RHD with neglect group (n = 14) and investigated whether patients with similar functional connectivity maps also showed similar lesion topography. For each pair of RHD patients with neglect, first we computed a covariance matrix based on the spatial similarity of their lesions. The lower half of the matrix displayed in Fig. 7A shows that many pairs of RHD patients with neglect did not show similar lesions (cool coloured cells), indicating that damage in different locations in the right hemisphere may induce neglect. The mean spatial correlation was 0.17 (SD = 0.16), and the range of spatial correlation was very wide with r-values ranging from 0 to 0.67. Then, for each pair of patients, we calculated the spatial correlation of their average voxel-wise functional connectivity maps (functional connectivity similarity) (Fig. 7A). The mean functional connectivity spatial correlation was 0.32 (SD = 0.09) and the range was narrower (0 < r < 0.5). Finally, we correlated, for each pair of RHD patients with neglect, the strength of functional connectivity similarity with the strength of the lesion similarity. Importantly, we did not find any correlation between the two measures (Fig. 7B) (r = 0.12; P = 0.24; n = 91), indicating that neglect patients showing similar functional connectivity maps did not exhibit more similar lesions.
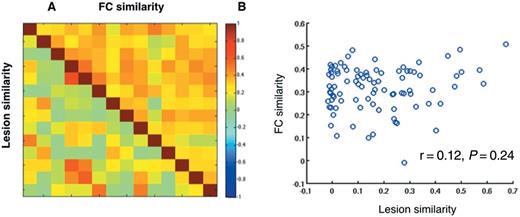
Behaviourally-relevant functional connectivity is not associated to lesion topography. (A) Lesion similarity and functional connectivity similarity. In the lower half of the matrix, each cell indicates the spatial correlation of the anatomical lesion between each pair of RHD N+ patients with neglect (N+) (n = 14). In the upper half of the matrix, each cell indicates the spatial correlation of the voxel-wise functional connectivity map derived from the right top 10% nodes between each pair of RHD patients with neglect (n = 14). (B) Functional connectivity similarity is not correlated with lesion similarity. The functional connectivity similarity between two patients is defined by the spatial correlation of the voxel-wise functional connectivity maps obtained for each patient by averaging the maps for the 10% of right hemisphere nodes. Each circle in the scatterplot indicates the functional connectivity and lesion similarity values for a pair of RHD patients with neglect (r = 0.12; P = 0.24; n = 91).
In a third analysis, we regressed out the contribution of lesion size from the correlation between VAD scores and voxel-wise functional connectivity from the top 10% right nodes. Supplementary Fig. 7 shows that voxel-wise functional connectivity:VAD maps that were computed without (Supplementary Fig. 7A) and with (Supplementary Fig. 7B) regressing out lesion size were similar, indicating that the extent of anatomical damage does not account for the functional connectivity:behaviour correlation. The same analysis conducted on the top 10% of left nodes yielded similar results, confirming that lesion size does not explain the functional connectivity:VAD correlations.
Discussion
We investigated the behavioural correlates of spontaneous brain activity in a large, heterogeneous sample of first-ever stroke patients. Specifically, we studied the correlation between changes of resting state functional connectivity and quantitative measures of spatial neglect. We first identified one measure of neglect, the VAD, including: (i) a visuospatial bias for attending to ipsilesional over contralesional visual targets; (ii) a non-spatial decrement in performance, across both visual fields and cueing conditions; and (iii) potentially, a motor bias manifesting in directional arm/hand responses (Mesulam, Behavioural Inattention Test) (Fig. 1). These performance measures were correlated across our large sample of stroke patients.
We then showed that VAD was associated with correlated patterns of abnormal functional connectivity to/from multiple dorsal regions of attention and sensory (auditory, visual)-motor resting state networks: (i) a decreased interhemispheric functional connectivity; (ii) a loss of intrahemispheric anti-correlation (shift towards positive correlation values) with default/fronto-parietal control networks in the right hemisphere; and (iii) a bilateral increased intrahemispheric functional connectivity with basal ganglia (Figs 3 and 4).
We also demonstrated that: (i) functional connectivity:VAD patterns were stronger in patients with right as compared to left hemisphere stroke (Fig. 5); (ii) in RHD patients with similar lesion topography, the occurrence of spatial neglect was associated with specific patterns of abnormal functional connectivity (Fig. 6); (iii) in RHD patients with neglect, lesion topography was less similar than, and not correlated with, functional connectivity abnormality topography (Fig. 7); and (iv) lesion volume did not account for abnormal functional connectivity patterns (Supplementary Fig. 7).
Figure 8 highlights the main finding that structural damage (subcortical, cortical) is distinct from widespread cortical functional connectivity changes that are strongly associated with neglect impairment.
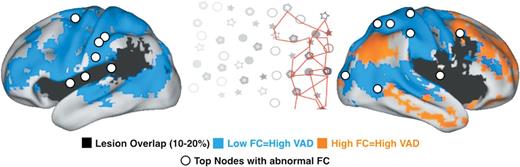
Behaviourally-relevant functional connectivity and lesion topography. The map displays a summary of main finding. White circles indicate the top 10% nodes of the left and right hemisphere showing behaviourally-relevant functional connectivity (FC). Blue and orange colours indicate voxels showing negative and positive functional connectivity:VAD correlations with the top nodes, respectively. Black colour indicates voxels damaged in the 10–20% of patients. The central inset illustrates rightward spatial biases in attention typical of neglect patients (from Corbetta and Shulman, 2011).
In the following discussion, we discuss the relevance of our findings to the pathogenesis of spatial neglect, and then consider potential mechanisms accounting for the relationship between changes in functional connectivity and attention deficits.
Pathophysiology and right hemisphere lateralization of spatial neglect
Correlated behavioural deficits
The behavioural results show that different deficits were correlated in our large sample of stroke patients. The co-occurrence and interaction of spatial (perceptual/motor) and vigilance/arousal factors is well documented, both in neglect (Robertson et al., 1997; Malhotra et al., 2009) and in healthy (Bellgrove et al., 2004; Manly et al., 2005) subjects, as are the benefits of treating vigilance/arousal (Robertson et al., 1995, 1998).
The correlation of neglect deficits is important in the context of a large literature that has emphasized behavioural dissociations between different types of neglect. While we do not deny these dissociations, our results strongly argue that several components of neglect are correlated in the majority of patients (Robertson et al., 1997; Husain and Rordern, 2003). This result is important for studies of recovery and for measuring the efficacy of intervention, as our data show that one robust factor captures significant fractions of inter-individual variability.
Correlated patterns of behaviourally-relevant functional connectivity
The measure of spatial neglect, VAD, was associated with three large-scale and topographically distinct but correlated patterns of altered functional connectivity. The correlation between these three functional connectivity:behaviour patterns mirrors the correlation between performance measures. Because of these correlations, it was not possible to uniquely associate each functional connectivity pattern with a different behavioural component captured by VAD measure. Acknowledging this limitation, we discuss below the behavioural deficits that plausibly are most associated with particular functional connectivity changes. Importantly, one of these functional connectivity effects is right lateralized in a manner consistent with the well-known right hemisphere dominance of attentional mechanisms in the intact brain.
Breakdown of interhemispheric functional connectivity and spatial bias
Figure 4 shows the decrease of interhemispheric functional connectivity across multiple attention and sensory-motor networks that correlate with VAD. What is noteworthy in this map is the extent of involved cortex. Cortical regions associated with VAD extend from dorsal occipital to temporal cortex, and anteriorly from posterior parietal to motor and premotor regions; this territory involves multiple resting-state networks (dorsal attention, motor, auditory, visual foveal and visual peripheral networks). Another noteworthy feature in our results is the observation that symmetrical disruption of interhemispheric functional connectivity, i.e. involving both hemispheres, is associated with contralesional spatial neglect.
In previous studies (He et al., 2007; Carter et al., 2010) we demonstrated that contralesional attention deficits are associated with decreased functional connectivity between homologous regions in the dorsal attention network. The current findings expand this observation to include also ventral attention, sensory (visual, auditory) and motor networks. Thus, VAD-associated functional connectivity changes are widespread and not confined to the dorsal attention network. This result is consistent with the notion that spatial neglect reflects not only sensory selection but also motor responses and working memory representations (DeRenzi, 1982; Mesulam, 1985). Concurrent dysfunction in both dorsal attention, ventral attention, and visual/auditory sensory regions is also consistent with documented functional interactions between these systems in the healthy brain during top-down control of attention (Corbetta and Shulman, 2002; Bressler et al., 2008; Capotosto et al., 2009), and documented abnormal sensory responses in the visual cortex of patients with neglect (Corbetta et al., 2005; Vuilleumier et al., 2008).
Widespread impairment of interhemispheric communication in neglect strongly supports a neural theory in which interhemispheric competition plays a key role in the control of spatial attention (Kinsbourne, 1977; Corbetta et al., 2005; Corbetta and Shulman, 2011). This theory proposes that unilateral lesions induce a functional imbalance between the undamaged and damaged hemispheres. Physiological studies suggest that accurate prediction of the locus of spatial attention requires computations (winner-take-all or differencing) that integrate salient information across different locations within neural maps that are topographically organized (Bisley and Goldberg, 2003; Sylvester et al., 2007). Callosal connections between homologous regions in dorsal parietal and frontal cortex (Sereno et al., 2001; Kastner et al., 2007) are a likely anatomical pathway mediating these interhemispheric interactions. Accordingly, disruption of callosal connections causes severe neglect (Bozzali et al., 2012), and acutely reduces interhemispheric functional connectivity (Johnston et al., 2008).
Right hemisphere loss of network segregation and non-spatial attention
It is well known that spatial neglect is more frequent and of greater severity following right as opposed to left hemisphere lesions. This asymmetry is thought to reflect the same neural mechanisms that underlie right hemisphere lateralization of attention mechanisms in the human brain. Here, we show that one of the functional connectivity patterns associated with neglect is a right hemisphere lateralized shift towards more positive values in normally negative intrahemispheric correlations between attention/sensory motor networks and default/fronto-parietal control networks (Fig. 4A). Another way to describe this abnormality is loss of normal segregation between dorsal attention/sensory-motor networks and default/fronto-parietal networks.
This pattern of functional connectivity change may relate to the general attention component of the VAD factor. The nodes contributing to this component were strongly right lateralized, which is consistent with the right lateralization of lesions leading to deficits of sustained attention/vigilance (Robertson et al., 1997; Husain and Rorden, 2003). Regions associated with this component include right prefrontal and inferior parietal cortex, which commonly are affected in patients with neglect or who have impaired sustained attention (Malhotra et al., 2009). Moreover, the topography of these functional connectivity patterns is similar to that of regions in the right hemisphere that respond to targets, irrespective of location (Shulman et al., 2010); that are modulated by vigilance/sustained attention paradigms (Sturm et al., 1999); and that are recruited during stimulus-driven shifts of attention (Corbetta and Shulman, 2002; Shulman et al., 2010). Finally, recent studies in healthy individuals show that good performance on perceptual, attention and language tasks is correlated with stronger negative correlations between perceptual/attention/motor regions and default/fronto-parietal networks (Kelly et al., 2008; Koyama et al., 2011; Baldassarre et al., 2012). Similarly, in our data, poor general performance was associated with loss of anti-correlation between visual/dorsal attention/motor and default/fronto-parietal networks.
The right hemisphere decrease in network segregation may reflect disrupted intra-cortical communication between ventral, fronto-parietal systems and dorsal, fronto-parietal attention/sensory-motor networks, and may be related to the behavioural interactions between vigilance/sustained attention and spatial attention noted above [see Corbetta and Shulman (2011) for a discussion of mechanisms). Accordingly, the right hemisphere decrease in network segregation co-occurs with the interhemispheric decrement in attention/sensory-motor systems (Fig. 4B).
Pathways mediating this communication probably include the superior longitudinal fasciculus II, which links anterior to posterior regions of the dorsal attention network, and superior longitudinal fasciculus III, which links ventral frontal to posterior parietal regions (Thiebaut de Schotten et al., 2011). Interestingly, although superior longitudinal fasciculus II is symmetrical in the two hemispheres, superior longitudinal fasciculus III is more robust in the right hemisphere (Thiebaut de Schotten et al., 2011).
Cortico-basal ganglia functional connectivity and motor neglect
The third pattern of functional connectivity change associated with VAD was increased correlations between cortex dorsal attention and sensory-motor networks and basal ganglia, particularly putamen. This finding was present bilaterally but involved different nodes in the two hemispheres (Fig. 4). We previously reported that lesions in the right putamen are associated with directional hypokinesia, a form of motor neglect characterized by a reduced ability to initiate motor responses towards stimuli in the contralesional part of the body and space (Sapir et al., 2007). The current basal ganglia component of functional connectivity:VAD associations is also consistent with the localization of motor neglect to anterior subcortical lesions (Mattingley et al., 1998). Finally, this component fits with several lines of evidence suggesting that decreased levels of dopamine in the nigrostriatal pathway may contribute to neglect (Carli et al., 1985; Fleet et al., 1987), especially motor neglect (Geminiani et al., 1998). Therefore, over-connectivity between attention and sensory-motor regions, especially in the left hemisphere after right hemisphere stroke, may contribute to motor bias in our patients.
Putative neuronal mechanisms linking functional connectivity abnormalities to behaviour
Our findings indicate that measures of functional connectivity at rest relate to behavioural deficits measured during task performance. Although speculative, this relationship suggests that resting state activity may affect the way in which networks operate during active behaviour. Thus, for instance, reduced interhemispheric correlations in the resting state in attention, sensory-motor networks may affect their recruitment during task performance. This is especially true in acute or subacute patients in whom functional reorganization is just beginning. How do changes in resting state functional connectivity influence task-evoked responses and behaviour?
We offer three potential mechanisms through which this relationship between resting and task-evoked activity may occur. One possibility is that synchronous spontaneous fluctuations may be important for the read-out of neural signals related to the locus of spatial attention. In dorsal attention regions involved in shifting or maintaining attention, the locus of attention in the left or right visual field is more accurately computed as the signal difference between attended versus unattended locations (or hemispheres) than by simple read-out of activity from only the attended location (or hemisphere) (Bisley and Goldberg, 2003; Sylvester et al., 2007; Ganguli et al., 2008; Smith and Kohn, 2008). This observation may be explained by the fact that trial-to-trial noise fluctuations between locations in a map or regions in different hemispheres are correlated during spatial attention tasks (Sylvester et al., 2007) or rest, and that a subtraction mechanism may improve signal coding under conditions in which the noise is correlated (Smith and Kohn, 2008). Hence, disruption of interhemispheric correlated noise would affect the precise computation of the locus of attention.
A second possibility is that disruption of low-frequency correlations as in spontaneous activity may disrupt synchronization of high frequency activity necessary for the accurate control of attention (Fries et al., 2001). This idea is based on the observation that correlated low-frequency neuronal activity can synchronize neural activity at higher frequencies during task performance (Lakatos et al., 2008).
A final possibility is that altered functional connectivity at rest can set up abnormal interactions that interfere with proper recruitment patterns during on-line behaviour. Recent studies have shown that tasks can induce specific patterns of resting state functional MRI correlation between cortical regions (Zanto et al., 2011). Accordingly, disruption of this linking function could lead to abnormal interactions during active behaviours.
Limitations
We show that resting state functional connectivity measured with functional MRI relates to behavioural deficits in spatial attention. However, the correlation between performance on tests of attention and resting state functional connectivity was quantitatively modest. Functional connectivity assessed with the top 10% nodes had a mean correlation with VAD of 0.63, which corresponds to about 0.39 of variance explained. Because VAD accounted for ∼34% of the behavioural variance, resting state functional connectivity explains about 13% of the total variance in performance across subjects.
This result may not be surprising given that functional MRI and behavioural testing were obtained in different sessions, and that task-driven activity may be more closely associated with behavioural performance. Whether this degree of prediction is enough for functional connectivity to become a biomarker of brain function in relation to outcome or recovery after focal brain injury (He et al., 2007; van Meer et al., 2012) is an empirical question worth pursuing, not just in neglect, but also in other behavioural deficits including aphasia, amnesia, visual loss, and paralysis (Wang et al., 2010; Grefkes and Fink, 2011).
Another important limitation is that other potentially important aspects of neglect such as object-related neglect, or body-related neglect were not measured in this study. That does not detract from the important take-home message that key components of the neglect syndrome are associated with impairments of functional connectivity across large parts of cortex that involve in a correlated manner multiple brain networks.
Funding
This work is supported by a grant of the National Institute of Mental Health: R01 HD061117-10.
Supplementary material
Supplementary material is available at Brain online.
Abbreviations
- L/RHD
left/right hemisphere damaged
- PCA
principal component analysis
- VAD
visual attention deficit

