


Abstract
Ataxia-telangiectasia is a recessive genetic disorder (ATM is the mutated gene) of childhood with severe motor impairments and whereas homozygotes manifest the disorder, heterozygotes are asymptomatic. Structural brain imaging and post-mortem studies in individuals with ataxia-telangiectasia have reported cerebellar atrophy; but abnormalities of motor control characteristic of extrapyramidal dysfunction suggest impairment of broader motor networks. Here, we investigated possible dysfunction in other brain areas in individuals with ataxia-telangiectasia and tested for brain changes in asymptomatic relatives to assess if heterozygocity affects brain function. We used positron emission tomography and 18F-fluorodeoxyglucose to measure brain glucose metabolism (quantified as µmol/100 g/min), which serves as a marker of brain function, in 10 adults with ataxia-telangiectasia, 19 non-affected adult relatives (12 siblings, seven parents) and 29 age-matched healthy controls. Statistical parametric mapping and region of interest analyses were used to compare individuals with ataxia-telangiectasia, asymptomatic relatives, and unrelated controls. We found that participants with ataxia-telangiectasia had lower metabolism in cerebellar hemispheres (14%, P < 0.001), anterior vermis (40%, P < 0.001) and fusiform gyrus (20%, P < 0.001) compared with controls or siblings, and lower metabolism in hippocampus (12%, P = 0.05) compared with controls, and showed significant intersubject variability (decreases in vermis ranged from 18% to 60%). Participants with ataxia-telangiectasia also had higher metabolism in globus pallidus (16%, P = 0.05), which correlated negatively with motor performance. Asymptomatic relatives had lower metabolism in anterior vermis (12%; P = 0.01) and hippocampus (19%; P = 0.002) than controls. Our results indicate that, in addition to the expected decrease in cerebellar metabolism, participants with ataxia-telangiectasia had widespread changes in metabolic rates including hyperactivity in globus pallidus indicative of basal ganglia involvement. Changes in basal ganglia metabolism offer potential insight into targeting strategies for therapeutic deep brain stimulation. Our finding of decreased metabolism in vermis and hippocampus of asymptomatic relatives suggests that heterozygocity influences the function of these brain regions.
Introduction
Ataxia-telangiectasia is a rare, recessive genetic disorder of childhood (1 out of 40 000/100 000 persons) (Swift et al., 1986). The responsible gene, ATM (ataxia telangiectasia mutated) is a constitutively expressed kinase activated by double-strand DNA breaks and other cellular stresses, and targets a wide range of cellular response pathways. Individuals with ataxia-telangiectasia have increased risk for cancer, impaired immune and other organ functions, ocular and cutaneous telangiectasias, but most prominently manifest a complex neurodegenerative syndrome with ataxia, choreoathetosis and oculomotor dysfunction (Sedgwick, 1991; Chun and Gatti, 2004; Hoche et al., 2012).
The clinical presentation of ataxia-telangiectasia is variable, which in milder cases is due to residual ataxia telangiectasia mutated kinase activity (Verhagen et al., 2009). Structural brain imaging and post-mortem studies demonstrate consistent atrophy and degeneration of cerebellar cortex, with loss of Purkinje and granule cells (reviewed in Verhagen et al., 2012b), though case reports and small case series point to a minority having supratentorial vascular and gliotic changes (Casaril et al., 1982; Opeskin et al., 1998; Habek et al., 2008; Lin et al., 2014). The quandary of apparent extrapyramidal dysfunction in the setting of consistent cerebellar-focused pathology remains unexplained. Except for single case reports (Sang et al., 2012), functional brain imaging studies that might provide insight into how cerebellar degeneration influences activity in projection regions and associated cerebellar networks have not been done.
Mutations in the ATM gene cause an autosomal recessive syndrome in homozygotes, but heterozygotes are asymptomatic (Li and Swift, 2000). The only health condition reported in those having a mutation in only one copy of ATM (heterozygotes) is a higher incidence of breast cancer (Thompson et al., 2005) and there is controversy regarding higher incidence of other cancers (stomach, bladder, pancreas, lung and ovaries) (NLM, 2014). Overall, there is increasing recognition that residual ATM kinase activity accounts for the differences in the severity of the neurological impairment in individuals with ataxia-telangiectasia (Verhagen et al., 2012a). However, no study has assessed whether a mutation in only one copy of ATM is associated with changes in brain function. This is of interest because in the brain, the ATM kinase is involved not only with DNA damage repair (Dar et al., 2006), but in neurons, where a substantial fraction of the ATM protein is cytoplasmic (rather than only nuclear), it is involved with vesicle trafficking (Li et al., 2009) thus implicating it in neuronal activity. Assessing whether there are changes in brain activity in asymptomatic relatives of individuals with ataxia-telangiectasia (heterozygous) would provide us with preliminary evidence that in the human brain the ataxia telangiectasia mutated-kinase might modulate neuronal activity
Here we use PET and 18F-fluorodeoxyglucose (18F-FDG) to measure regional brain glucose metabolism, which is a marker of brain function (Sokoloff et al., 1977) to assess brain function in individuals with ataxia-telangiectasia and in asymptomatic relatives. The clinical presentation of ataxia-telangiectasia in addition to cerebellar ataxia and oculomotor impairments includes extrapyramidal symptoms, which led us to hypothesize that participants with ataxia-telangiectasia would show not only changes in metabolism in cerebellum but also in subcortical brain regions. We also hypothesized that the asymptomatic relatives would have reduced metabolism in the cerebellar regions affected in participants with ataxia-telangiectasia albeit of a lesser magnitude.
Materials and methods
Subjects
Participants with ataxia-telangiectasia included 10 individuals (22.4 ± 4 years of age; four females, six males) who had been diagnosed by their physician and confirmed by an independent neurologist (T.O.C.) using previously described criteria (Crawford et al., 2000). Briefly, participants with ataxia-telangiectasia had to show ataxia or significant motor incoordination and elevated AFP (>2 normal) and have at least three of the following: (i) incoordination of head and eyes in lateral gaze deflection; (ii) ocular telangiectasia; (iii) gait ataxia associated with an inappropriately narrow-base; and (iv) immunoglobulin deficiencies. Ataxia-telangiectasia siblings (‘siblings’) included 12 healthy individuals (25 ± 6 years of age; four females, eight males) and ataxia-telangiectasia parents (‘parents’) included seven healthy individuals (37 ± 3 years of age; four females, three males) with a biological sibling or child with a confirmed diagnosis of ataxia-telangiectasia.
The controls were 29 healthy individuals from previous studies that measured baseline brain glucose metabolism and who were matched for age and gender with participants with ataxia-telangiectasia and the relatives (siblings and parents). Of these 29 individuals, a younger subgroup (n = 19) was used for the comparison with participants with ataxia-telangiectasia and are referred to as ‘younger controls’ (23.2 ± 3 years of age; eight females, 11 males); and an other subgroup of 10 older controls (35.6 ± 3 years of age; six females, four males) was used for comparison with the ataxia-telangiectasia parents and are referred to as ‘older controls’. Both the younger and older controls were included for the comparisons with the relatives (siblings and parents) and are referred to as ‘controls’.
Relatives of patients with ataxia-telangiectasia and controls were evaluated by a physician to ensure they were healthy and fulfilled study criteria. Exclusion criteria included history of neuropsychiatric disease, medical diseases (i.e. cardiovascular, endocrinological, oncological, autoimmune), current use of prescribed or over-the-counter medications, and/or head trauma with loss of consciousness >30 min.
Drug screens were done before scanning to exclude use of psychoactive drugs. Food and beverages were discontinued at least 4 h before the study. The research protocol was approved by the Committee on Research in Human Subjects at Stony Brook University and written informed consent was obtained from all participants.
Motor score
Motor behaviours were quantified by a neurologist (T.O.C.) using a neurological assessment battery (Crawford et al., 2000) that assessed: finger tapping, adventitious movements, a Fitz task of sequential button strikes ‘Tapbox’ and a quantitative assessment of finger-to-nose errors (total and on target). The scores were z-transformed and the average was used for the correlation analysis with the metabolic measures.
Scans
Scans were carried out on a high-resolution PET (Siemens/CTI ECAT-HR+) as previously described (Wang et al., 1993). Briefly, a 20-min emission scan was started 35 min after injection of 4–6 mCi of 18F-FDG. Subjects lay in the scanner in a quiet room during the 18F-FDG uptake period. Care was taken to ensure that the whole brain was included in the field of view and except for two participants with ataxia-telangiectasia (with very large heads in whom we missed most of the lower part of the cerebellum) the complete cerebellum was imaged. A nurse ensured their eyes were open, awake and comfortable. Arterialized blood sampling was used to quantify metabolic rates as described (Phelps et al., 1979). Briefly, for the purpose of venous blood arterialization, we inserted a catheter in the hand (retrograde direction) and placed the hand in a warming chamber set at 45–50°C.
For coregistration purposes we attempted to obtain MRI scans in participants with ataxia-telangiectasia but in those in whom we succeeded the image quality was inadequate for coregistration purposes.
Image and data analysis
The data were analysed using Statistical Parametric Mapping (SPM8) (Friston et al., 1995) both on the ‘absolute’ and the ‘normalized’ metabolic images (voxel/whole brain metabolism). Images were spatially normalized using the template provided in SPM and subsequently smoothed with an 8 mm isotropic Gaussian kernel. Unpaired Student t-tests were used to compare: (i) participants with ataxia-telangiectasia versus younger-controls; (ii) participants with ataxia-telangiectasia versus siblings; and (iii) relatives versus controls. Significance was PFWE < 0.05, corrected for multiple comparisons at the cluster level with a family-wise error (FWE corrected).
All findings were corroborated with an independent region of interest analysis that used an automated extraction method based on the Talairach atlas (Talairach and Tournoux, 1988), described previously (Volkow et al., 2005). The absolute metabolic measures from the region of interest analysis (quantified as µmol/100 g/min) were used to assess the correlations between the regions that differed in participants with ataxia-telangiectasia and their motor performance with significance set at P < 0.05. For exploratory analysis to identify other regions with significant correlations with motor performance, we set significance to P < 0.001 (Bonferroni corrected for 50 brain regions).
Results
Comparisons of participants with ataxia-telangiectasia with their siblings and with younger controls
Whole-brain metabolism did not differ between participants with ataxia-telangiectasia (39 ± 5 µmol/100 g/min), their siblings (40 ± 7 µmol/100 g/min, P = 0.58) and younger controls (42 ± 6 µmol/100 g/min, P = 0.11); but metabolism was consistently reduced in the cerebellum of participants with ataxia-telangiectasia (Fig. 1).
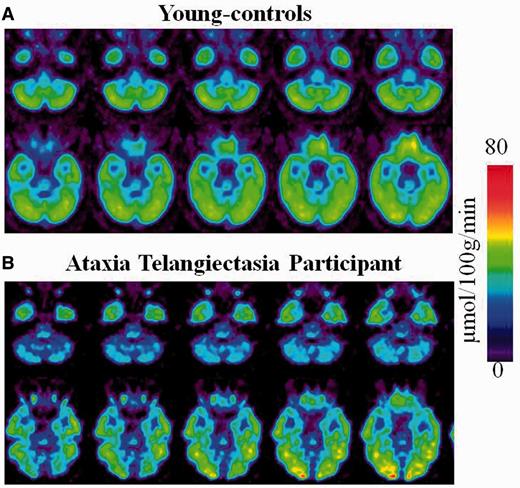
Regional brain metabolic images of healthy controls and of a participant with ataxia-telangiectasia. (A) Averaged brain images of younger-controls showing sequential axial planes at the levels where the cerebellum and the fusiform gyrus are located. (B) Brain images from a participant with ataxia-telangiectasia showing the same axial planes as for the averaged images of the younger-controls.
Statistical Parametric Mapping analysis on the absolute metabolic images showed overall similar results for the comparisons between participants with ataxia-telangiectasia and their siblings and the comparisons with the younger-controls. Specifically, participants with ataxia-telangiectasia had lower metabolism in the cerebellum and fusiform gyrus compared to their siblings or compared to the younger controls (Fig. 2 and Supplementary Table 1). Decreases in cerebellar metabolism were most prominent in anterior vermis (I-IV), vermis (IX) and Crus I and II of the cerebellar hemispheres (Fig. 3). Independent region of interest analysis corroborated these findings and also identified higher metabolism in globus pallidus in participants with ataxia-telangiectasia (Table 1). It also showed significant intersubject variability in the decrements in regional brain metabolism in participants with ataxia-telangiectasia. For example, in anterior vermis, which was the brain region that showed the largest decrements in participants with ataxia-telangiectasia (40% lower than controls and siblings) the values ranged between 18% and 60%. Additionally the region of interest analysis showed that the hippocampus had lower metabolism in participants with ataxia-telangiectasia than controls (27.6 ± 4 versus 31.0 ± 4; P = 0.05) but the comparison with their siblings was not significant.
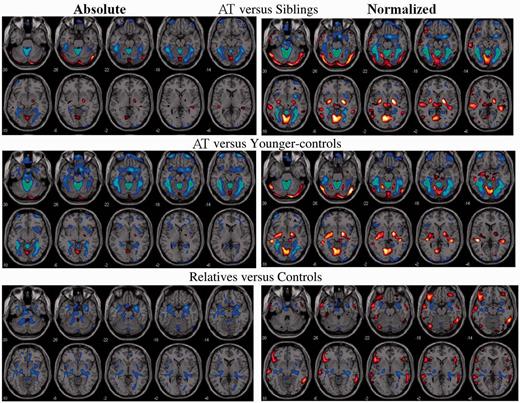
SPM results for the comparisons between (top) participants with ataxia-telangiectasia (AT) versus their siblings; (middle) ataxia-telangiectasia versus younger-controls; and (bottom) asymptomatic relatives versus controls, both for the absolute metabolic images and the normalized images (voxel/whole brain). Threshold was set at P < 0.005, minimum cluster size = 100 voxels. Blue–green reflect decreases and red–yellow increases in metabolism.
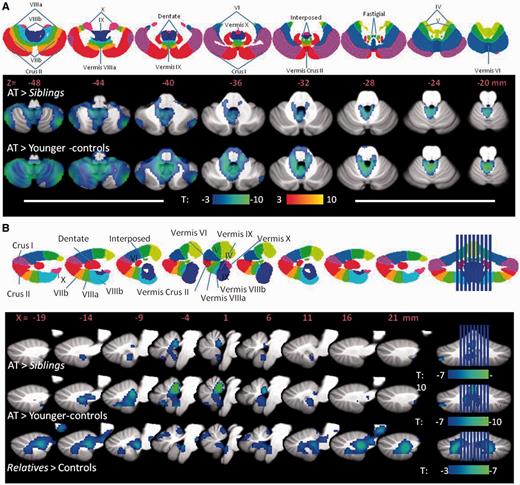
SPM results showing the regions within the cerebellum where brain glucose metabolism was decreased for the analysis done on the absolute brain glucose metabolic images. (A) Results for the comparisons between (i) participants with ataxia-telangiectasia (AT) versus their sibling; and (ii) ataxia-telangiectasia versus younger controls projected into axial planes of the cerebellum along with a diagram (top row) of the cerebellar lobes to help with their identification. (B) Results for the comparisons between (i) participants with ataxia-telangiectasia versus their siblings; (ii) ataxia-telangiectasia versus younger-controls; and (iii) asymptomatic relatives versus controls, projected into the sagittal planes of the vermis along with a diagram (top row) of the cerebellar vermis lobes. Threshold was set at P < 0.005, minimum cluster size = 100 voxels. Blue colours reflect decreases in metabolism.
Brain regions where the independent region of interest identified significant differences in absolute and normalized metabolism for the comparisons between participants with ataxia-telangiectasia (n = 10) versus their siblings (n = 12) and the younger-controls (n = 19) along with the corresponding P-values for these comparisons
| Brain region | AT | Siblings | P-value | Younger control | P-value |
|---|---|---|---|---|---|
| Absolute | |||||
| Fusiform | 29.2 ± 5 | 35.3 ± 6 | 0.02 | 36.5 ± 5 | 0.001 |
| Cerebellum | |||||
| Anterior vermis | 19.8 ± 4 | 31.4 ± 5 | 0.0001 | 33.6 ± 5 | 0.0001 |
| Inferior semilunar | 32.0 ± 9 | 39.2 ± 6 | 0.04 | 41.0 ± 5 | 0.002 |
| Hemisphere | 36.1 ± 6 | 38.3 ± 6 | NS | 42.1 ± 5 | 0.006 |
| Globus pallidus | |||||
| Lateral | 41.0 ± 8 | 34.7 ± 6 | 0.05 | 36.0 ± 6 | 0.05 |
| Medial | 30.9 ± 6 | 25.1 ± 6 | 0.04 | 26.6 ± 4 | 0.04 |
| Normalized | |||||
| Fusiform | 0.92 ± 0.06 | 1.09 ± 0.07 | 0.0001 | 1.06 ± 0.06 | 0.0001 |
| Cerebellum | |||||
| Anterior vermis | 0.62 ± 0.09 | 0.96 ± 0.1 | 0.0001 | 0.99 ± 0.09 | 0.0001 |
| Inferior semilunar | 0.99 ± 0.19 | 1.21 ± 0.1 | 0.0004 | 1.22 ± 0.08 | 0.0004 |
| Hemisphere | 1.13 ± 0.06 | 1.18 ± 0.07 | NS | 1.20 ± 0.07 | 0.007 |
| Central vermis | 1.27 ± 0.05 | 1.14 ± 0.09 | 0.0002 | 1.18 ± 0.11 | 0.02 |
| Globus pallidus | |||||
| Lateral | 1.28 ± 0.13 | 1.07 ± 0.09 | 0.0002 | 1.05 ± 0.09 | 0.0001 |
| Medial | 0.96 ± 0.12 | 0.77 ± 0.10 | 0.0005 | 0.80 ± 0.10 | 0.0002 |
AT = ataxia-telangiectasia; NS = not significant.
Units correspond to µmol/100 g/min. Comparisons correspond to unpaired t-test (two-tail).
Statistical Parametric Mapping analysis on the normalized metabolic images showed similar results as the absolute metabolic measures but additionally revealed higher metabolism in the globus pallidus and vermis (VI) for participants with ataxia-telangiectasia than their siblings or the younger-controls (Figs 2 and 3, and Supplementary Tables 1 and Supplementary Data). The independent region of interest analysis corroborated these findings (Table 1). The SPM analysis also identified higher normalized metabolism in superior temporal and calcarine cortices in participants with ataxia-telangiectasia compared to controls or siblings (Fig. 2 and Supplementary Tables 1 and Supplementary Data) but as these increases were not corroborated by the region of interest analysis we do not consider them as significant.
Correlations between regional metabolism and motor symptoms
The correlation analysis between the absolute metabolic measures in the regions that differed between groups and the motor score showed a negative correlation in vermis VI (r = 0.68, P = 0.03) and globus pallidus (r = 0.74, P = 0.02), such that the higher the metabolism the worse the performance. Exploratory analysis additionally showed significant negative correlations in thalamus (centre of coordinates: 0, −6, 12; r = 0.89, P = 0.0005) and precuneus (centre of coordinates: −6, −70, 58; r = 0.89, P = 0.0005).
Comparisons of asymptomatic relatives with controls
SPM analysis on the absolute metabolic images showed that asymptomatic relatives had significantly lower metabolism than controls in the anterior vermis, hippocampus and amygdala (Figs 2–4 and Supplementary Table 3). The region of interest analysis corroborated lower metabolism in relatives than controls in anterior vermis (30.3 ± 5 versus 34.6 ± 5, P = 0.01), amygdala (30.5 ± 5 versus 36.3 ± 5, P = 0.0003) and hippocampus (26.9 ± 4 versus 31.2 ± 4, P = 0.002). SPM analysis on the normalized measures additionally revealed that relatives had higher metabolism in the frontal, inferior temporal and posterior cingulate (Fig. 3 and Supplementary Table 3). The region of interest analysis on the normalized measures confirmed decreases in anterior vermis and hippocampus in relatives but those in the amygdala were not significant.
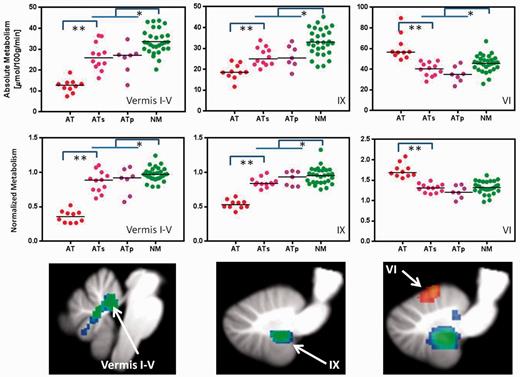
Individual values for glucose metabolism (absolute and normalized) in vermis I–IV, vermis IX and vermis VI in participants with ataxia-telangiectasia (AT), their siblings (ATs), the parents (ATp) and controls (NM). Comparisons correspond to Student t-test (two-tail) *P < 0.05 and **P < 0.001.
As genetic testing was unavailable for most siblings and by probability it is expected that 25% of siblings would be genetically normal, we performed a separate analysis to compare the parents of participants with ataxia-telangiectasia, who are obligate carriers of the ATM mutation, with age-matched controls (older controls). Figure 4 shows significant decreases in absolute and normalized metabolic measures in the parents compared to controls for the regions in the cerebellum where participants with ataxia-telangiectasia also showed decreased metabolism. The independent region of interest analysis revealed similar metabolic decreases as for the relatives (siblings and parents); including lower metabolism in the parents than in the older-controls in the anterior vermis (28.5 ± 5 versus 36.4 ± 6; P = 0.01), amygdala (28.7 ± 5 versus 36.1 ± 6; P = 0.02) and hippocampus (24.8 ± 3 versus 31.8 ± 5; P = 0.007).
Discussion
Participants with ataxia-telangiectasia had lower metabolism in the cerebellum (most prominent in anterior vermis) and fusiform gyrus and higher metabolism in globus pallidus and vermis VI, than both their siblings and the younger controls, and lower metabolism in the hippocampus than the younger-controls. We also showed that the asymptomatic relatives, when compared with control subjects, had lower metabolism in the vermis (I–IV, IX), which was a region with even lower metabolism in participants with ataxia-telangiectasia, and in hippocampus, which was a region that was lower in participants with ataxia-telangiectasia than in the younger-controls but that did not differ between participants with ataxia-telangiectasia and their siblings.
Lower metabolism in the anterior vermis (I–IV), nodular vermis (IX, X) (Schraa-Tam et al., 2012) and cerebellar hemispheres (Crus I and II) in participants with ataxia-telangiectasia is consistent with previous structural imaging studies documenting atrophy in the cerebellum including vermis (Wallis et al., 2007) and with a study that reported reduced cerebellar blood flow in two patients with ataxia-telangiectasia (Jiang et al., 2006).
In addition we also document decreased metabolism in ataxia-telangiectasia in fusiform gyrus (encompassing Brodmann area 36), which was an unexpected finding given the absence of reported clinical abnormalities in the functions served by visual cortical regions. Because of the functional connectivity between the vermis (I–IV, and IX) and the fusiform gyrus (Sang et al., 2012) the reduced metabolism in the fusiform gyrus might reflect a downstream effect from vermis dysfunction. As this was an unexpected finding we did not evaluate visual perception, which would have allowed us to assess if reduced activity in fusiform gyrus is associated with visual impairments.
Participants with ataxia-telangiectasia showed increased metabolism in the globus pallidus where the increases were negatively correlated with scales of motor performance, suggesting an important relationship of this abnormality to the extrapyramidal features of ataxia-telangiectasia. This finding parallels the features in patients with Parkinson’s disease, in whom increased metabolism in the globus pallidus is associated with impaired inhibition of the basal ganglia’s indirect pathway (modulated by dopamine D2 receptors) and with extrapyramidal signs (Eidelberg, 2009). Prior evidence of basal ganglia involvement in ataxia-telangiectasia is limited to a case report showing reduced dopamine D2 receptor binding in striatum (Koepp et al., 1994) and an MRI study reporting basal ganglia degeneration in 1 of 11 patients (Kieslich et al., 2010). In this respect the negative association between motor impairment in globus pallidus, as well as in thalamus, which we found as part of the exploratory analysis (see below), overlaps with the metabolic pattern reported in Parkinson’s disease characterized by hypermetabolism in the thalamus and globus pallidus (also pons) (Ma et al., 2007).
Vermis VI, which is functionally connected with the globus pallidus (Sang et al., 2012), also had increased metabolism in participants with ataxia-telangiectasia. Vermis VI is part of the oculomotor vermis (Kojima et al., 2010) and could contribute to the oculomotor abnormalities of ataxia-telangiectasia (Lewis et al., 1999; Marzban, 2011). In this respect it would have been desirable to have quantitative measures of oculomotor symptoms in participants with ataxia-telangiectasia to correlate with the regional brain metabolic abnormalities. Unfortunately clinical symptoms in ataxia-telangiectasia are complex and deficits are obscured by the broad nature of their motor problems. For example, nystagmus is very hard to measure in patients with ataxia-telangiectasia as they cannot hold their eyes still.
The exploratory analysis revealed a negative association between motor performance and metabolism in precuneus, which is a brain region implicated in first-person perspective, experience of agency and self-processing operations (Cavanna and Trimble, 2006), and in thalamus, which conveys cerebellar signals to motor cortex (Hyam et al., 2012) and is implicated in cognitive control of movement (Prevosto and Sommer, 2013). Therefore the negative correlation with motor symptoms could reflect the attempt of participants with ataxia-telangiectasia to inhibit unwanted movements during the scanning procedure. Indeed in patients with Alien hand syndrome, the precuneus was activated during unwanted movement and during voluntary movements that required extra effort and concentration, which was interpreted to reflect conflict of agency (Schaefer et al., 2010). Similarly the negative association between motor impairment and globus pallidus, where increased firing is associated with control of unwanted movements (Marsden and Obeso, 1994), could also reflect the extra effort required to inhibit movements in participants with ataxia-telangiectasia.
The asymptomatic relatives had lower metabolism in vermis than controls, which was a region affected in participants with ataxia-telangiectasia, albeit the decrements in the relatives were milder. This suggests that heterozygosity in the mutation of ATM might affect cerebellar function. The lack of symptoms in the relatives probably reflects the mild nature of the changes and compensation through other neuronal networks. Interestingly the relatives also showed lower metabolism in the hippocampus. Decreased metabolism in the hippocampus was also observed in the participants with ataxia-telangiectasia for the comparison with the younger controls but not when compared with their siblings. This suggests that the ataxia telangiectasia mutated-kinase might also play a functional role in the hippocampus. Indeed in hippocampal slices, ataxia telangiectasia mutated deficiency is associated with impairments in long-term potentiation and in spontaneous vesicle release (Li et al., 2009). However, the unexpectedness of the finding, along with the lack of clinical/functional correlates of the hippocampal finding, highlights the need for its replication. Similarly the increases in the normalized metabolic measures in frontal, inferior temporal and posterior cingulate observed in the asymptomatic relatives when compared with the control subjects merit further investigation to assess if they reflect compensation for changes in brain function due to heterozygosity.
The lack of structural brain images in the participants with ataxia-telangiectasia is a limitation of our study for it would have been desirable to correct for cerebellar atrophy (Tavani et al., 2003); thus we cannot distinguish between tissue loss and decreased neuronal activity. Also, although we have attempted to identify the cerebellar regions most affected in ataxia-telangiectasia, the relatively poor spatial resolution of the regional brain metabolic measures along with the cerebellar atrophy precludes us from identifying them with accuracy. Another limitation was the lack of genotypes for all siblings, some of whom may not have been carriers (25%). Despite this, we were able to show significant differences in asymptomatic relatives, which indicates that the effect of heterozygocity in cerebellar and hippocampal function is large enough to be detected even with the potential inclusion of non-carriers. Indeed, a separate analysis of the parents, who are obligate carriers of the mutation, also revealed decrements in vermis and hippocampus. Finally from this study it is not possible to determine if the increased pallidal metabolism in participants with ataxia-telangiectasia reflects a direct effect from mutation in the ataxia telangiectasia mutated-kinase or an indirect consequence from cerebellar disruption. Note that we required that findings be corroborated both by statistical parametric mapping and independent region of interest analysis and thus it is possible that we might have missed regional functional changes in ataxia-telangiectasia.
There are currently no treatments for ataxia-telangiectasia. The identification of regions that contribute to the impairments of ataxia-telangiectasia could provide potential targets for deep brain stimulation. In this respect increased activity in the globus pallidus, which has been targeted for deep brain stimulation (Vidailhet et al., 2009; Fasano et al., 2012), was associated with worse motor performance. If its contribution to specific motor impairments of ataxia-telangiectasia can be corroborated, then deep brain stimulation in the globus pallidus might present a therapeutic option worth investigating.
Acknowledgements
We thank Nathaniel Heintz, Joanna Fowler, David Alexoff, Jean Logan, Colleen Shea, Pauline Carter, Karen Apelskog, and Ruben Baler for their contributions.
Funding
Research supported by National Institutes of Health's (NIH) Intramural Research Program National Institute on Alcohol Abuse and Alcoholism (NIAAA) #Y1AA3009 and by the A-T Children’s Project and carried out at Brookhaven National Laboratory.
Supplementary material
Supplementary material is available at Brain online.

