


Abstract
Neuroprotective approaches for central nervous system regeneration have not been successful in clinical practice so far and compounds that enhance remyelination are still not available for patients with multiple sclerosis. The objective of this study was to determine potential regenerative effects of the substance cytidine-5′-diphospho (CDP)-choline in two different murine animal models of multiple sclerosis. The effects of exogenously applied CDP-choline were tested in murine myelin oligodendrocyte glycoprotein-induced experimental autoimmune encephalomyelitis. In addition, the cuprizone-induced mouse model of de- and remyelination was used to specifically test the hypothesis that CDP-choline directly increases remyelination. We found that CDP-choline ameliorated the disease course of experimental autoimmune encephalomyelitis and exerted beneficial effects on myelin, oligodendrocytes and axons. After cuprizone-induced demyelination, CDP-choline effectively enhanced myelin regeneration and reversed motor coordination deficits. The increased remyelination arose from an increase in the numbers of proliferating oligodendrocyte precursor cells and oligodendrocytes. Further in vitro studies suggest that this process is regulated by protein kinase C. We thus identified a new mechanism to enhance central nervous system remyelination via the choline pathway. Due to its regenerative action combined with an excellent safety profile, CDP-choline could become a promising substance for patients with multiple sclerosis as an add-on therapy.
Introduction
Multiple sclerosis is characterized by inflammation, demyelination, gliosis and axonal damage in the CNS (Compston and Coles, 2008). Remyelination is the natural repair mechanism of demyelination and can be a highly efficient process, but it may be incomplete or even fail in multiple sclerosis (Franklin and ffrench-Constant, 2008). Possible explanations for remyelination failure of demyelinated intact axons include defects in recruitment/proliferation of new oligodendrocyte precursor cells (OPCs) and/or differentiation into mature myelin producing oligodendrocytes (Kotter et al., 2011; Hagemeier et al., 2012; de Castro et al., 2013). Demyelinated axons are vulnerable to degeneration and it was proposed that remyelination protects against progressive axonal damage and thus long-term disability in patients with multiple sclerosis (Franklin and ffrench-Constant, 2008; Kotter et al., 2011). For this reason, therapeutic promotion of remyelination represents an attractive option for preventing axonal loss and disease progression. Although many factors involved in remyelination have been identified in animal models of multiple sclerosis, therapeutic approaches to increase the numbers of OPCs and oligodendrocytes to support myelin repair are still not available in the human scenario.
Recently, CDP-choline (citicoline, cytidine 5′-diphosphocholine) has been proposed to have neuroprotective and regenerative functions (Hurtado et al., 2011). CDP-choline, a naturally occurring endogenous nucleoside, is an intermediate compound in the major pathway for the biosynthesis of the cell membrane phospholipid phosphatidylcholine (lecithin) (Kent and Carman, 1999; Adibhatla et al., 2006). Endogenous formation of CDP-choline from choline is a limiting step in the synthesis of phosphatidylcholine (Weiss, 1995). In the CNS choline is preferentially used for the synthesis of acetylcholine, which may limit the amount of choline for phosphatidylcholine production (Conant and Schauss, 2004). Exogenous CDP-choline disperses in the organism mainly in the form of its degradation products cytidine and choline that readily cross the blood–brain barrier and enter the various biosynthetic pathways that use CDP-choline (Conant and Schauss, 2004). In various animal models of CNS injury and neurodegenerative CNS diseases, exogenously administered CDP-choline enhanced membrane repair and neuronal functions (Adibhatla and Hatcher, 2005). Yet, the potential beneficial effects of CDP-choline on de- and remyelination in animal models for multiple sclerosis were not evaluated to date.
Here we investigated the effects of exogenously applied CDP-choline in murine myelin oligodendrocyte glycoprotein (MOG)-induced experimental autoimmune encephalomyelitis (EAE) and in the cuprizone model of toxic induced dymyelination. The aim of our experiments was to use different animal models that each mimic some aspects of the complex mechanisms of multiple sclerosis. EAE is an animal model that resembles some immunopathological and neurobiological aspects of multiple sclerosis (Linker et al., 2002). Although EAE is an excellent model to study CNS inflammation and neurodegeneration, assessment of remyelination may be complicated in a setting with concommittant demyelination and remyelination. In this context, the findings in EAE should be confirmed and supplemented in another model of demyelination, preferentially in a toxic model of demyelination. Thus, we additionally employed the cuprizone-induced mouse model of de- and remyelination (Skripuletz et al., 2013) to specifically test the hypothesis that CDP-choline directly increases remyelination. The cuprizone model is widely accepted to study de- and remyelination processes in the CNS. In contrast to models of focal-induced demyelination in the cuprizone model no breakdown of the blood–brain barrier occurs, which allows us to analyse the pathomechanisms of remyelination bypassing possible interferences of peripheral immune cells (Gudi et al., 2014). Besides, we have used different treatment protocols in both models.
Materials and methods
EAE induction and CDP-choline treatment protocol
For induction of EAE, mice received subcutaneous injections at the tail base of 200 μg MOG35–55 in phosphate-buffered saline (PBS) emulsified in an equal volume of complete Freund’s adjuvant containing Mycobacterium tuberculosis H37RA (Difco) at a final concentration of 1 mg/ml. Intraperitoneal injections of 200 ng pertussis toxin (List Biochemicals) were given at the time of immunization and 48 h later.
Mice either received CDP-choline (500 mg/kg) or saline (control group) by daily oral gavage beginning on the day of immunization until termination of the experiment. In additional experiments, CDP-choline (500 mg/kg) or saline in control mice was given in therapeutic regimens with treatment starting at the onset of disease, corresponding to Day 7 after MOG-immunization and after the first week of disease, corresponding to Day 15 after immunization.
Mice were weighed and scored for signs of disease on a daily basis. Disease severity was assessed using a scale ranging from 0 to 5 (Kleinewietfeld et al., 2013): 0, normal; 1, limp tail; 2, gait ataxia; 3, paraparesis; 4, tetraparesis; 5, death.
Cuprizone-induced demyelination and CDP-choline treatments
Experimental toxic demyelination was induced by feeding mice a diet containing 0.2% cuprizone (bis-cyclohexanone oxaldihydrazone, Sigma-Aldrich Inc) mixed into a ground standard rodent chow (Skripuletz et al., 2011). The cuprizone diet was maintained for 5 weeks. Animals were treated with CDP-choline (500 mg/kg) or sham every day beginning on the day of cuprizone feeding until termination of the experiment. Additional control animals were fed with normal chow and received CDP-choline or sham as described above.
To analyse the effects of short CDP-choline treatments on remyelination additional five treatment protocols were applied. Mice were treated with CDP-choline (500 mg/kg) or sham every day between Weeks 3–4, Weeks 3–5.5, Weeks 4–5, Weeks 4–5.5 and Weeks 5–5.5.
Motor coordination was assessed by the beam walking test (Skripuletz et al., 2010). Mice were measured for the ability to traverse a narrow beam to reach an enclosed safety box. Mice received two consecutive trials and the latency to traverse the beam was recorded for each trial (cut-off time 60 s). In the results the mean score of the two trials is given.
Histology, immunohistochemistry and electron microscopy
Histology, immunohistochemistry and electron microscopy were performed as previously described (Skripuletz et al., 2013). Mice were perfused with 4% paraformaldehyde (PFA) and spinal cord and spleen (in EAE experiments) or brains (in cuprizone experiments) were removed, postfixed in 4% PFA and paraffin embedded. Spinal cord sections were subjected to haematoxylin and eosin stain, Bielschowsky’s silver impregnation and immunohistochemical stainings. Brain sections underwent Luxol Fast blue stain and immunohistochemical stainings. For immunohistochemistry the following primary antibodies were used: for myelin proteins proteolipid protein (PLP) (mouse IgG, 1:500, Serotec), myelin basic protein (MBP) (mouse IgG, 1:500, Covance), cyclic nucleotide 3′ phosphodiesterase (CNPase) (mouse IgG, 1:200, Millipore), and myelin oligodendrocyte glycoprotein (MOG) (1:2 hybridoma supernatant, generous gift from C. Linington), for activated microglia Mac-3 (rat IgG, 1:500, BD Pharmingen) and the lectin ricinus communis agglutinin 1 (RCA-1) (1:1000, biotinylated, Vector Laboratories), for astrocytes glial fibrillary acidic protein (GFAP) (mouse IgG, 1:200, Millipore), for oligodendrocytes Nogo-A (rabbit IgG, 1:750, Millipore) and anti-adenomatus polyposis coli (APC; mouse IgG; 1:200, Calbiochem), for OPC Olig-2 (rabbit IgG, 1:500, Millipore), NG2 (1:200, rabbit IgG, Millipore), and PDGFRα (goat IgG, 1:500, R&D Systems), for T cells CD3 (rat IgG1, 1:200, Serotec), for neurites the neurofilament antibodies SMI31 and SMI32 (mouse IgG, 1:1000, Covance), and for proliferation Ki-67 (mouse IgG, 1:50, BD Pharmingen).
Quantification of glial reactions and determination of de- and remyelination
In EAE spinal cord cross-sections (cervical, thoracic and lumbar) were analysed using a light microscope (Olympus BX51) by a blinded observer as described previously (Herrero-Herranz et al., 2008). For each staining, four lesions in two sections within each spinal cord segment were analysed. Silver impregnated sections were analysed at ×630 magnification using a 25-point eyepiece. Axonal densities were counted within lesions and were given as number of grid points crossing axons as described previously (Linker et al., 2011). T cells and macrophages/microglia were counted at ×400 magnification within the margins of a 1/16 mm2 grid in individual lesions and counts were normalized to cells/mm2. For further quantification of inflammation and demyelination, digital frames were acquired. Affected areas within a section and total area of that section were determined using ImageJ (NIH). After Mac-3 or haematoxylin and eosin staining, infiltration was additionally assessed as infiltrated area in mm2 per mouse and numbers of Mac-3 positive infiltrates per section are given as inflammatory index (Eugster et al., 1999). Demyelination is given as per cent affected area per total area.
In cuprizone-treated animals, brain sections between bregma −0.82 mm and bregma −1.82 mm [according to the mouse atlas by Paxinos and Franklin (2001)] were analysed. Quantification of glial cells was performed for mature oligodendrocytes (Nogo-A, APC), proliferating OPC (double staining with Olig-2/Ki-67, NG2/Ki-67), activated microglia (RCA-1, Mac-3), proliferating microglia (double staining with RCA-1/Ki-67), and astrocytes (GFAP). Immunopositive cells with identified nucleus (counterstaining with Mayer’s hemalum solution for immunohistochemistry and DAPI for immunofluorescence) were counted in the central part of the corpus callosum in an area of at least 0.185 mm2 using a magnification of ×400 (Olympus BX61) as previously described (Skripuletz et al., 2013). In results counted cells are expressed as number of cells per mm2.
The extent of demyelination in the corpus callosum was analysed by light microscopy (Olympus BX61) as described previously (Skripuletz et al., 2008). For determination of demyelination in the corpus callosum myelin proteolipid protein, MBP, MOG, CNPase, and Luxol Fast blue stained brain sections were scored in a blinded manner by three observers and graded on a scale from 0 (complete demyelination) to 3 (normal myelin).
RNA isolation and real-time quantitative reverse transcriptase PCR
For PCR analysis corpus callosum was dissected from whole brains under a light microscope. Total RNA was then extracted from the tissue using the RNeasy®Mini Kit (Qiagen) as previously described (Gudi et al., 2011). Gene expressions of insulin-like growth factor 1 (Igf1), hepatocyte growth factor (Hgf), fibroblast growth factor (Fgf2), leukaemia inhibitory factor (Lif), ciliary neurotrophic factor (Cntf), brain-derived neurotrophic factor (Bdnf) and platelet-derived growth factor alpha (Pdgfα) were analysed in the corpus callosum after 4.5, 5 and 5.5 weeks of cuprizone fed mice treated with CDP-choline or sham and in age-matched normal fed control mice. The ΔΔCt method was used to determine differences in the expression between cuprizone fed mice and age-matched control mice. Changes in mRNA expression levels were calculated after normalization to hypoxanthin phosphoribosyltransferase (Hprt1) and glyceraldehyde 3-phosphate dehydrogenase (Gapdh).
Flow cytometry and ELISA
Spleens and CNS (brain/spinal cord) of CDP-choline treated and control mice were removed on Day 9–10 post-EAE induction and mechanically dissociated into single cell suspensions. CNS mononuclear cells were isolated by percoll gradient centrifugation as described (Linker et al., 2010). Splenocytes and CNS mononuclear cells were analysed by multicolour flow cytometry using fluorochrome conjugated surface marker antibodies. Anti-CD3 (clone 17A2), anti-CD4 (clone RM4-5), anti-CD8a (clone 53-6.7), anti-CD11b (clone M1/70), anti-CD19 (clone 1D3), anti-CD16/32 (Fc-block, clone 2.4G2) anti-CD80 (16-10A1), anti-MHCII (clone AF6-120.1), anti-Ly6c (clone AL-21), and anti-NK1.1 (clone PK 136) were all purchased from BD. Anti-CD62L (clone MEL-14), anti-CD44 (clone IM7), anti-CD45 (clone 30-F11), anti-PDCA-1 (clone 129C1), anti-B220 (clone RA3-6B2), and anti-F4/80 (clone BM8) were purchased from Biolegend. Flow cytometry was performed on a FACS Canto II (BD) and results were analysed using FACSDiva software (BD).
For the measurement of cytokines in mouse spleen cell primary cultures, splenocytes were prepared and cultured as above with media alone or in the presence of 20 µg/ml of MOG35–55 peptide or 1.25 µg/ml ConA. Supernatants were harvested after 48 h. IFNG, IL17, or IL10 concentrations were determined by ELISA, as described (Crowther, 1995).
For the measurement of corticosterone, serum was collected on Day 10 post-EAE induction. Concentrations were determined by ELISA, as described by the manufacturer (Abnova).
T cell proliferation assay
Single cell suspensions from spleens of CDP-choline treated and control mice were prepared on Day 9 after EAE induction (Linker et al., 2002). Cells (2 × 10⁵) were seeded in 96-well microtitre plates (Nunc) in 100 µl medium with addition of antigen or mitogen. Concentrations were 20 µg/ml for MOG, and 1.25 µg/ml for Concanavalin A (ConA; Sigma-Aldrich). Triplicate cultures were maintained at 37°C in a humidified atmosphere with 5% CO2 for 56 h and harvested following a 16 h pulse with 0.2 µCi/ well 3H-dT (tritiated thymidine, Amersham-Buchler). Cells were collected on fibreglass filter paper with a 96-well harvester (Pharmacia), and radioactivity was measured with a 96-well Betaplate liquid scintillation counter (Pharmacia).
Oligodendrocyte precursor cell culture
Primary cultures of OPC were prepared from neonatal Sprague-Dawley rat brains as previously described (Kotsiari et al., 2010). OPC culture purity was analysed by staining with A2B5, a marker for OPC and was between 75–85% as quantified by fluorescence microscopy. For western blotting experiments A2B5 positive OPC were purified by anti-A2B5 microbeads as described by the manufacturer (Miltenyi biotech).
Oligodendrocyte precursor cell proliferation assays
OPC proliferation was measured by the detection of 5-bromo-2′-deoxyuridine (BrdU) (Roche diagnostics GmbH) incorporation into the DNA. OPCs were treated with different concentrations of CDP-choline (0.01–1 mM) together with 10 µM of BrdU for 24 h, with BrdU being present for the last 3 h. Cells were then washed in PBS and stainining for A2B5 and BrdU was performed as described previously (Kotsiari et al., 2010). The labelled cells were analysed using a fluorescent microscope and the proliferation index was calculated by dividing number of BrdU-positive cells with total number of A2B5 positive cells. A minimum of 300 cells was counted in six to eight fields. In addition, OPC proliferation was analysed after staining with the proliferation marker Ki-67. After isolation, OPCs were plated at 8 × 10⁴ cells per 12 mm coverslip and maintained at 37°C, 5% CO2 for 4 days. Every second day fresh medium was added to the cells. Further cells were treated with CDP-choline for 24 h and were stained for the cell proliferation marker Ki-67. Briefly, after incubation cells were washed in PBS and were incubated with A2B5 antibody solution for 1 h. After washing twice in PBS cells were fixed with 4% PFA. Permeabilization of cells was achieved by adding ice-cold methanol for 20 min at 4°C. Cells were incubated with Ki-67 antibody (BD biosciences) for 90 min followed by washing in PBS. Further, cells were incubated with fluorescent labelled goat anti-mouse IgM 555 and goat anti-mouse IgG1 488 antibody (1:500, Invitrogen) for 90 min. Thereafter, cells were washed three times in PBS and deionized water and mounted with Mowiol® (Calbiochem) solution containing nuclear stain 4′,6-diamidino-2-phenylindole (DAPI, Invitrogen). Cells were examined under fluorescent microscope and a minimum 300 cells was counted in six visual fields of coverslip. Proliferation index was calculated by dividing number of A2B5 and Ki-67 double positive cells with total of A2B5 positive cells.
Oligodendrocyte precursor cell differentiation and migration assays
Differentiation of OPCs was determined by double staining for the OPC marker A2B5 and the oligodendrocyte marker GalC as described previously (Kotsiari et al., 2010). OPCs were plated at a density of 7 × 10⁴ cells per poly-L-lysine coated glass coverslip for 1 h. Non-adherent cells were removed and cells were left overnight. To allow differentiation, cells were cultured in N2B3 medium, N2B3 medium with 0.1 mM CDP-choline or N2B3 medium with 1 mM CDP-choline. After 48 h, cells were double-stained for A2B5 (1:2) and GalC (Galactocerebroside, 1:2, hybridoma supernatant, clone IC-07, European collection of cell cultures). Both antibodies were applied together on living cells for 40 min at 37°C. Cells were fixed with 4% PFA and incubated with secondary antibodies Alexa Fluor® 555 goat anti-mouse IgM (1:500) for A2B5 and Alexa Fluor® 488 goat anti-mouse IgG3 (1:500) for GalC. Positive cells were counted in 10 random visual fields per coverslip using a magnification of ×200. The differentiation index represents the ratio of mature oligodendrocytes (GalC positive) to OPC (A2B5 positive). Results were normalized to the control condition.
Migration of OPCs was performed through a poly-L-lysine coated membrane with the use of a Boyden chamber. Three different conditions were studied: B104 medium, B104 medium with 0.1 mM CDP-choline and B104 medium with 1 mM CDP-choline. On the lower wells 28 µl of each condition was added and at least three replicates per condition were performed. A total amount of 8 × 10⁴ cells resuspended in 50 µl of one of the three conditions was applied to the corresponding upper wells. Afterwards, the cells were incubated for 16 h at 37°C. After the migration time, the cells were fixed and stained with the Diff-Quik Staining Kit (dade Behring) and migrating cells were counted at a magnification of ×200. The migration index represents the ratio of migrating OPCs in each condition to migrating OPC in B104 medium. Results were normalized to the control condition.
Western blotting
Western blotting was carried out as described previously (de Oliveira et al., 2008). Briefly, cells were washed with cold PBS and lysed in lysis buffer (42 mM Tris-HCl, 1.3% SDS, 6.5% glycerin and 100 µM sodium orthovanadate, protease and phosphatase inhibitors). Before electrophoresis, Laemmli buffer (5% mercaptoethanol, 10% glycerol, 2% SDS, 65 mM Tris HCl and bromophenol blue) was added to the samples. Samples were separated by SDS-PAGE and transferred onto a polyvinylidene fluoride (PVDF) membrane (Millipore). The membrane was incubated with rabbit anti-phospho-PKC (pan) (1 μg/ml; Cell Signaling) and mouse anti-β-actin (1:3000; Santa Cruz biotechnology) antibodies. For detection horseradish peroxidase (HRP)-conjugated secondary antibodies goat anti-rabbit IgG (1:3000; R&D systems) or goat anti-mouse IgG (1:5000; R&D Systems) were used followed by chemiluminescence (ECL) reagents (GE Healthcare).
Microglia cell culture and functional assays
Microglia were prepared from neonatal Sprague-Dawley rat brains as previously described (Kotsiari et al., 2010). The effect of CDP-choline on the release of nitrite, TNFα and IL10 in lipopolysaccharide (Escherichia coli; Sigma Aldrich) activated microglia was determined. The amount of nitrite was measured with Griess reagent as described (Singh et al., 2012). TNFA and IL10 were measured in cell culture supernatants with enzyme immunoassay kits as described by the manufacturer (BD biosciences).
For generation of CDP-choline treated microglia supernatants, microglia were treated with different concentrations of CDP-choline (0.01–0.1 mM) in serum free Dulbecco’s modified Eagle’s medium (4.5 mg/ml glucose, Gibco) containing 1% ITS supplement (BD biosciences) for 12 h. Further, cells were washed and incubated with fresh medium for 12 h. Cell supernatants were collected, centrifuged and stored at −80°C until used. The effect of microglia supernatants on OPC proliferation was examined by Ki-67 staining.
Macrophage cell culture and functional assays
Primary macrophages were obtained from 10–20 week old C57BL/6 mice by peritoneal lavage and maintained at densities of 5 × 10⁵ to 2 × 10⁶ cells/cm2 (depending on assay) in complete RPMI-1640 containing 10% heat inactivated foetal calf serum (FCS) at 37°C under 5% CO2 atmosphere and 100% relative humidity. For cytokine and reactive oxygen species measurements, cells were stimulated with 100 ng/ml lipopolysaccharide (LPS; Sigma-Aldrich) for 6–48 h with or without the presence of CDP-choline (0.01–1 mM) and culture supernatants harvested and stored at −80°C for cytokine ELISA. Supernatants were processed immediately for nitric oxide measurements (Griess reagent kit; Promega). Phagocytosis was measured by stimulating macrophages with 100 ng/ml lipopolysaccharide in the presence or absence of CDP-choline (0.01–1 mM) for 18 h before addition of a 50-fold excess of opsonized Fluoresbrite® carboxylate YG 0.75 Micron Microspheres (Polysciences, Inc.). After 1 h, 3 h and 24 h of incubation with fluorescent beads, cells were subjected to flow cytometry and phagocytic macrophages were detected in the FITC channel. As a negative control, cells were analysed immediately after addition of beads. Migration of macrophages was measured in a modified Boyden chamber assay using Transwell inserts with a 5 µm porous bottom (Corning). Macrophages were loaded onto the migration chamber in RPMI containing 0.5% FCS. The lower chamber was loaded with RPMI containing 10% FCS. In the test condition, both compartments contained 1 mM CDP-choline. In the negative control condition, both compartments contained RPMI-1640 supplemented with 0.5% FCS. After 14 h of migration, cells remaining in the upper compartment were removed with a cotton swab and cells adhering to the trans-surface were removed by accutase treatment (adhering fraction). Adhering fraction and cells contained in the lower chamber (transmigrating fraction) were stained for macrophage markers F4/80 and CD11b and quantified by flow cytometry.
Macrophage polarization
Bone marrow cells were obtained from tibias and femurs of 10–20 week old C57BL/6 mice as described previously (Muccioli et al., 2011) and maintained at a density of 2 × 10⁶ cells/cm2 in RPMI-1640 supplemented with 50 µM ß-mercaptoethanol and 5% Panexin BMM (PanBiotech) and 10 ng/ml recombinant mouse M-CSF. After 10 days, bone marrow-derived macrophages were further cultured in the presence or absence of 1 mM CDP-choline under polarizing conditions as follows; M0, no cytokines; M1, 10 ng/ml LPS/ 10 ng/ml IFN-G; M2, IL4/IL13 20 ng/ml (recombinant cytokines were from R&D systems). After 24 h of polarization, expression of the M1 marker genes Nos2/iNos and Tnfa as well as M2 marker genes Arg1/Arginase1 and Chi3l3/YM-1 was analysed by real-time PCR using pre-developed TaqMan® primer/probe assays (Life technologies). Expression of Actb served as internal control.
Statistical analysis
Statistical analysis was performed using ANOVA followed by the Fisher-protected least-significant difference test for post hoc comparison if appropriate. EAE experiments were analysed using the non-parametric Mann-Whitney test. All data are given as arithmetic means ± standard error of the mean (SEM). EAE data are additionally presented as median ± interquartile ranges. For EAE data, a power calculation was performed (G*Power Freeware, Version 3.1.5). To detect a one point difference on a 1–5 point scale with an alpha error probability of <0.05 and a beta of >0.95 and standard deviations representing up to 33% of the mean, the minimal number needed to analyse is n = 8 per group resulting in an actual power of 0.951. P-values are given in the results while group comparisons derived from post hoc analysis are provided in the figures (*P < 0.05; **P < 0.01; ***P < 0.001).
Results
Beneficial effects of CDP-choline in EAE
We investigated the therapeutic potential of CDP-choline in MOG-induced EAE in C57BL/6 mice. First, CDP-choline was preventively applied and mice either received CDP-choline (treated group) or saline (EAE-control group) every day beginning on the day of immunization until the end of the observation period. CDP-choline was highly potent to ameliorate MOG-EAE (Fig. 1A and Supplementary Fig. 1A). Over the course of the disease mice in the EAE-control group suffered from mild paraparesis, while treated animals only displayed a limp tail (P < 0.01, on Day 27 post-immunization). The large difference between groups in disease severity persisted until the end of the observation period. Next, we tested CDP-choline in therapeutic regimens in vivo, with treatment starting at the onset of disease, corresponding to Day 7 after MOG-immunization (Fig. 1B and Supplementary Fig. 1B) and after the first week of disease corresponding to Day 15 after immunization. Treatment from the onset of disease was still effective, but had a smaller potency (Fig 1B, P < 0.05 on Day 23 post-immunization). Untreated mice displayed moderate paraparesis whereas CDP-choline treated mice only showed mild gait ataxia. In contrast, treatment after Day 15 post-immunization was ineffective in ameliorating clinical symptoms of EAE.
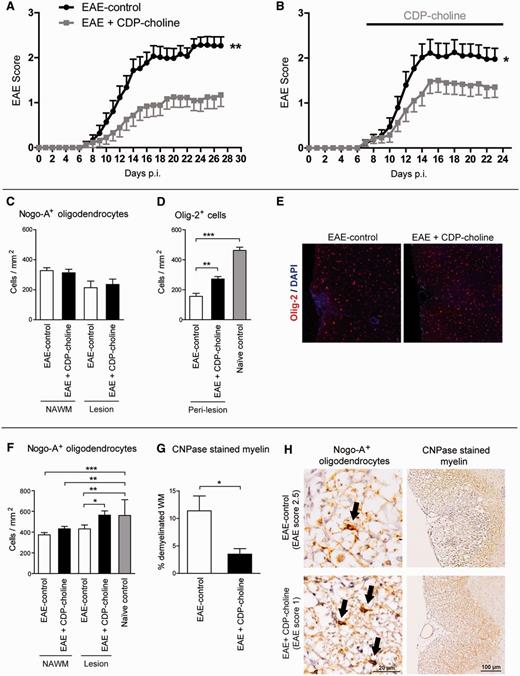
Beneficial effects of CDP-choline on MOG-EAE. CDP-choline ameliorated clinical symptoms and histopathology of MOG-EAE. Preventive (A, n = 22 per group) and therapeutic (B, n = 20 control, n = 24 CDP-choline) regimens of CDP-choline treatment were able to exert beneficial effects on the disease course. To dissect mechanisms of CDP-choline action in EAE, preventively treated and control mice were subjected to histopathological analyses. Histopathological analyses, performed on Day 15 after EAE induction, revealed no difference in numbers of Nogo-A positive mature oligodendrocytes (C) between groups, whereas higher numbers of Olig-2 positive cells (D and E) were found after treatment with CDP-choline in EAE lesions (n = 6 per treated group and n = 8 for naïve mice). On Day 27 after immunization, higher numbers of Nogo-A positive oligodendrocytes (F and H, n = 6 per group) and an increased myelinated area (CNPase stain; G and H, n = 6 per group) were found in CDP-choline treated mice. Bars represent mean ± SEM, *P < 0.05, **P < 0.01, ***P < 0.001. p.i. = post-immunization; NAWM = normal appearing white matter.
To dissect mechanisms of CDP-choline action in EAE, spinal cord cross sections from preventively treated and EAE-control mice were subjected to histopathological analyses. On Day 15 post-immunization, immunohistochemistry revealed higher numbers of Olig-2 positive oligodendroglia in CDP-choline treated mice (Fig. 1D and E; P < 0.05) whereas numbers of mature Nogo-A positive oligodendrocytes were not different (Fig. 1C). As the marker Olig-2 stains mature oligodendrocytes and OPCs, higher numbers of Olig-2 positive cells in CDP-choline treated mice are likely caused by expansion of OPCs. Accordingly, on Day 27 post-immunization, numbers of mature Nogo-A positive oligodendrocytes were increased in lesioned white matter of CDP-choline treated mice (Fig. 1F and H; P < 0.05). This was accompanied by a higher degree of myelination as measured by CNPase staining (Fig. 1G and H; P < 0.05). In addition, axonal densities and axonal integrity were preserved in the CDP-choline treated group as quantified by Bielschowsky’s silver stain (Supplementary Fig. 1E and Supplementary Data; P < 0.01) and assessed by SMI31/32 immunostaining (Supplementary Fig. 1E), respectively. Opposed to evident changes in the glial and neuronal compartment, no change in quantities of CD3-positive CNS infiltrating T lymphocytes was observed on Days 15 and 27 after EAE induction (Supplementary Fig. 1C and Supplementary Data). After haematoxylin and eosin and Mac-3 staining, there was no difference in infiltrating macrophages/microglia between both groups on Days 15 and 27 post-immunization, neither regarding cell densities, number of infiltrates, nor the extent of infiltrated area (Supplementary Fig. 1D and Supplementary Data and data not shown).
To closely investigate potential effects of CDP-choline on the immune system, including T cell responses, we performed multicolour flow cytometry of splenic leukocytes shortly after the onset of disease (Day 10 post-immunization). CDP-choline did not impact on the abundance of splenic CD3 positive T cells or frequencies of CD4 positive helper T cells and CD8 positive cytotoxic T cells (Supplementary Fig. 2A). Moreover, T cell-bound expression of the activation markers CD62L and CD44 was identical in treated and EAE-control mice (Supplementary Fig. 2B and Supplementary Data). CDP-choline did not affect frequencies of CD19 positive B cells, NK1.1 positive NK cells, and NK1.1/CD3 positive NK-T cells (Supplementary Fig. 2D–F). Upon antigen-specific restimulation of splenocytes from CDP-choline treated and EAE-control mice in vitro, production of the cytokines IFNG, IL10, and IL17 as well as T cell proliferation did not differ between the CDP-choline treated and EAE-control group (Supplementary Fig. 2G–J). Flow cytometry of splenic and CNS resident myeloid cells on Day 10 after EAE induction did not reveal any effects of CDP-choline treatment: there were neither effects on the abundance of CD11b-positive cells, including Ly6c low monocytes, nor on CD11c/PDCA-1/B220 positive plasmacytoid dendritic cells (Supplementary Fig. 3A–C). Splenic CD11b-positive myeloid cells did not change their surface expression of MHCII and CD80 under CDP-choline treatment (Supplementary Fig. 3D and Supplementary Data). Likewise, CNS resident CD11b-positive microglia/macrophages from CDP-choline treated and control mice expressed the same amounts of CD11b, CD80, and CD45 (Supplementary Fig. 3F–H). Furthermore, serum corticosterone levels were not changed between the CDP-choline treated and EAE-control group on Day 10 post-immunization (Supplementary Fig. 2K).
In summary, CDP-choline effectively ameliorated the disease course of MOG-EAE especially at earlier phases of the disease before onset of irreversible neurodegeneration without modulation of myeloid cells and T cell responses. The beneficial effects of CDP-choline were accompanied by higher numbers of oligodendrocytes and myelination which may be the result of an increased OPC generation.
Regenerative effects of CDP-choline after cuprizone-induced demyelination
In EAE the beneficial effect could be partly due to T cell independent effects on the immune system. We therefore analysed direct effects of CDP-choline on myelin and glia in the cuprizone model of toxic de- and remyelination where the peripheral immune system is of no importance in lesion induction (Kipp et al., 2009; Skripuletz et al., 2013). Mice responded to cuprizone treatment as expected, showing marked demyelination of the corpus callosum during the 5 weeks of cuprizone feeding (Fig. 2B and C). No difference was found between treated and control groups showing that CDP-choline did not influence demyelination in this model.
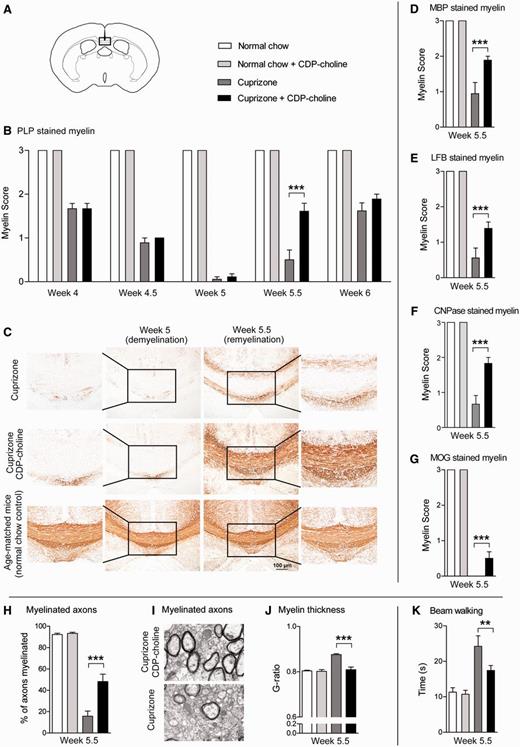
CDP-choline accelerates remyelination after cuprizone-induced demyelination. CDP-choline increased remyelination in the corpus callosum of mice 0.5 weeks after cuprizone withdrawal. Mice were fed with cuprizone for 5 weeks to analyse demyelination. After 5 weeks cuprizone was withdrawn and mice were allowed to remyelinate. The extent of myelination was judged by scoring of PLP (B and C), MBP (D), LFB (E), CNPase (F), and MOG (G) stained brain sections. In CDP-choline treated mice at Week 5.5, electron microscopy of the corpus callosum presents higher numbers of myelinated axons (H and I) and lower G-ratios of the myelinated axons (J) indicating a higher thickness of myelin when compared with cuprizone controls. K represents decreased motor coordination deficits in the beam walking test of CDP-choline treated mice during remyelination at Week 5.5. In A the box marks the area of the brain coronal section that represents the middle part of the corpus callosum of which camera images were taken. Bars represent mean ± SEM, **P < 0.01, ***P < 0.001, n = 6 per time point and group (histology and immunohistochemistry), n = 3 per treated group (electron microscopy).
Yet, CDP-choline led to profound effects on remyelination: at Week 5.5 (0.5 week of remyelination) mice treated with CDP-choline already presented high densities of new myelin proteins throughout the complete corpus callosum. For each of the markers studied in immunohistochemical (PLP, MBP, CNPase, MOG) and histochemical stainings (LFB Luxol Fast blue), CDP-choline treated mice showed significantly higher amounts of new myelin compared to the cuprizone controls (for all P < 0.0001; Fig. 2B–G). At that time point, no or only a low amount of new myelin was expressed at the edges of the corpus callosum in cuprizone control mice (Fig. 2C). At Week 6, strong remyelination was observed in both cuprizone groups and no significant difference between the groups was seen any more.
In a next step, ultrastructual investigations were performed for quantitative analysis of myelinated axons and confirmed the beneficial effects of CDP-choline on remyelination. CDP-choline significantly increased the number of myelinated axons compared to the cuprizone controls (P < 0.001; Fig. 2H and I). Additionally, CDP-choline induced lower G-ratios of the myelinated axons when compared with cuprizone controls indicating a better remyelination (P < 0.001; Fig. 2J). In summary, CDP-choline effectively promoted myelin regeneration in the CNS.
To confirm the beneficial effects of CDP-choline on remyelination, the beam walking test was performed to analyse effects on motor coordination. During demyelination, disturbances of motor coordination were seen as the time taken by mice to traverse a narrow beam increased compared to mice fed with normal chow. No difference was seen between cuprizone groups. Analogous to higher regeneration at Week 5.5, mice treated with CDP-choline presented decreased disturbance of motor coordination when compared to the cuprizone controls (Fig. 2K; P < 0.0001). Thus, our results show that CDP-choline not only increased remyelination but also reversed demyelination-associated motor coordination impairment.
Impact of CDP-choline on OPC proliferation
To further evaluate the mechanisms of CDP-choline on remyelination, oligodendrocytes and OPCs were investigated in the corpus callosum. Mature oligodendrocytes were analysed using immunohistochemical staining for Nogo-A and APC, whereas proliferating OPCs were labelled by double staining for Olig-2/Ki-67 and NG2/Ki-67. After 4 and 4.5 weeks of cuprizone treatment mature oligodendrocytes in the corpus callosum have almost completely vanished (Fig. 3B). Thereafter, oligodendrocytes began to reappear. Analogous to myelin re-expression the density of Nogo-A and APC positive oligodendrocytes was significantly higher in mice treated with CDP-choline compared to cuprizone controls (for both, P < 0.0001; Fig. 3B–D). These results show that CDP-choline exerts beneficial effects on remyelination associated with increased numbers of oligodendrocytes.
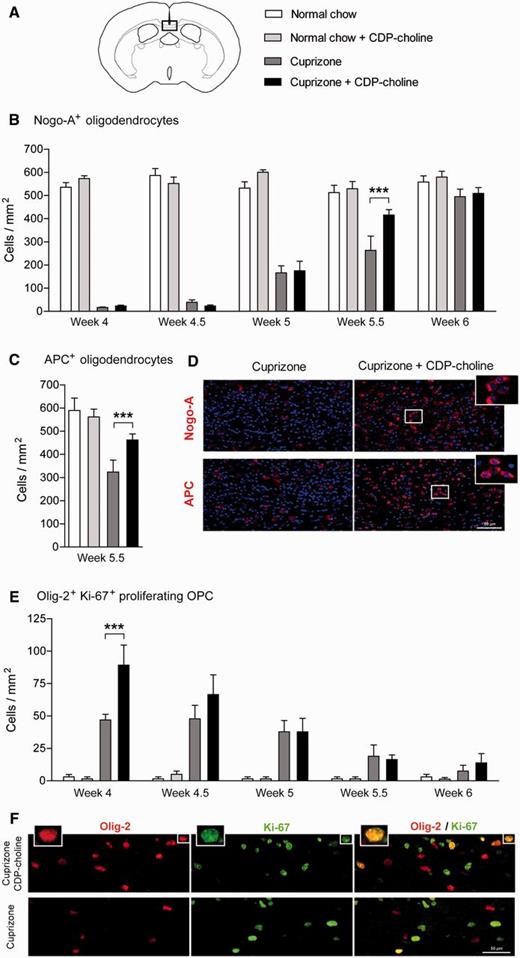
CDP-choline increases OPC proliferation and the number of mature oligodendrocytes. Increased numbers of Nogo-A (B and D) and APC (C and D) positive mature oligodendrocytes in CDP-choline treated mice were found at Week 5.5 in the corpus callosum. At Week 4 of cuprizone feeding, CDP-choline increased numbers of Olig-2/Ki-67 positive proliferating OPCs (E and F). In A the box marks the area of the brain coronal section that represents the middle part of the corpus callosum of which camera images were taken. Bars represent mean ± SEM, ***P < 0.001, n = 6 per time point and group.
During the period of oligodendrocyte loss high numbers of new proliferating OPCs (Olig-2 and Ki-67 double positive cells) entered the corpus callosum, reaching a peak at Week 4–4.5 followed by a decrease. At the peak of proliferation, CDP-choline significantly increased the numbers of proliferating OPCs in the corpus callosum (P < 0.0001; Fig. 3E and F). The results were confirmed by the double staining for NG2/Ki-67 (P = 0.02; Supplementary Fig. 6A and Supplementary Data). This result indicates that the higher numbers of mature oligodendrocytes found in CDP-choline treated mice during remyelination might be a result of higher numbers of proliferating OPCs found 1.5 weeks earlier.
Glial reactions were further analysed by imunohistochemistry for microglia/macrophages (staining for Mac-3 and RCA-1) and astrocytes (staining for GFAP). During demyelination no CDP-choline treatment effects were found on microglia/macrophage numbers (Supplementary Fig. 7B and Supplementary Data). When strong remyelination occurred, numbers of microglia were significantly lower in CDP-choline treated mice compared to cuprizone controls (for both P < 0.0001; Supplementary Fig. 7B and Supplementary Data). For proliferating microglia (RCA-1 and Ki-67 positive cells) and astrogliosis, no CDP-choline treatment effects were found during the entire de- and remyelination phase (Supplementary Fig. 7D and Supplementary Data).
To identify factors involved in early remyelination, the mRNA expression of selected factors that have been associated with OPC proliferation was analysed in the corpus callosum. No significant CDP-choline effects were found for Igf1, Hgf, Fgf2, Lif, Cntf, Bdnf and Pdgfa mRNA expression after 4.5, 5 and 5.5 weeks of cuprizone feeding (Supplementary Fig. 8).
CDP-choline enhances remyelination in a time window that dependens on OPC proliferation
We next tested CDP-choline treatment in different time periods to evaluate additional mechanistic effects on oligodendrocytes and remyelination. CDP-choline was given in five different temporal treatment schemes (between Weeks 3–4, 3–5.5, 4–5, 4–5.5 and 5–5.5) during cuprizone treatment and remyelination.
CDP-choline increased remyelination and oligodendrocyte numbers only when given between Weeks 4 and 5 of cuprizone treatment (treatment protocols: Weeks 3–5.5, 4–5, and 4–5.5) (Fig. 4, for PLP P < 0.01; for APC P < 0.0001). In this time window, OPCs proliferate in the corpus callosum in the cuprizone model, while no significant OPC proliferation occurs between Weeks 3–4 and 5–5.5. Thus, these results suggest that CDP-choline increases numbers of oligodendrocytes via increasing the proliferation of OPCs.
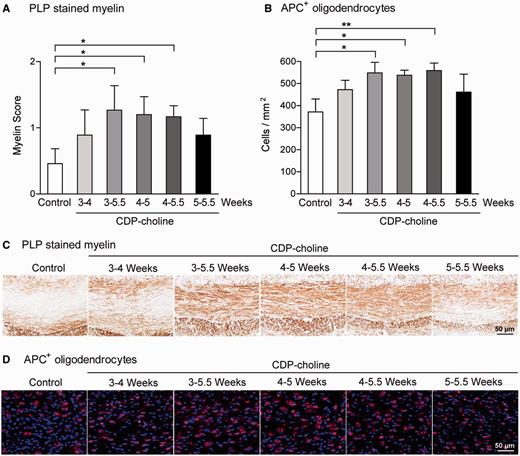
Effects of CDP-choline on remyelination are dependent on OPC proliferation. Treatment with CDP-choline between Weeks 3–5.5, 4–5, and 4–5.5 increased remyelination as shown by myelin proteolipid protein (PLP) staining (A and C) and numbers of APC positive oligodendrocytes (B and D). No effects were found when CDP-choline treatment was performed between Weeks 3–4 and 5–5.5. These results show that CDP-choline exerts its effects on oligodendrocytes and remyelination in a time window between Weeks 4 and 5 of cuprizone treatment. During this time window OPC proliferate in the corpus callosum in the cuprizone model. Bars represent mean ± SEM, *P < 0.05, **P < 0.01, n = 6 per group.
Involvement of protein kinase C in CDP-choline mediated OPC proliferation
To further study the mechanisms of CDP-choline on OPCs, additional cell culture proliferation, differentiation and migration assays were performed. Incubation of OPCs with CDP-choline significantly enhanced their proliferation as measured by BrdU incorporation (P = 0.03; Fig. 5A and B). The increased proliferation of OPCs after CDP-choline treatment was confirmed by staining of OPCs with the proliferation marker Ki-67 by omitting BrdU (P = 0.035; Supplementary Fig. 5A). As shown in Supplementary Fig. 5C, CDP-choline did not influence the differentiation of OPC into mature oligodendrocytes. In addition, no effects of CDP-choline were found on OPC migration (Supplementary Fig. 5D).
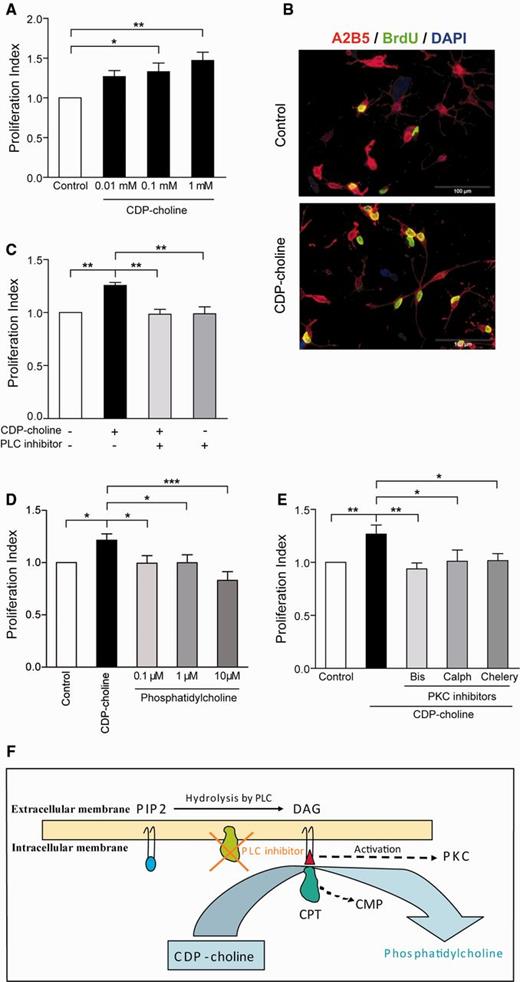
Effects of CDP-choline on OPC proliferation in vitro. CDP-choline increased the proliferation rate of OPCs in cell culture experiments as measured by BrdU incorporation (A, n = 4). In B exemplary stained proliferating OPC (green BrdU, red A2B5) are shown after incubation with CDP-choline compared to controls (nuclei were counterstained with DAPI). Inhibition of the enzyme phospholipase C (PLC), which is required for the activation of the enzyme diacyglyceride (DAG), reversed the additional proliferative effects induced by CDP-choline (C, n = 4). Phosphatidylcholine (end product in the CDP-choline pathway) did not induce any effects on OPC proliferation (D, n = 5). DAG is essential for the activation of protein kinase C (PKC) and three different inhibitors (Bis = bisindolylmaleimide IV: Calph = calphostin C: Chelery = chelerythrine chloride) were tested with CDP-choline in OPC cultures. All PKC inhibitors completely reversed the additional proliferative effects of CDP-choline (E, n = 5). Bars represent mean ± SEM, *P < 0.05, **P < 0.01, ***P < 0.001. The schematic overview (F) shows that CDP-choline is converted directly with DAG to phosphatidylcholine and CMP (cytidine-mono-phosphate) in a reaction catalyzed by CPT (1,2-diacylglycerol cholinephosphotransferase). DAG is a product of the hydrolysis of PIP2 (phosphatidylinositol 4,5-bisphosphate) by the membrane-bound enzyme PLC (phospholipase C) and is an essential physiological activator of protein kinase C. Our results show that the inhibition of PLC and thereby DAG reverses the CDP-choline effect on proliferation. DAG is essential for protein kinase C activation and it can be suggested that CDP-choline exerts its effects on proliferation via DAG and thus via protein kinase C activation, as we could show that inhibition of PKC activity reversed the CDP-choline effects on proliferation and phosphatidylcholine had no effects on proliferation. PIP2 = phosphatidylinositol 4,5-bisphosphate.
Within cells CDP-choline can be converted directly with diacyglyceride (DAG) into phosphatidylcholine, a major component of the cell membrane (Hjelmstad and Bell, 1991; McMaster and Bell, 1994). Thus, we have used an inhibitor of the enzyme phospholipase C (PLC), which is required for the activation of DAG (Fukami et al., 2010). The PLC inhibitor did not influence the basic proliferation rate of OPC (Fig. 5C) whereas the addition of the PLC inhibitor to OPC cultures before adding CDP-choline completely reversed the additional proliferative effects of CDP-choline (Fig. 5C). Control experiments with phosphatidylcholine (end product in the CDP-choline pathway) showed no effects on OPC proliferation (Fig. 5D). As diacyglyceride is also an essential mediator for the activation of protein kinase C (PKC) and protein kinase C is involved in regulating cell proliferation (Reyland, 2009; Fukami et al., 2010), three different protein kinase C inhibitors were used along with CDP-choline in OPC cultures. A protein kinase C inhibitor dosis that did not influence the basal proliferation of OPCs was chosen. All protein kinase C inhibitors completely reversed the additional proliferative effects exerted by CDP-choline (Fig. 5E). To determine whether protein kinase C phosphorylation was required for CDP-choline induced OPC proliferation, the cells were treated with CDP-choline and immunoreactivity for phospho-protein kinase C was investigated by western blotting. Results show that treatment of OPCs with CDP-choline did not increase the phosphorylation of protein kinase C (Supplementary Fig. 5B). These results suggest that the CDP-choline induced OPC proliferation requires protein kinase C, however, phosphorylation of protein kinase C seems not to be affected. Our results provide strong evidence for a protein kinase C-mediated effect of CDP-choline to increase the proliferation rate of OPCs.
CDP-choline does not influence the function of microglia/macrophages in vitro
Macrophages and microglial cells are known to be involved in CNS repair mechanisms (Kotter et al., 2011). We have thus analysed the effects of CDP-choline on microglia and macrophages in cell culture experiments. CDP-choline did not exert any effects on TNFA, IL10, and nitrite release in microglia and macrophages (Supplementary Fig. 4D–F and Supplementary Data). In addition, CDP-choline did not exert any effects on macrophage phagocytosis, macrophage migration, macrophage polarization (M1/M2), and the production of further cytokines (IL6, IL1B, MCP1, MIP1α) (Supplementary Fig. 4). Furthermore, the supernatants of CDP-choline stimulated microglia had no effects on OPC proliferation (Supplementary Fig. 5H). Thus, our results indicate that CDP-choline does not drive its regenerative effects via microglia and the effects on OPCs are driven directly via promotion of OPC proliferation.
Discussion
The concept that remyelination protects against progressive axonal injury and consequently diminishes long-term disability in patients with multiple sclerosis is the subject of increasing interest and attention within the neurosciences (Franklin and ffrench-Constant, 2008; Kotter et al., 2011). In this context, new aspects of the underlying mechanisms of remyelination and the role of OPCs in these processes are being discovered continuously. Yet despite advances in understanding the oligodendrocyte biology in remyelination, regenerative compounds for patients with multiple sclerosis are still not available. CNS remyelination is the result of migration, proliferation and differentiation of OPCs. These processes need to be orchestrated by many signals and failure at any stage might lead to remyelination failure. Strategies to enhance remyelination are preferentially based on promoting OPC differentiation into new myelin building oligodendrocytes. Some of the mechanisms by which the inhibition of OPC differentiation is regulated have recently been described. These include modulation of S1P receptors by FTY720 (Miron et al., 2008) and phosphodiesterase 7 (Medina-Rodriguez et al., 2013). Inhibiting LINGO1 presents another option to enhance remyelination in patients with multiple sclerosis, as it was found to negatively regulate remyelination by inhibiting OPC differentiation (Mi et al., 2005). Treatment with LINGO1 antagonists exerted beneficial effects on remyelination by induction of OPC differentiation in vitro and in animal models of multiple sclerosis (Mi et al., 2009) and clinical trials with the aim to prove the effects of LINGO1 blocking in multiple sclerosis patients are ongoing.
In our study, we identified the substance CDP-choline for its potent regenerative effects. CDP-choline ameliorated the disease course and exerted beneficial effects on myelin, oligodendrocytes, and axons in EAE. Furthermore, after cuprizone-induced demyelination CDP-choline effectively enhanced remyelination and reversed motor coordination deficits. The increased regeneration arose from an increase in the numbers of proliferating OPCs, which resulted in higher numbers of new oligodendrocytes. Several earlier studies indicated that CDP-choline may have the capacity to protect cells, such as neurons, and that cellular proliferation may be stimulated by this substance (Mykita et al., 1986; Hurtado et al., 2011; Gutierrez-Fernandez et al., 2012). However, the substance was not tested for its neuroprotective and regenerative effects in demyelinating diseases such as multiple sclerosis.
To date, several potentially neuroprotective approches have been described in animal models mimicking multiple sclerosis (Aktas et al., 2010; Tselis et al., 2010). These include activation of the Nrf2 antioxidant pathway (Linker et al., 2011), sodium channel blockers (Meuth et al., 2010), matrix metalloproteinase inhibitors (Maier et al., 2007), and glutamate antagonists (Smith et al., 2000). Although these substances may to some extent exert neuroprotection, effects on remyelination were not found. CDP-choline is characterized by a very beneficial side effect profile not only in animal models, but also in humans (Adibhatla and Hatcher, 2005). CDP-choline has been studied in >11 000 humans and showed some beneficial effects in traumatic brain injury, Alzheimer’s and Parkinson’s diseases, learning and memory disorders, amblyopia, and glaucoma (Adibhatla and Hatcher, 2005). Side effects were rare and consisted mainly of stomach pain, diarrhoea, and headaches (Conant and Schauss, 2004; Davalos and Secades, 2011). The sodium salt of CDP-choline, the form used in clinical trials, is sold as a drug in Europe (Conant and Schauss, 2004). Due to this excellent safety profile and easy availibility, CDP-choline is a promising substance, which may be of particular interest as an add-on therapy in multiple sclerosis patients.
In the present study we could not find any neuroprotective effects of CDP-choline in two different animal models of multiple sclerosis. However, we identified the substance CDP-choline to enhance CNS remyelination via a novel mechanism mediated by the choline metabolic pathway. Recently, clinical trials in acute ischaemic stroke did not reveal beneficial effects of CDP-choline (Davalos et al., 2012), which might be explained by a completely different mechanism of lesion induction. In contrast to stroke, multiple sclerosis lesions are accompanied by demyelination and subsequent repair processes. This remyelination is the result of migration and proliferation of OPCs that differentiate into mature oligodendrocytes and build new myelin sheaths (Franklin and ffrench-Constant, 2008). Our results from the cuprizone model and preventive MOG-EAE show that CDP-choline promotes remyelination via increasing numbers of OPCs and thus oligodendrocytes. In EAE, treatment with CDP-choline from the onset of disease (Day 7 after immunization) was still effective. In contrast, treatment with CDP-choline after the peak of disease (Day 15 after immunization) was ineffective in ameliorating clinical symptoms of EAE. Since the maximum of proliferating OPCs occurs before Day 15 in the MOG-EAE (Herrero-Herranz et al., 2008), the results from the CDP-choline treatment at the peak of disease are consistent with an effect of CDP-choline on proliferating OPCs. In view of our results, we firmly believe that effects on OPCs are an important mechanism of CDP-choline action after a demyelinating attack. However, it is possible that this mechanism is not exclusive.
In the cuprizone model CDP-choline not only increased the numbers of myelinated axons, but the newly formed myelin sheaths were also thicker as compared to cuprizone controls. The effects on remyelination are not mediated via increasing the production of growth factors that are known to have an impact on OPC proliferation. Instead, our results provide a new mechanism of remyelination via the choline metabolism. In the CNS, choline is used for the biosynthesis of acetylcholine and the cell membrane phospholipid phosphatidylcholine (lecithin) (Weiss, 1995; Clement and Kent, 1999; Hunt et al., 2001). In the synthesis of phosphatidylcholine the availability of choline might be limited during pathological conditions in which regenerative processes require more substrate. Thus, exogenously applied CDP-choline is an interesting tool to promote these processes as it disperses in the organism mainly in the form of its degradation products choline and cytidine, which cross easily the blood–brain barrier (Conant and Schauss, 2004; Garcia-Cobos et al., 2010).
In our work, exogenous CDP-choline was effective to increase the proliferation of OPCs in vivo as well as in vitro. In the synthesis of phosphatidylcholine, CDP-choline first needs to be produced from choline and cytidine as an intermediate compound. In the next step, CDP-choline is converted together with diacyglyceride into phosphatidylcholine by the enzyme CPT (Hjelmstad and Bell, 1991; McMaster and Bell, 1994). Inhibition of the enzyme phospholipase C, which is essential for the activation of diacyglyceride (Fukami et al., 2010), completely reversed the enhancement of proliferation of CDP-choline demonstrating that diacyglyceride is required in this process. The end product phosphatidylcholine did not show any effect on OPC proliferation, further supporting the role of diacyglyceride in CDP-choline enhanced OPC proliferation. At the same time, diacyglyceride is also an essential mediator for the activation of protein kinase C that is involved in the regulation of cell proliferation (Reyland, 2009; Fukami et al., 2010). Inhibition of protein kinase C completely reversed the additional proliferative effects induced by CDP-choline. Thus, our results provide strong evidence for a protein kinase C-mediated effect of CDP-choline to increase the proliferation rate of OPCs. However, it is possible that this mechanism is not exclusive and might not occur in adult OPCs.
In conclusion, our results identified CDP-choline as a drug with remyelination promoting functions with a new mechanism of action. We believe that CDP-choline is a promising substance for multiple sclerosis patients and should be further explored for its regenerative effects in humans.
Acknowledgements
We thank I. Cierpka-Leja, S. Lang, K. Rohn, S. Seubert, and A. Niesel for excellent technical assistance. Further, we thank Trommsdorff GmbH & Co. KG Arzneimittel for donating CDP-choline. We are indebted to Ben Ettle, Department of Molecular Neurology, Erlangen, Germany for help with confocal microscopy of EAE lesions.
Funding
T.S., W.B. and M.S. are supported by the German Research Foundation (DFG, FOR 1103, TP1b, STA 518/4-1, BA 815/10-2). R.A.L. holds an endowed chair supported by the Novartis Stiftung für Therapeutische Forschung.
Supplementary material
Supplementary material is available at Brain online.
Abbreviations
- APC
anti-adenomatus polyposis coli
- EAE
experimental autoimmune encephalomyelitis
- OPC
oligodendrocyte precursor cell
- PLP
proteolipid protein
References
Author notes
*These authors contributed equally to this work.

