


Abstract
Amyotrophic lateral sclerosis is heterogeneous with high variability in the speed of progression even in cases with a defined genetic cause such as superoxide dismutase 1 (SOD1) mutations. We reported that SOD1G93A mice on distinct genetic backgrounds (C57 and 129Sv) show consistent phenotypic differences in speed of disease progression and life-span that are not explained by differences in human SOD1 transgene copy number or the burden of mutant SOD1 protein within the nervous system. We aimed to compare the gene expression profiles of motor neurons from these two SOD1G93A mouse strains to discover the molecular mechanisms contributing to the distinct phenotypes and to identify factors underlying fast and slow disease progression. Lumbar spinal motor neurons from the two SOD1G93A mouse strains were isolated by laser capture microdissection and transcriptome analysis was conducted at four stages of disease. We identified marked differences in the motor neuron transcriptome between the two mice strains at disease onset, with a dramatic reduction of gene expression in the rapidly progressive (129Sv-SOD1G93A) compared with the slowly progressing mutant SOD1 mice (C57-SOD1G93A) (1276 versus 346; Q-value ≤ 0.01). Gene ontology pathway analysis of the transcriptional profile from 129Sv-SOD1G93A mice showed marked downregulation of specific pathways involved in mitochondrial function, as well as predicted deficiencies in protein degradation and axonal transport mechanisms. In contrast, the transcriptional profile from C57-SOD1G93A mice with the more benign disease course, revealed strong gene enrichment relating to immune system processes compared with 129Sv-SOD1G93A mice. Motor neurons from the more benign mutant strain demonstrated striking complement activation, over-expressing genes normally involved in immune cell function. We validated through immunohistochemistry increased expression of the C3 complement subunit and major histocompatibility complex I within motor neurons. In addition, we demonstrated that motor neurons from the slowly progressing mice activate a series of genes with neuroprotective properties such as angiogenin and the nuclear factor (erythroid-derived 2)-like 2 transcriptional regulator. In contrast, the faster progressing mice show dramatically reduced expression at disease onset of cell pathways involved in neuroprotection. This study highlights a set of key gene and molecular pathway indices of fast or slow disease progression which may prove useful in identifying potential disease modifiers responsible for the heterogeneity of human amyotrophic lateral sclerosis and which may represent valid therapeutic targets for ameliorating the disease course in humans.
Introduction
Amyotrophic lateral sclerosis (ALS) is an irreversible adult onset neurodegenerative disorder that primarily causes injury and cell death of lower motor neurons in the brainstem and spinal cord, and upper motor neurons in the motor cortex (Cleveland and Rothstein, 2001; Peviani et al., 2010; Ferraiuolo et al., 2011). Progressive muscle denervation leads to spreading failure of the neuromuscular system resulting in death in most cases from respiratory failure within 2–3 years of symptom onset. The majority of ALS cases are sporadic whereas inherited forms account for up to 10% of cases. Twenty per cent of familial ALS is caused by mutation in the Cu/Zn superoxide dismutase (SOD1) gene. A body of evidence indicates that ALS is a heterogeneous disease with respect to the site and age of symptom onset and speed of disease progression (Beghi et al., 2007). Although the disorder is invariably lethal, with a median survival of <5 years, 20% of patients survive >5 years and 10% of patients survive >10 years from symptom onset. This heterogeneity can be seen even in individual members of families with a common autosomal dominant mutation in SOD1. It is likely that such heterogeneity is due to specific molecular mechanisms that influence the course of the disease and the response to treatment.
Transgenic mice that overexpress various human SOD1 mutations replicate quite well multiple clinical and pathological features of human ALS (Gurney et al., 1994; Bendotti and Carrì, 2004; Kato, 2008). These murine models develop severe and progressive motor neuron degeneration that leads to muscular weakness and paralysis culminating in death. As in the human disease, these mouse models may also vary in terms of age of onset, rapidity of disease progression, and certain histopathological features, mimicking the diversity of clinical phenotypes observed in human patients with ALS (Heiman-Patterson et al., 2005, 2011). Such variability may be related to differences in specific SOD1 mutations, in the number of transgene copies or in the expression levels of the mutant SOD1 protein (Turner and Talbot, 2008). However, these animals show considerable variability in the onset and duration of the clinical features even among siblings, suggesting that there is genetic variability similar to the human disease in this rodent model that could be determined by potential disease modifying genes influencing specific biochemical pathways (Heiman-Patterson et al., 2011).
Our understanding of disease pathogenesis has increased by the study of models of SOD1-related ALS and it is clear that multiple mechanisms contribute to motor neuron injury, including mitochondrial dysfunction, oxidative stress, protein misfolding/aggregation and axonal transport defects (Peviani et al., 2010; Ferraiuolo et al., 2011). In addition, it has become clear that certain aspects of ALS are non-cell autonomous and that other cell types within the CNS and periphery contribute to motor neuron injury including microglia, astrocytes, oligodendrocytes, macrophages and T cells (Boillee et al., 2006b; Lobsiger and Cleveland, 2007; Appel et al., 2010; Robberecht and Philips, 2013). Large scale microarray analysis represents an excellent tool to analyse the complex pathobiology of ALS and to elucidate the contribution of specific biochemical pathways to the neurodegenerative process (Cooper-Knock et al., 2012). Furthermore, with the development of technology for isolating individual cells using laser capture microdissection, it has now been possible to analyse, on a genome-wide level, molecular changes in specific cell types, reducing the background noise arising from whole tissue analysis.
Several studies have combined laser capture microdissection and microarray analysis in the spinal cord of transgenic mice as a means for identifying pathophysiological changes that occur in motor neurons during disease progression in ALS (Perrin et al., 2005, 2006; Ferraiuolo et al., 2007; Lobsiger et al., 2007; Saxena et al., 2009). These studies principally focused on a comparison of mice with the same genetic background but different SOD1-related mutations with the aim of identifying common gene alterations in different ALS mice models as biomarkers of the disease. Key transcripts and pathways which were differentially expressed at different stages of the disease course have been identified in these reports. However, no previous gene expression analysis has attempted to analyse the effects of the genetic background on the phenotype of the murine disease, which may represent an important means of identifying factors influencing the rate of disease progression.
Recently, Mancuso et al. (2012) reported differences in disease onset and progression between C56BL/6 and B6SJL mouse strains carrying the same number of copies of the mutant G93A human SOD1 transgene. Heiman-Patterson et al. (2011) have also examined the effects of different genetic backgrounds on the phenotype of SOD1G93A mice. Preliminary results from an ongoing study showed that the SOD1G93A-NOD.RAG1KO line, which lack a functional immune system, showed a more aggressive disease course, suggesting a protective role of neuroinflammation, despite years of conjecture that inflammation is a major contributor to motor neuron injury (Ende et al., 2000; Yi et al., 2000; Glass et al., 2010; Papadimitriou et al., 2010). These reports highlight the importance of the genetic background on disease progression.
We previously reported that 129Sv mice show a much faster disease progression, with survival of 129 ± 5 days compared to a survival of 180 ± 16 days for the C57 mouse strain, even though they carry the same copy numbers of the human mutant SOD1 transgene and express the same amount of mutant SOD1 protein in the spinal cord (Pizzasegola et al., 2009). In the present study we combined laser capture microdissection and whole genome transcriptome analysis to identify alterations in the gene signature within motor neurons isolated from the lumbar spinal cord from C57-SOD1G93A (slowly progressing) mice and 129Sv-SOD1G93A (rapidly progressing) mice at different stages of the disease course.
We identified a marked difference in the motor neuron gene signature between the two mouse strains at the onset of the disease, before the appearance of overt signs of muscle weakness. At this stage of disease onset, motor neurons from the rapid progressor strain exhibit a marked impairment of specific pathways principally involved in mitochondrial function, protein degradation pathways and protein targeting, whereas the transcriptional profile of motor neurons from the slow progressor strain revealed an upregulation of genes involved in inflammation and immune system regulation such as major histocompatibility complex I (MhcI), chemokine (C-C motif) ligand 12 (Ccl12), complement component 3 (C3), coupled with a stable expression of key neuroprotective factors such as angiogenin (Ang) and nuclear factor (erythroid-derived 2)-like 2 (Nrf2, now known as Nfe2l2). These results indicate that genetic background has a major influence on the lifespan of SOD1 mutant mice. It is noteworthy that biological processes like an early inflammatory response, classically considered detrimental, appear to slow down disease progression. The interactions of mutant SOD1 with specific genetic modifiers and pathways, which vary in expression in different strains of mice, may be helpful in identifying therapeutic targets for ameliorating disease progression in human ALS.
Materials and methods
Mouse models
Mice were maintained at a temperature of 21 ± 1°C with a relative humidity 55 ± 10% and 12 h of light/dark cycle. Food (standard pellets) and water were supplied ad libitum. Procedures involving animals and their care were conducted according to the Mario Negri institutional guidelines, that are in compliance with national (D.L. no. 116, G.U. suppl. 40, Feb.18, 1992, Circular No.8, G.U., 14 luglio 1994) and five international laws and policies (EEC Council Directive 86/609, OJ L 358, 1 Dec.12, 1987; NIH Guide for the Care and use of Laboratory Animals, U.S. National Research Council, 1996). All the experiments and the protocol proposed in the project were examined first by the Institutional Ethical Committee and then sent to the Italian Ministry of Health for authorization. The mice were bred and maintained in a specific pathogen-free environment. Animals with substantial motor impairment had food on the cage bottom and water bottles with long drinking spouts.
Female transgenic SOD1G93A mice of C57BL/6JOlaHsd (C57-SOD1G93A) or 129SvHsd (129Sv-SOD1G93A) genetic background and corresponding non-transgenic female littermates were used in this study. Both mouse lines derive from the line originally obtained from Jackson Laboratories (B6SJL-TgNSOD-1-SOD1G93A-1Gur) expressing ∼20 copies of human mutant SOD1 with a Gly93Ala substitution and were maintained on a C57OlaHsd or 129SvHsd background (for more than 30 or 10 generations, respectively) at Harlan Italy S.R.L. The two transgenic mouse strains show major clinical differences in terms of age of symptom onset, survival length and disease duration (Pizzasegola et al., 2009). Analysis of motor dysfunction was performed as reported in Pizzasegola et al. (2009). The onset of symptoms was considered when the mice showed the first sign of impairment on paw grip strength and the body weight started to decline. The symptomatic and the end stages were considered when the mice exhibited a decrease of ∼50% or ∼80%, respectively, in their latency on the grip strength and the body weight declined >5% or 20%, respectively, from the initial value.
Microarray analysis: tissue preparation
Spinal cord tissues were obtained from C57 and 129Sv transgenic SOD1G93A mice and age-matched non-transgenic littermates at the presymptomatic, the early symptomatic (onset) stage, symptomatic and end stage corresponding to initial, 50% or 80% impairment of grip strength. Mice at the different disease stages were intracardially perfused with 30% sucrose solution and the spinal cords were removed, the lumbar segment dissected out and included in OCT™ compound (Tissue-Tek®) before snap freezing and storage at −80°C until required. Frozen tissue sections (8 μm) were cut in a cryostat at −22°C, thaw mounted onto slides at room temperature, fixed in 70% ethanol, washed in diethylpyrocarbonate-treated water, and stained for 30 s in a solution of 0.1% w/v toluidine blue in 0.1 M sodium phosphate. Sections were then washed and dehydrated through graded ethanol concentrations (70%, 90% and 100%), and xylene (two washes of 5 min). Spinal motor neurons, identified by staining, anatomical location, size and morphology, were isolated on Arcturus Capsure Macro laser capture microdissection caps using the Veritas 704 Laser Capture Microdissection System (Harlow Scientific). Approximately 1000 motor neurons were dissected from the lumbar spinal cord of each mouse.
RNA amplification and microarray hybridization
RNA was extracted and purified from each sample using the PicoPureTM RNA isolation kit (Applied Biosystems), and amplified using the antisense RNA one cycle amplification process with GeneChip® 3’ IVT Express Kit (Affymetrix). This process is considered the gold standard preparation for gene expression analysis. Reverse transcription-in vitro transcription was experimentally validated using TaqMan® RT-PCR (MAQC Consortium et. al, 2006). Sixteen chips (four C57-SOD1G93A versus four C57-Ntg and four 129Sv-SOD1G93A versus four 129Sv-Ntg) were hybridized at each of the four time points according to the Affymetrix protocol. Amplified complementary RNA (15 µg) for each sample was fragmented and hybridized to GeneChip Mouse Genome 430 2.0 (Affymetrix) and scanned in the GeneChip Scanner 3000 for quantification of the hybridization signal.
Microarray data analysis
CEL files generated by the Affymetrix GeneChip Operating System were analysed using the probabilistic model implemented in the bioconductor package PUMA (Gentleman et al., 2004; Rattray et al., 2006; Pearson et al., 2009). This model combines the uncertainty estimates from replicated experiments in order to obtain point estimates and standard errors of the expression levels within each condition. Compared to the traditional statistical approach, which does not incorporate this information, this modelling approach results in a more robust and accurate analysis of differential gene expression (Liu et al., 2006). For each gene, the model returns the probability of positive log ratio (PPLR), which is then transformed in a Q-value (Storey, 2006) in order to account for multiple hypotheses testing. The data discussed in this publication have been deposited in NCBI’s Gene Expression Omnibus (Edgar et al., 2002) and are accessible through GEO Series accession number GSE46298.
Systems biology analysis
The Database for Annotation, Visualization and Integrated Discovery (DAVID) (http://david.abcc.ncifcrf.gov/) and the commercial software MetacoreTM (http://www.genego.com/metacore.php) were used to perform the systems biology analysis of the differentially expressed genes. DAVID is a web-based tool that provides integrated solutions for the annotation and analysis of genome-scale data sets derived from high-throughput technologies. MetaCore™ is an integrated knowledge database and software suite for pathway analysis of experimental data and gene lists. MetaCore™ is based on a proprietary manually curated database of human protein–protein, protein–DNA and protein compound interactions, metabolic and signalling pathways for human, mouse and rat, supported by proprietary ontologies and controlled vocabulary. Both DAVID and MetaCoreTM categorize gene identities by Gene Ontology (GO) annotation (http://www.geneontology.org/), which classifies transcripts according to their molecular function, biological process and cellular component. The statistical significance of each functional enriched cluster and pathway is indicated in both DAVID and MetacoreTM by a P-value yielded from Fisher’s exact test.
The GeneGo analysis of GO Cellular Process (Metacore™) defines a statistical classification of the main biological processes on the basis of the identity of transcripts with altered expression as well as through their potential interactions within annotated biological networks. Gene IDs of the data set(s) of interest are mapped to gene IDs in entities (terms) of built-in functional ontologies represented in Metacore™ by pathway maps and networks. The mapping procedure involves calculating the statistical relevance of the matches found. Both private GeneGo and public GO ontologies (GO processes, GO molecular function, GO localization) are used for the analysis. The statistical relevance of the ontology matches found is calculated as a P-value directly proportional to the number of processes related to the active data set. The lower the P-value, the higher is the ‘non-randomness’ of finding the intersection between the data set and the particular ontology. Canonical pathway maps represent a set of comprehensive signalling and metabolic maps. All maps are created by Thomson Reuters scientists by a high-quality manual curation process based on published peer-reviewed literature.
Immunoblotting techniques
Mice were sacrificed according to institutional ethical procedures by decapitation and the spinal cord was removed without fixation. The samples were immediately frozen on dry ice with the ventral portion of spinal cord face-up and stored at −80°C. For each mouse, lumbar spinal cord was longitudinally transected in 50 µm cryostat ventral and dorsal spinal cord sections as separate samples. The resulting cryostat ventral material was homogenized by sonication in ice-cold homogenization buffer (20 mM Tris-HCl pH 7.4, 2% Triton™ X-100, 150 mM NaCl, 1 mM EDTA, 5 mM MgCl2, 1 mM phenylmethylsulphonyl fluoride, and protease inhibitor cocktail, Roche), centrifuged at 13 000 rpm for 30 min at 4°C and the supernatants were collected and stored at −80°C. Equal amounts of total protein homogenates were loaded on polyacrylamide gels and electroblotted onto PVDF (Millipore) membrane as previously described (Basso et al., 2009). Alternatively, protein extracts were directly loaded on nitrocellulose membrane, Trans-Blot® Transfer Medium (Bio-Rad), by vacuum deposition on the Bio-Dot® SF blotting apparatus (Bio-Rad) as previously described (Nardo et al., 2009, 2011). Membranes were immunoblotted with the following primary antibodies: rabbit polyclonal anti-ANG (1:1000; Abcam); rabbit polyclonal anti-ATF-3 (1:1000; SantaCruz); rabbit polyclonal anti C3 H300 (1:100; Santa Cruz); rabbit polyclonal anti-KIF 5 A + B + C (1:1000; Abcam); rabbit polyclonal anti-NRF2 (1:200; Santa Cruz); rabbit monoclonal anti-UCH37 (1:1000; Abcam) mouse anti-β-actin (1:30000; Chemicon) followed by horseradish peroxidase-conjugated secondary antibodies (Santa Cruz) and developed by Luminata™ Forte Western Chemiluminescent HRP Substrate (Millipore) on the ChemiDoc™ XRS system (Bio-Rad). Densitometry was determined with Progenesis PG240 v2006 software (Nonlinear Dynamics). Immunoreactivity was normalized to β-actin or alternatively to the actual amount of proteins loaded on the membrane, as detected after Red Ponceau staining (Fluka). The immunoblotting analysis was performed for each protein on the ventral portion of lumbar spinal cord from four C57-SOD1G93A and four 129-SOD1G93A mice at the symptom onset stage and four age-matched non-transgenic mice for each strain. Statistical comparisons between groups were performed through two-way ANOVA using the Tukey’s post hoc test for multiple comparisons.
Immunohistochemistry
Anaesthetized mice were perfused transcardially with 4% paraformaldehyde and spinal cord dissected, post-fixed in 4% paraformaldehyde overnight at 4°C, preserved in 30% sucrose and then included in OCT™ compound. Immunohistochemical analyses were performed on free floating spinal cord cryosections (30 µm) and, after mounting on glass slides (Walderlmar Knittle) with 1:1 0.1 M PBS: glycerol, fluorescence-labelled samples were analysed under an Olympus Fluoview laser scanning confocal microscope (Olympus BX61 light microscope).
For immunohistochemical analysis of major histocompatability class I (MHCI) an alternative fixative procedure was performed according to the method described by Thams et al. (2009). Briefly, mice were perfused with Tyrodes’s buffer, followed by Lana’s fixative (4% formalin and 0.4% picric acid in 0.16 M PBS, pH 7.2) at 20°C. The lumbar spinal cord, sciatic nerve, and gastrocnemius muscles were quickly dissected out. The tissue was left in the same fixative for 90–180 min or overnight at 4°C, rinsed, and stored for 24 h in 10% sucrose with 0.1% sodium azide in 0.01 M PSB at 4°C for cryoprotection, before mounting in OCT™ compound. The spinal cords, sciatic nerves, and muscles were cut as 30, 14, and 20 µm sections, respectively. Spinal cord immunohistochemistry was performed on free-floating sections while nerve and muscle preparations were treated directly on gelatinized objective slides.
The following primary antibodies were used: rabbit polyclonal anti-ANG (1:1000; Santa Cruz); rabbit polyclonal anti-NRF2 (1:200; Santa Cruz); rabbit polyclonal anti-ATF-3 (1:500; Santa Cruz); rabbit monoclonal anti-UCH37 (1:200; Abcam); rabbit polyclonal anti-KIF 5 A + B + C (1:500; Abcam); rat monoclonal anti-MHC class I ER-HR 52 clone (1:100; Abcam), rat anti-C3b/iC3b/c3c (1:50; Hycult Biotech), rabbit anti-C3 H300 (1:100; Santa Cruz), mouse anti-SMI-31 (1:500; Sternberger Inc), rabbit anti-GFP (1:1000; Molecular Probes), rabbit anti-synaptophysin (1:200; Sigma Aldrich), isolectin GS-IB4 Alexa Fluor® 488 conjugate (1:200; Sigma), α-btx (5µg/ml) conjugated with Alexa Fluor® 594 (Invitrogen), neurotrace conjugated with Alexa Fluor® 488 or Alexa Fluor® 594 (Invitrogen), mouse anti-GFAP (1:2500; Millipore); mouse anti-CNPase (1:100; Millipore). Secondary antibodies were as follows: Alexa Fluor® 488 or Alexa Fluor® 594 goat anti-rat, Alexa Fluor® 488 or Alexa Fluor® 594 goat anti-rabbit, Alexa Fluor® 594 goat anti-mouse (Invitrogen). All the immunohistochemistry was performed through an indirect immunostaining protocol apart from ATF-3 for which an immunoperoxidase procedure was used. Briefly, tissue sections were treated with 1% hydrogen peroxide in PBS to inhibit endogenous peroxidases, blocked in 1% bovine serum albumin in PBS containing 0.2% Triton™ X-100 for 30 min and then incubated overnight with the primary antibodies diluted in PBS containing 0.1% bovine serum albumin. Immune reactions were revealed by 60 min incubation in the appropriate secondary biotinylated antiserum goat anti-rabbit (Vector Laboratories), followed by 75 min incubation in the avidin-biotin-peroxidase complex (Sigma) and using diaminobenzidine as the chromogen. Immunohistochemistry with monoclonal antibody to mouse C3b/iC3b/c3c and CNPase was performed with the Cy5-Tyramide Signal Amplification (TSA) system (Perkin Elmer, Inc). For each approach, control sections processed with omission of the primary antiserum and developed under the same conditions gave no immunostaining.
The colorimetric histochemical assay for activities of the mitochondrial electron transport chain complexes was performed according to the protocol described by Jung et al. (2002a, b). This approach is based on an in situ enzyme-histochemical assay that allows quantification of the activity of the electronic transport chain protein complexes directly on unfixed cryostat sections of a selected CNS area. We analysed the activity of the complex I. In brief, fresh isolated lumbar spinal cords were embedded in OCT™ compound on dry ice and stored at −80°C until sectioning. Eight-micrometer sections were cut at −20°C and mounted on SuperFrost® Plus microscope slides (VWR). To measure complex I activity, sections were incubated in 0.1 M Tris-HCl, 0.1 mg/ml NADH, 1.0 mg/ml NBT, 2 µg/ml antimycin A, 84 mM malonate and 2 mM KCN, pH 7.4 for 20 min. Photomicrographed immune-stained spinal cord sections (n = 3) from each mouse (three mice per group) were acquired using AnaliSYS software (SoftImaging Systems, ver. 3.2), imported in Fiji (ImageJ, Media Cybernatics) and assessed using quantitative densitometric analysis. A constant ventral horn size in each section was captured, the total number of pixels within that area was isolated, and the percentage of pixels darker than background was determined for each section after segmentation (area fraction). Statistical comparisons between groups was performed through two-way ANOVA using the Tukey’s post hoc test for multiple comparisons.
ATP colorimetric assay
Tissue samples were processed as for the immunoblotting. The ATP colorimetric assay (BioVision) was performed according to the manufacturer’s recommendations. ATP concentration (nmol/mg of tissue) was analysed in the ventral portion of lumbar spinal cord from four C57-SOD1G93A, four 129-SOD1G93A mice at the symptom onset and four age-matched non-transgenic mice for each strain. Statistical comparisons between groups was performed through two-way ANOVA using the Tukey’s post hoc test for multiple comparisons.
In vitro experiments
Primary spinal neurons were prepared from spinal cord of 14-day-old C57-SOD1G93A or non-transgenic mouse embryos. Cells were plated into wells previously coated with a layer of confluent non-transgenic astrocytes, cultured at 37°C in a humidified atmosphere of 95% air and 5% CO2. After 5–6 days in vitro, cells were fixed with Lana’s fixative for 30 min, and then processed for immunocytochemistry.
Results
Microarray analysis
The transcription profiles of laser captured motor neurons isolated from the lumbar ventral spinal cords of the rapid progressor (129Sv-SOD1G93A), slow progressor (C57-SOD1G93A) mice at four stages of the disease (presymptomatic, onset, symptomatic, end stage) (Supplementary Table 1) and respective non-transgenic littermates were generated using the murine GeneChip Mouse Genome 430 2.0 Plus (Affy MOE4302). To identify genes differentially expressed, CEL files generated by the Affymetrix GeneChip Operating System were analysed using the probabilistic model implemented in the Bioconductor package PUMA. Independent data outputs were produced at each stage of the disease for both mouse strains through the comparison of the gene expression profiles between four transgenic mice and four non-transgenic littermates. Probe sets with a Q-value ≤ 0.01 and a fold change ≥ 1.5 were defined as significantly differentially expressed.
Gene expression profiles
Overall gene expression profiles for both the rapid and slow progressor strains compared to their relative non-transgenic littermates during the progression of the disease are shown in Fig. 1. Area-proportional Venn diagrams, summarizing gene identifiers overlapping between 129Sv and C57 transgenic mice at the four stages of the disease are shown in Supplementary Fig. 1. At the presymptomatic and symptomatic stages, the C57 and 129Sv transgenic mice show a comparable trend in the transcriptome profile, although motor neurons from the rapid progressor strain exhibit an increase in the number of downregulated genes compared with the slow progressor strain (presymptomatic: 17% versus 11%; symptomatic: 53% versus 46%). The end stage disease is characterized by a large increase in the number of transcripts with altered expression in the motor neurons from both strains, (C57-SOD1G93A: 2716; 129Sv-SOD1G93A: 4063), most of which are downregulated (C57-SOD1G93A: 73% of the total; 129Sv-SOD1G93A: 72% of the total) (Fig. 1). The motor neuron gene signature at disease onset best discriminates the two transgenic mouse strains. At the onset of the disease there is a dramatic downregulation of gene expression/transcriptional repression in the 129Sv-SOD1G93A versus the C57-SOD1G93A mice: (1276 versus 346 genes). In contrast, an increase in the number of upregulated genes characterizes the C57-SOD1G93A compared with the 129Sv-SOD1G93A strain (848 versus 480 genes) (Fig 1). It is striking that, of the 1101 genes specifically altered in 129Sv-SOD1G93A motor neurons during this stage, 1055 (96%) are downregulated whereas of the 540 genes specifically altered in C57-SOD1G93A motor neurons, 457 (85%) are upregulated (Fig. 2A). On the basis of these initial results, a more detailed analysis has been performed on the differentially expressed genes of the two strains of transgenic mice at the onset of the disease, with the aim of identifying specific molecular mechanisms and key gene modifiers that are associated with the difference in phenotype between the two mouse strains.
![Gene expression profiles of C57-SOD1G93A and 129Sv-SOD1G93A motor neurons during the progression of the disease. The histograms (and corresponding tables) tabulate the distribution of genes with altered expression in motor neurons from both transgenic mice strains at the presymptomatic, onset, symptomatic and end stage. For each mouse strain the relative gene expression ratio [mean fold-change ratio between four SOD1G93A and four non-transgenic (Ntg) mice; Q-value ≤ 0.01 and fold change ≥ 1.5] was obtained at each stage. White bars = total number of genes with altered expression; red bars = upregulated genes; blue bars = downregulated genes.](https://oup.silverchair-cdn.com/oup/backfile/Content_public/Journal/brain/136/11/10.1093_brain_awt250/2/m_awt250f1p.jpeg?Expires=1716325030&Signature=IpycCqPvmPBDSyHLlYFC15BqXlajuX0T1p-xzn09yhE0XFMpITPVjdfuZL~zKvpZ0mjeJmMvqml-~oGp-AN~j5gmUElnp04bR3pyAt0JdgRfMw7W94ECptHvYi669xUDzfiiHfLTH~0EKvZf~7vf8KsHaAb9jQ9ZjhR02vLEu~h-jtYc31GmP~xLieqQUySKWDlFe7bB4LapLSRGud4f6yMFpPISlgJNJ-c3g5I6hE4u7gpzMrfADZl34Wlk39F7XIUog5L4fhJ6O7l-kCu1szwiON65W~koGvtRMAq0LDLSg~UrCItyDKVdfcNuVSeeKP0QpF80pZMDM~TCONrepA__&Key-Pair-Id=APKAIE5G5CRDK6RD3PGA)
Gene expression profiles of C57-SOD1G93A and 129Sv-SOD1G93A motor neurons during the progression of the disease. The histograms (and corresponding tables) tabulate the distribution of genes with altered expression in motor neurons from both transgenic mice strains at the presymptomatic, onset, symptomatic and end stage. For each mouse strain the relative gene expression ratio [mean fold-change ratio between four SOD1G93A and four non-transgenic (Ntg) mice; Q-value ≤ 0.01 and fold change ≥ 1.5] was obtained at each stage. White bars = total number of genes with altered expression; red bars = upregulated genes; blue bars = downregulated genes.
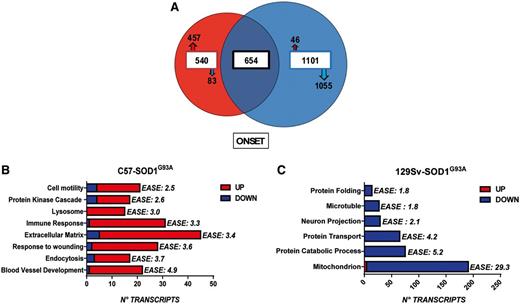
Gene distribution and enrichment analysis of C57-SOD1G93A and 129Sv-SOD1G93A motor neurons at disease onset. (A) Area proportional Venn diagram, summarizing gene identifiers overlapping (654 genes) between motor neurons from 129Sv-SOD1G93A (blue) and C57-SOD1G93A (red) mice at disease onset. The analysis of gene distribution shows the specific alteration of 540 genes in C57-SOD1G93A motor neurons, 457 of which are upregulated (red arrow) and 83 downregulated (blue arrow). 129Sv-SOD1G93A motor neurons show the specific alteration of 1101 genes, 46 of which are upregulated (red arrow) and 1055 downregulated (blue arrow). (B and C) DAVID enrichment analysis performed on transcripts specifically altered in C57-SOD1G93A motor neurons (n = 540 genes) and 129Sv-SOD1G93A motor neurons (n = 1101) at disease onset, identifies the most significant upregulated biological processes and the most significant downregulated biological processes in C57-SOD1G93A and 129Sv-SOD1G93A motor neurons, respectively. The significance of each gene cluster is evaluated through the enrichment score (EASE). An EASE ≥ 1.8 is equivalent to a non −log scale of 0.01.
Systems biology analysis on genes differentially expressed between motor stage neurons from the fast and slow progressor mouse strains at disease onset
The GeneGo comparative analysis (Metacore™) performed on the whole list of genes with altered expression from both transgenic mice at the onset of the disease (C57-SOD1G93A: 1194 genes; 129Sv-SOD1G93A: 1755 genes) identifies a greater number of active biological processes in C57-SOD1G93A motor neurons versus 129Sv-SOD1G93A motor neurons, which relate to the stress response (Supplementary Fig. 2). The GO categories, deriving from the ‘response to stress’ category (GO: 0006950), are apparent in the transcriptome profile of both transgenic mice [‘defence response’ (GO: 0006952 P-value: 1.27 × 10−44); ‘response to stimulus’ (GO: 0050896 P-value: 1.59 × 10−37); ‘response to wounding’ (GO: 0009611 P-value: 9.11 × 10⁻³⁴)]. However, for each of these categories, a large number of processes are specifically activated in the C57-SOD1G93A motor neurons (‘defence response’: 37; ‘response to wounding’: 37; ‘response to stimulus’: 29) (Supplementary Fig. 2).
Interestingly, GO biological processes underlying the ancestral category ‘regulation of immune system’ [‘immune system process’ (GO: 0002376 P-value: 1.21 × 10−39); ‘immune response’ (GO: 0006955 P-value: 3.17 × 10−46); ‘regulation of immune system process’ (GO: 0002682 P-value: 1.2 × 10⁻³²)] are significantly related to the motor neuron transcriptome of both transgenic mice (Supplementary Fig. 2). Again a higher number of biological processes are specifically linked to C57-SOD1G93A and not to 129Sv-SOD1G93A motor neurons. Thirty-six, 24 and 21 biological processes related to the ‘immune system process’, the ‘immune response’ and the ‘regulation of immune system process’, respectively are exclusively upregulated in C57-SOD1G93A motor neurons at disease onset.
To better discriminate the two transgenic mice strains, we independently analysed in DAVID the lists of transcripts specifically altered in C57-SOD1G93A (540 genes) and 129Sv-SOD1G93A (1101 genes) motor neurons at the onset of the disease (Fig. 2A). We performed functional annotation clustering (DAVID) to classify the principal enriched biological functions in C57-SOD1G93A and 129Sv-SOD1G93A motor neurons. This approach allows ranking of the biological importance of the annotation terms (GO annotations) on the basis of the degree of their co-association with differentially expressed genes (gene IDs), assigning an enrichment score (EASE) that represents a modified Fisher exact P-value, for gene-enrichment analysis (Huang et al., 2009). We selected as significant only functional gene clusters with an EASE ≥1.8 (equivalent to a non −log scale of 0.01). This allowed us to identify the main biological processes linked to the specific gene signature of motor neurons from the rapid and slow progressor mouse strains, respectively at disease onset (Fig. 2B and C).
Upregulated pathways in C57-SOD1G93A motor neurons at disease onset
Immune system processes in C57 motor neurons
The analysis of the ‘cytokine–cytokine receptor interaction’ Kyoto Encyclopedia of Genes and Genomes (KEGG) pathway, that accounts for 38 transcripts of C57-SOD1G93A motor neurons (P-value: 3.3 × 10⁻⁶) and 33 transcripts of 129Sv-SOD1G93A motor neurons (P-value: 9.5 × 10⁻²) (Supplementary Fig. 3A and Supplementary Data; Supplementary Table 2), reveals a more prominent immune reactivity/modulation in motor neurons from the slow progressor mouse strain. In particular, C57-SOD1G93A motor neurons show a higher upregulation of transcripts coding for monocyte/T cells chemoattractant proteins such as Ccl12 (Mcp-5 or MCP-1 related protein) (129Sv-SOD1G93A fold change = 2.5; C57-SOD1G93A fold change = 10.4), chemokine (C-X-C motif) ligand 10 (129Sv-SOD1G93A fold change = 5.6; C57-SOD1G93A fold change = 13.9), chemokine (C-X-C motif) ligand 16 (129Sv-SOD1G93A fold change = 2.8; C57-SOD1G93A fold change = 6.0) and chemokine (C-C motif) ligand 5 (129Sv-SOD1G93A fold change = −1.2; C57 fold change = 8.6) whereas 129Sv motor neurons exhibit a stronger upregulation of cardiotrophin-like cytokine factor 1 (129Sv-SOD1G93A fold change = 5.3; C57-SOD1G93A fold change = 3.4) and chemokine (C-X-C motif) ligand 13, (129Sv-SOD1G93A fold change = 125.8; C57-SOD1G93A fold change = 5.2) involved in maturation and recruitment of B cells, respectively (Senaldi et al., 1999; Krumbholz et al., 2006). In addition, C57-SOD1G93A motor neurons exhibit a greater upregulation of different receptors for specific cytokines involved in inflammatory (interleukin 6 receptor alpha; Fas-TNF receptor superfamily member 6; tumour necrosis factor receptor superfamily member 1a and 1b) as well as anti-inflammatory/neuroprotective (colony stimulating factor 1 receptor; colony stimulating factor 2 receptor beta; interleukin 2 receptor gamma chain; transforming growth factor beta receptor I and II; interleukin 10 receptor beta) processes.
The systems biology analysis performed through MetacoreTM reveals oncostatin M signalling through JAK-STAT as the most significant cytokine-related ‘canonical pathway’ activated in both transgenic mouse strains at the stage of disease onset (Supplementary Fig. 4). This system is specifically inhibited by the suppressor of cytokines 3 (Socs3), which is more upregulated in 129Sv-SOD1G93A (fold change = 9.2) than in C57-SOD1G93A (fold change = 5.7) mice. Consistently, oncostatin M receptor (Osmr) shows a higher expression in C57-SOD1G93A (fold change = 7.2) versus 129Sv-SOD1G93A (fold change = 3.2) motor neurons. Motor neurons from both strains upregulate signal transducer and activator of transcription 3 (Stat3) with a fold change = 2.0 whereas only C57-SOD1G93A motor neurons upregulate signal transducer and activator of transcription 1 (Stat1; fold change = 1.6). The activity of oncostatin M on motor neurons influences the expression pattern of the serine protease inhibitor A3N (Serpina3n), tissue inhibitor of metalloproteases 1 (Timp1) and Mcp-5 that are all more upregulated in the C57-SOD1G93A motor neurons (Fig. 3 and Table 1).
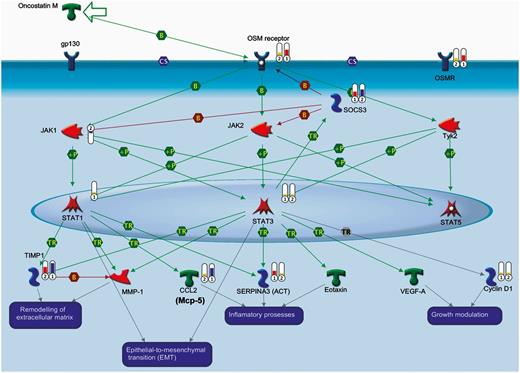
Oncostatin M signalling through the JAK-STAT pathway in C57-SOD1G93A and 129SV-SOD1G93A motor neurons at disease onset. Binding of oncostatin M to OSM receptor (OSMR) induces the Janus kinases (JAK)/signal transducer (JAK1, JAK2, Tyk2) and activation through phosphorylation, of transcription (STAT) signalling pathway (STAT1, STAT3, STAT5). Phosphorylated STATs then dimerize, translocate to the nucleus, bind to regulatory elements in the promoter of OSM-responsive genes and induce gene expression. MetacoreTM comparison analysis between the two transgenic mice at disease onset shows that: (i) OSM receptor is over-expressed in C57-SOD1G93A motor neurons; (ii) SOCS3, which is an inhibitor of oncostatin M signals, is over-expressed in 129Sv-SOD1G93A motor neurons; and (iii) the specific activation of STAT1 in C57-SOD1G93A motor neurons may account for higher levels of expression of SERPINA3 (Serpina3n), CCL2 (Mcp-5) and TIMP-1 (Timp1). Experimental data are visualized on the maps as thermometer-like symbols (1 = C57-SOD1G93A mice; 2 = 129SV-SOD1G93A mice). Upward thermometers indicate upregulated signals as indicated by the following fold-change ranges: 1–4 = orange; 4–8 = red; 8–13 = purple. Downward (blue) thermometers indicate downregulated expression levels of the genes. CS = complex subunit; B = binding; TR = transcription regulation; +P = phosphorylation; green arrow indicates activation; red arrow indicates inhibition.
Transcripts involved in the onscostatin M pathway altered in C57-SOD1G93A and 129Sv-SOD1G93A motor neurons at disease onset
| Probe set ID | Gene name | Gene symbol | Q-value C57 | Fold change C57 | Q-value 129Sv | Fold change 129Sv |
|---|---|---|---|---|---|---|
| 1418674_at | Oncostatin M receptor | Osmr | 1.14 × 10⁻¹⁶ | 7.2 | 1.28 × 10⁻⁷ | 3.2 |
| 1416576_at | Suppressor of cytokine signaling 3 | Socs3 | 1.54 × 10⁻¹³ | 5.7 | 3.9 × 10⁻¹¹ | 9.2 |
| 1433803_at | Janus kinase 1 | Jak1 | n.s. | n.c. | 0.0051 | −1.7 |
| 1459961_a_at | Signal transducer and activator of transcription 3 | Stat3 | 0.0025 | 2.0 | 0.0015 | 1.9 |
| 1450034_at | Signal transducer and activator of transcription 1 | Stat1 | 0.00015 | 1.6 | n.s. | n.c. |
| 1460227_at | Tissue inhibitor of metalloproteinase 1 | Timp1 | 1.00 × 10⁻²⁴ | 13.0 | 4.44 × 10⁻¹² | 7.8 |
| 1419282_at | Chemokine (C-C motif) ligand 12 | CcL2 (Ccl12) | 6.38 × 10⁻⁸ | 10.4 | 0.0035 | 2.5 |
| 1419100_at | Serine (or cysteine) peptidase inhibitor, clade A, member 3n | Serpina3n | 8.17 × 10⁻¹² | 5.2 | 0.0066 | 1.8 |
| 1448698_at | Cyclin D1 | Ccnd1 | 0.0017 | 1.6 | 0.005 | 1.5 |
(Q-value) Multiple hypothesis testing = Q-val[i] = mean (1-PPLR[1:i] where PPLR is the probability of positive log ratio (F.C.) Fold change = expressed as mean fold change ratio between four SOD1G93A versus four non-transgenic mice; n.s. = not significant; n.c. = not classified.
Complement pathway
Functional annotation clustering performed on 540 genes specifically altered in C57-SOD1G93A motor neurons at disease onset identified eight gene clusters with EASE >1.8 (Fig. 2B). Amongst these the ‘immune response’ gene cluster (GO: 0006955) represents one of the most significantly upregulated biological processes (EASE: 3.3), with 32 immune transcripts specifically altered in C57-SOD1G93A motor neurons (Supplementary Table 3). In particular, several subunits related to the complement pathway such as complement component 3 (C3) and complement component factor H (Cfh) are upregulated. In line with these observations, the analysis of the ‘canonical pathways’ (MetacoreTM) identifies the ‘classical complement pathway’ more significantly related to the C57-SOD1G93A compared with the 129Sv-SOD1G93A gene data set (Supplementary Fig. 4). C57-SOD1G93A motor neurons strongly upregulate complement components such as C3 and complement component 4B (C4b) (Fig. 4A; Supplementary Fig. 5 and Supplementary Table 4), but appear to finely regulate complement activation at different levels through the specific upregulation of C1-inhibitor (Serping1, fold change = 3.3) and Cfh (fold change = 1.9). C1-inhibitor forms a proteolytically inactive stoichiometric complex with the C1r or C1s proteases whereas Cfh functions as a cofactor in the inactivation of C3b by factor I and also increases the rate of dissociation of the C3 convertase and the (C3b)NBB complex (C5 convertase) in the alternative complement pathway (Rus et al., 2005).
![Analysis of C3 and C3 activated by-products at disease onset. (A) C3 messenger RNA levels are specifically increased in the C57-SOD1G93A motor neurons (fold change = 3.8). Messenger RNA levels are reported as mean fold-change ratio [± standard error (SE)] between SOD1G93A (n = 4) and non-transgenic (n = 4) mice in C57-SOD1G93A and 129Sv-SOD1G93A motor neurons (dotted line defines the fold-change of 1.5). Q-values were generated from PPLR using the following formula: Q-val[i] = mean (1 − PPLR[1:i]); *Q-value ≤ 0.01; ns = not significant. (B) Immunohistochemical comparison, performed at disease onset on lumbar spinal cord of C57-SOD1G93A, 129Sv-SOD1G93A and non-transgenic littermates (C3 = red; neurotrace = green) showing: (i) the expression of C3 by motor neurons; (ii) higher basal levels of C3 in C57-Ntg compared with 129sv-Ntg mice; and (iii) the induction of C3 within C57-SOD1G93A motor neurons. Scale bar = 50 µm. (C) C3 western blot analysis on longitudinally dissected lumbar ventral spinal cord protein extracts from C57-SOD1G93A, 129Sv-SOD1G93A and non-transgenic littermates at disease onset. Immunoreactivity was normalized to the actual amount of proteins loaded on the membrane as detected after Red Ponceau (Fluka). Densitometric analysis of C3 levels further confirms the immunohistochemical findings. The graph represent the mean ± SE of four mice per group. Two-way statistical analysis shows significant interaction (F = 10.63) due to genotype (non-transgenic: G93A − F = 81.65) and strain (129Sv: C57 − F = 10.64) (Tukey’s post hoc **P < 0.01; ****P < 0.0001). (D) Immunohistochemical comparison performed at disease onset on lumbar spinal cord of C57-SOD1G93A, 129Sv-SOD1G93A and non-transgenic littermates, showing an induction of C3 activated fragments (C3a/C3b/iC3b/C3c) within C57-SOD1G93A motor neurons at disease onset. Scale bar = 50 µm.](https://oup.silverchair-cdn.com/oup/backfile/Content_public/Journal/brain/136/11/10.1093_brain_awt250/2/m_awt250f4p.jpeg?Expires=1716325030&Signature=w0NAVDiZI~lcmNm9bcdi2o1HPwnUm6Kun7EE7CO8d04LGBwtpqS~RLLvCHWZSz9FsAJDEjOjHDo76YjAvO5JTkqXz2RdXHlYKR4IQZ~Qpo4YXv5le4meVoVK3dyRElqxUlPWrvx48V3wa8saQhUfkOi3ZwNeLIlawg7YwM8Lkn~Brv0p4vZ9aQ4gMS4v73MMZO5O53yj8hk85pcbyoRpiF3dwo4hHW2nVzE7-J2TsCopWTBEphmSyR2MXq1vK4HrSNxHidca78jwjqs58aoEdetHUFD2sK4-XV2d5aZIa8BQ3zrYMag53zU0D-2Wrb7WOThwMuGmmA-VqcXOLcNKYg__&Key-Pair-Id=APKAIE5G5CRDK6RD3PGA)
Analysis of C3 and C3 activated by-products at disease onset. (A) C3 messenger RNA levels are specifically increased in the C57-SOD1G93A motor neurons (fold change = 3.8). Messenger RNA levels are reported as mean fold-change ratio [± standard error (SE)] between SOD1G93A (n = 4) and non-transgenic (n = 4) mice in C57-SOD1G93A and 129Sv-SOD1G93A motor neurons (dotted line defines the fold-change of 1.5). Q-values were generated from PPLR using the following formula: Q-val[i] = mean (1 − PPLR[1:i]); *Q-value ≤ 0.01; ns = not significant. (B) Immunohistochemical comparison, performed at disease onset on lumbar spinal cord of C57-SOD1G93A, 129Sv-SOD1G93A and non-transgenic littermates (C3 = red; neurotrace = green) showing: (i) the expression of C3 by motor neurons; (ii) higher basal levels of C3 in C57-Ntg compared with 129sv-Ntg mice; and (iii) the induction of C3 within C57-SOD1G93A motor neurons. Scale bar = 50 µm. (C) C3 western blot analysis on longitudinally dissected lumbar ventral spinal cord protein extracts from C57-SOD1G93A, 129Sv-SOD1G93A and non-transgenic littermates at disease onset. Immunoreactivity was normalized to the actual amount of proteins loaded on the membrane as detected after Red Ponceau (Fluka). Densitometric analysis of C3 levels further confirms the immunohistochemical findings. The graph represent the mean ± SE of four mice per group. Two-way statistical analysis shows significant interaction (F = 10.63) due to genotype (non-transgenic: G93A − F = 81.65) and strain (129Sv: C57 − F = 10.64) (Tukey’s post hoc **P < 0.01; ****P < 0.0001). (D) Immunohistochemical comparison performed at disease onset on lumbar spinal cord of C57-SOD1G93A, 129Sv-SOD1G93A and non-transgenic littermates, showing an induction of C3 activated fragments (C3a/C3b/iC3b/C3c) within C57-SOD1G93A motor neurons at disease onset. Scale bar = 50 µm.
The specific upregulation of messenger RNA for C3 in C57-SOD1G93A motor neurons implies an increase in the expression of the C3 subunit and activated C3 downstream components (C3a, C3b, C3ib, C3c, C3dg). We confirmed this at protein level by immunohistochemical analysis of the lumbar spinal cord from both transgenic and age-matched control animals which demonstrate greater levels of C3 and C3 activated by-products in C57-SOD1G93A compared to 129Sv-SOD1G93A motor neurons (Fig. 4B and D). The increase of C3 in C57-SOD1G93A motor neurons was further validated through immunoblot analysis of enriched motor neuron fractions (longitudinal dissected ventral horns) from both transgenic mouse strains and their non-transgenic littermates (Fig. 4C).
Major histocompatibility complex I
The microarray data show that C57-SOD1G93A motor neurons display more pronounced upregulation messenger RNAs encoding multiple surface antigens normally exposed on the cell membranes of haematopoietic stem cells and/or mature leucocytes and monocytes (Cd22; Cd86; Cd44; Ncam1) (Supplementary Table 5). Most importantly, motor neurons for the slow progressing mouse strain specifically overexpress different class Ia components of the MHCI (Supplementary Table 3) and also show greater levels of beta-2 microglobulin (β2m; 129Sv-SOD1G93A fold change = 1.5, Q-value: 0.000496; C57-SOD1G93A fold change = 2.3 Q-value: 3.0 × 10⁻⁶) and antigen peptide transporter 1 (Tap1; 129Sv-SOD1G93A fold change = 1.5, Q-value: 0.00108; C57-SOD1G93A fold change = 2.6; Q-value: 7.0 × 10⁻⁶). Consistent with these findings, two immunoproteasome subunits normally involved in antigen processing and presentation through the MHCI complex (Muchamuel et al., 2009; de Graaf et al., 2011), large multifunctional peptidase 7 (Lmp7; fold change = 4.5, Q-value: 0.000118) and proteasome activator complex subunit 1 (Psme1; fold change = 2.4, Q-value: 4.1 × 10⁻⁸), are upregulated specifically in C57-SOD1G93A motor neurons (Fig. 5A–C and Supplementary Table 3). MHCI protein expression was analysed in the lumbar spinal cord of both transgenic mouse strains at the onset of the disease. Notably, although a clear signal of MHCI-immunoreactivity was detected in microglia and oligodendrocytes (Supplementary Fig. 6A–D), the motor neuron cell bodies were weakly immunolabelled (Fig. 5D–G). However, we were able to identify clear MHCI-immunoreactivity in cultured motor neurons from C57-SOD1G93A mice that appear to overexpress MHCI compared to motor neurons from non-transgenic littermates (Supplementary Fig. 7). As it has been recently demonstrated that MHCI molecules produced in motor neuron somata are transported peripherally into motor axons (Medana et al., 2001; Ishii and Mombaerts, 2008; Taylor et al., 2009; Thams et al., 2009), we analysed the sciatic nerves of both SOD1G93A mouse strains and their respective non-transgenic littermates and demonstrated an increase of MHCI immunoreactivity in the sciatic nerve of C57-SOD1G93A mice compared with non-transgenic controls and 129Sv-SOD1G93A mice (Fig. 5H–O). In particular, MHCI-immunoreactivity was observed in a subpopulation of axons co-labelled with the axonal marker Smi31 in the sciatic nerve of C57-SOD1G93A mice (Fig. 5P and Q). In order to verify that MHCI was confined to the motor axons in the sciatic nerves, we evaluated its expression in the sciatic nerve of B6.Cg-Tg(Hlxb9-GFP) mice with or without the SOD1G93A transgene. These mice that express GFP under the direction of the mouse Hlxb9 promoter display selective production of GFP in dendrites, axons and somata of spinal motor neurons. These results confirm the specific localization and high expression of MHCI in sciatic GFP labelled-motor axons of GFP-SPM transgenic mice (Fig. 5R and S; Supplementary Fig. 8A–N). We next studied MHCI-immunoreactivity at the neuromuscular junctions of gastrocnemius muscles of transgenic and non-transgenic mice from both genetic backgrounds at the onset of the disease. The presynaptic motor terminals were stained with synaptophysin and the postsynaptic acetylcholine receptor clusters were visualized with alpha-bungarotoxin (α-btx). As for the sciatic nerve, greater levels of MHCI-immunoreactivity were observed at the neuromuscular junctions of C57-SOD1G93A mice compared with the 129Sv-SOD1G93A strain (Fig. 5T).
![Analysis of MHCI expression at disease onset. (A–C) MhcI (A), Lmp7 (B) and Psme1 (C) messenger RNA levels are specifically increased within C57-SOD1G93A motor neurons (MhcI, fold change = 2.5; Lmp7, fold change = 4.5; Psme1, fold change = 2.7). Messenger RNA levels are expressed as mean fold-change ratio (±SE) between SOD1G93A (n = 4) and non-transgenic (n = 4) mice, in C57-SOD1G93A and 129Sv-SOD1G93A mice (dotted lines defines the fold-change of 1.5). Q-values were generated from PPLR using the following formula: Q-val[i] = mean (1 − PPLR[1:i]); *Q-value ≤ 0.01; ns = not significant. (D–G) Confocal micrographs from the ventral lumbar spinal cord of C57-SOD1G93A, 129Sv SOD1G93A and non-transgenic littermates at disease onset illustrating: (i) the activation of MHCI (green) in both transgenic mice strain at disease onset; and (ii) low MHCI immunoreactivity within motor neuron perikarya. Neurotrace = red. Scale bar = 50 µm. (H–O) Confocal micrographs from the sciatic nerve of C57-SOD1G93A, 129Sv-SOD1G93A and non-transgenic littermate mice showing higher MHCI levels (green) in the sciatic nerve of C57-SOD1G93A mice at disease onset. Smi31 (red) putative motor axons. Scale bar = 50 µm. (P and Q) Sciatic nerve magnification from both C57-NTg and C57-SOD1G93A mice at disease onset illustrating MCHI (green) activation and co-localization with Smi31 (red) in axons from the diseased mice. Scale bar = 50 µm. (R and S) Sciatic nerve magnification from B6.Cg-Tg(Hlxb9-GFP)-SOD1G93A mice and non-transgenic littermates at disease onset showing the co-localization of GFP (green, exclusively expressed by motor axons), with MHCI (red) in the diseased mice. Scale bar = 50 µm. (T) Confocal micrographs of neuromuscular junctions from C57-SOD1G93A, 129Sv-SOD1G93A and non-transgenic littermates at disease onset showing the co-localization of synaptophysin (blue, presynaptic marker), MHCI (green) and α-bungarotoxin (α-btx, red, postsynaptic marker) in the gastrocnemius muscle specifically in the C57-SOD1G93A mice.](https://oup.silverchair-cdn.com/oup/backfile/Content_public/Journal/brain/136/11/10.1093_brain_awt250/2/m_awt250f5p.jpeg?Expires=1716325030&Signature=eDfBSg4pLYW8gMiR2hDJGpoAQ8llD3JRdW2YC9meGr7-C-yoApEio7UVTOApDvFVHehaG1wBZlm8kquflngQ277a8XtxV~LFlLWrfMr2aDJaeuQJLHRAe9SQtWOdyf95hOYJKSkJt1GML4DV~3dYUDm6Em-YAokn0IXfeeu6AfXz7jzg-ppFondVxC4GWxhlkiJl7Y8WNtXriAX6xGrJmaakJdCTEL2e~AubMFHRNfrrtlHykkQn-pZjDP8qTlRfb2~WkFa2Bufn7Rhx~2kIvw2mGHB0ueWUipWCNAe6m6IB5epfNqfUOFdyZowm6HTOuqYNwhbNQ7banbUxtQglMQ__&Key-Pair-Id=APKAIE5G5CRDK6RD3PGA)
Analysis of MHCI expression at disease onset. (A–C) MhcI (A), Lmp7 (B) and Psme1 (C) messenger RNA levels are specifically increased within C57-SOD1G93A motor neurons (MhcI, fold change = 2.5; Lmp7, fold change = 4.5; Psme1, fold change = 2.7). Messenger RNA levels are expressed as mean fold-change ratio (±SE) between SOD1G93A (n = 4) and non-transgenic (n = 4) mice, in C57-SOD1G93A and 129Sv-SOD1G93A mice (dotted lines defines the fold-change of 1.5). Q-values were generated from PPLR using the following formula: Q-val[i] = mean (1 − PPLR[1:i]); *Q-value ≤ 0.01; ns = not significant. (D–G) Confocal micrographs from the ventral lumbar spinal cord of C57-SOD1G93A, 129Sv SOD1G93A and non-transgenic littermates at disease onset illustrating: (i) the activation of MHCI (green) in both transgenic mice strain at disease onset; and (ii) low MHCI immunoreactivity within motor neuron perikarya. Neurotrace = red. Scale bar = 50 µm. (H–O) Confocal micrographs from the sciatic nerve of C57-SOD1G93A, 129Sv-SOD1G93A and non-transgenic littermate mice showing higher MHCI levels (green) in the sciatic nerve of C57-SOD1G93A mice at disease onset. Smi31 (red) putative motor axons. Scale bar = 50 µm. (P and Q) Sciatic nerve magnification from both C57-NTg and C57-SOD1G93A mice at disease onset illustrating MCHI (green) activation and co-localization with Smi31 (red) in axons from the diseased mice. Scale bar = 50 µm. (R and S) Sciatic nerve magnification from B6.Cg-Tg(Hlxb9-GFP)-SOD1G93A mice and non-transgenic littermates at disease onset showing the co-localization of GFP (green, exclusively expressed by motor axons), with MHCI (red) in the diseased mice. Scale bar = 50 µm. (T) Confocal micrographs of neuromuscular junctions from C57-SOD1G93A, 129Sv-SOD1G93A and non-transgenic littermates at disease onset showing the co-localization of synaptophysin (blue, presynaptic marker), MHCI (green) and α-bungarotoxin (α-btx, red, postsynaptic marker) in the gastrocnemius muscle specifically in the C57-SOD1G93A mice.
Angiogenin like-activity
Other clusters of transcripts specifically upregulated in C57-SOD1G93A compared with 129Sv-SOD1G93A motor neurons are those involved in extracellular matrix remodelling, endocytosis and lysosome activity (Fig. 2B). Amongst these categories, the most significant is the ‘blood vessel development’ functional category (EASE: 4.9). The 2D view map representing the internal relationships among the clustered terms and genes in this category is shown in Supplementary Fig. 9. Of the 22 genes belonging to this category, 21 are upregulated whereas one (fibroblast growth factor 18) is downregulated (Supplementary Table 6). Within the gene cluster it is possible to identify a subcategory of 12 transcripts involved in angiogenesis. Some of these genes (transforming growth factor receptor 1 and 2, Ang, angiopoietin 1) belong to the class of angioneurins, molecules that affect both neural and vascular cell functions (Zacchigna et al., 2008).
In addition, the upregulation of the hypoxia inducible factor 1a is specifically related to the activation of vascular endothelial growth factor and Ang through the binding to a hypoxia-response element in the promoter of their genes. In the light of recent findings demonstrating that ANG, a 14 kDa angiogenic ribonuclease, promotes motor neuron survival and has a beneficial effect on the disease course of SOD1G93A mice (Kieran et al., 2008; Sebastià et al., 2009; Li and Hu, 2010), we further investigated the expression level of Ang in the two transgenic mice strains. Ang messenger RNA that was initially reduced in both transgenic mouse strains at the presymptomatic stage (data not shown), dramatically increased in the C57-SOD1G93A but not in 129Sv-SOD1G93A mice at the onset of the disease (Fig. 6A) and remained high during disease progression (data not shown). Immunohistochemical analysis performed at disease onset on the lumbar spinal cord of both transgenic mice and non-transgenic littermates, (Fig. 6B) clearly demonstrated that: (i) ANG immunoreactivity appears mostly confined to motor neurons in non-transgenic mice, but its intensity level is remarkably lower in 129Sv-SOD1G93A versus C57-SOD1G93A non-transgenic mice; and (ii) at disease onset ANG immunoreactivity appears highly expressed in structures surrounding the motor neurons in C57 mice whereas an overall reduction of immunoreactivity is observed in 129Sv-SOD1G93A mice compared to their non-transgenic littermates. In contrast with messenger RNA expression, ANG immunoreactivity does not appear upregulated in the motor neurons of C57-SOD1G93A mice in comparison with non-transgenic littermates whereas it was clearly decreased in the 129Sv-SOD1G93A motor neurons compared with their non-transgenic littermates. These observations were confirmed by immunoblot analysis of the ventral horn from lumbar spinal cords performed at the same disease stage (Fig. 6C and D).
![Analysis of ANG expression at disease onset. (A) Ang messenger RNA levels are specifically increased in the C57-SOD1G93A motor neurons (fold change = 4.7). Messenger RNA levels are reported as mean fold change ratio (±SE) between SOD1G93A (n = 4) and non-transgenic (n = 4) mice, in 129Sv-SOD1G93A and C57-SOD1G93A motor neurons (dotted line defines the fold-change of 1.5). Q-values were generated from PPLR using the following formula: Q-val[i] = mean (1 − PPLR[1:i]); *Q-value ≤ 0.01; ns = not significant. (B) Immunohistochemical comparison, performed at disease onset on lumbar spinal cord of C57-SOD1G93A, 129Sv-SOD1G93A, and non-transgenic littermates, showing: (i) the predominant expression of ANG by motor neurons; (ii) lower ANG basal levels in 129Sv-Ntg versus C57-Ntg mice; and (iii) reduction in ANG expression in 129Sv-SOD1G93A motor neurons at disease onset. Scale bar = 50 µm. (C) ANG slot-blot analysis on longitudinally dissected lumbar ventral spinal cord protein extracts from C57-SOD1G93A, 129Sv-SOD1G93A and non-transgenic littermates at disease onset. Immunoreactivity was normalized to the actual amount of proteins loaded on the membrane, as detected after Red Ponceau (Fluka). (D) Densitometric analysis of ANG levels confirms the immunohistochemical findings. Data are reported as mean ± SE of four mice per group. Two-way statistical analysis shows the effect of strain (129Sv; C57 − F = 41.59) and the genotype (non-transgenic; G93A − F = 9.81) on the overall variability. Tukey’s post hoc *P < 0.05; **P < 0.01; ***P < 0. 001.](https://oup.silverchair-cdn.com/oup/backfile/Content_public/Journal/brain/136/11/10.1093_brain_awt250/2/m_awt250f6p.jpeg?Expires=1716325030&Signature=iQ4s2kh1flHAUdlgvCfJPxR8nt3XUxGHSDlqEym7hV3U~I9Zh2dfrZ2VTlYrfp41AN04OnXGfNPvRfuaPpRMOMQV51fW~w5sNQE3wbMgGddOymFynSQi7tE9DINNFs157Ogcq9SMm93eecAYMxK81bKAanDmAvj~NdVpahuGDR8j5jtWI7QuxiqyELECCgEaIVU32FWmdIfmikmibewUrMgUmGhDldlE9PlpOH2J~1hmWIhWIkK4szMEn~E6nahksygPMLM9kJdX9B1faFDRHEZpOOmaZmdF9zydF1w3QW07bRSNobxLTd~dKQxXxJOo4l3tq940zOUkjkI1xblZ7g__&Key-Pair-Id=APKAIE5G5CRDK6RD3PGA)
Analysis of ANG expression at disease onset. (A) Ang messenger RNA levels are specifically increased in the C57-SOD1G93A motor neurons (fold change = 4.7). Messenger RNA levels are reported as mean fold change ratio (±SE) between SOD1G93A (n = 4) and non-transgenic (n = 4) mice, in 129Sv-SOD1G93A and C57-SOD1G93A motor neurons (dotted line defines the fold-change of 1.5). Q-values were generated from PPLR using the following formula: Q-val[i] = mean (1 − PPLR[1:i]); *Q-value ≤ 0.01; ns = not significant. (B) Immunohistochemical comparison, performed at disease onset on lumbar spinal cord of C57-SOD1G93A, 129Sv-SOD1G93A, and non-transgenic littermates, showing: (i) the predominant expression of ANG by motor neurons; (ii) lower ANG basal levels in 129Sv-Ntg versus C57-Ntg mice; and (iii) reduction in ANG expression in 129Sv-SOD1G93A motor neurons at disease onset. Scale bar = 50 µm. (C) ANG slot-blot analysis on longitudinally dissected lumbar ventral spinal cord protein extracts from C57-SOD1G93A, 129Sv-SOD1G93A and non-transgenic littermates at disease onset. Immunoreactivity was normalized to the actual amount of proteins loaded on the membrane, as detected after Red Ponceau (Fluka). (D) Densitometric analysis of ANG levels confirms the immunohistochemical findings. Data are reported as mean ± SE of four mice per group. Two-way statistical analysis shows the effect of strain (129Sv; C57 − F = 41.59) and the genotype (non-transgenic; G93A − F = 9.81) on the overall variability. Tukey’s post hoc *P < 0.05; **P < 0.01; ***P < 0. 001.
Downregulated mechanisms in 129Sv-SOD1G93A motor neurons at disease onset
Functional annotation clustering performed on 1101 genes specifically altered in 129Sv-SOD1G93A motor neurons at disease onset identified six gene clusters with an EASE >1.8, showing marked downregulation (Fig. 2C).
Mitochondrial transcripts and energy metabolism
The most striking cluster of genes encompassing transcripts that are strikingly downregulated in 129Sv-SOD1G93A motor neurons at disease onset compared to C57-SOD1G93A motor neurons is related to mitochondrial activity. The GO enrichment analysis performed through DAVID on transcripts differentially expressed between 129Sv-SOD1G93A and non-transgenic littermates identified as the most significant the mitochondrion gene cluster (GO: 0005739; EASE: 29.3). Of the 191 genes within this category, 187 are downregulated (Supplementary Table 7).
Notably, dihydrolipoamide S-acetyltransferase (E2; fold change = −1.7, Q-value: 0.000016) and dihydrolipoamide dehydrogenase (E3; fold change = −1.6, Q-value: 0.0062) pyruvate dehydrogenase subunits are downregulated. The predicted impairment of pyruvate metabolism is inline with a widespread dysregulation of key enzyme subunits involved in the normal function of the citric acid cycle and the electronic transport chain (oxidative phosphorylation KEGG pathway; P-value: 2.0 × 10⁻²¹). Among the electronic transport chain complexes, NADH dehydrogenases (complex I) and ATP synthase are the most compromised with altered expression of 23 and seven subunits, respectively (Supplementary Fig. 10 and Supplementary Table 8). The predicted impairment in ATP production is likely to be further exacerbated by the downregulation of creatine kinasemt, an enzyme that produces phosphocreatine from mitochondrially-generated ATP (Wallimann et al., 1992). On the basis of these alterations in gene expression, we measured complex I activity and the ATP concentration (nmol/mg) directly in tissue, confirming a marked decrease in energy production in the ventral portion of the lumbar spinal cord of 129Sv-SOD1G93A motor neurons compared with C57-SOD1G93A (Supplementary Fig. 11A–C). The mitochondrial dysregulation is further confirmed by the downregulation of 22 mitochondrial ribosomal subunits (Supplementary Table 8) and the upregulation of the uncoupling protein 2, a key marker of mitochondrial stress (fold change = 3.0, Q-value: 0.000239) (Mills et al., 2002; Serviddio et al., 2008).
Ubiquitin proteasome system
The ‘protein catabolic process’ represents the second significant gene cluster (GO: 0030163; EASE: 5.2) specifically downregulated in motor neurons from 129Sv mice at disease onset (Fig. 2C).
Twenty genes coding for E2 ubiquitin conjugating enzymes, E3 ubiquitin-protein ligase enzymes and adaptor proteins involved in the ubiquitin proteasome system show decreased expression in 129Sv-SOD1G93A motor neurons as illustrated in the KEGG pathway ‘ubiquitin mediate proteolysis’ (P-value: 4.5 × 10⁻²) (Supplementary Fig. 12 and Supplementary Table 9). Among them, ubiquitin-conjugating enzyme E2A, ubiquitin-conjugating enzyme E2N and PRP19/PSO4 pre-messenger RNA processing factor 19 homologue have a supplementary role in DNA repair (Ashley et al., 2002; Carninci et al., 2005; Karras and Jentsch, 2010). In addition, proteasome complex-associated transcripts including six subunits belonging to the 19S regulatory particle and eight subunits belonging to the 20S ‘core’ particle (proteasome KEGG pathway; P-value: 1.42 × 10⁻⁹), show decreased messenger RNA levels in the rapid progressor mouse strain (Supplementary Fig. 13 and Supplementary Table 10).
Notably, the deubiquitinases proteasome-associated enzyme, Ubiquitin C-terminal hydrolase 37 (Uch37) is downregulated in 129Sv motor neurons at disease onset (Fig. 7A). UCH37 is responsible for the ubiquitin isopeptidase activity in the PA700 (19S) proteasome regulatory complex which disassembles Lys 48-linked polyubiquitin specifically from the distal end of the chain promoting proteasomal protein degradation (Lee et al., 2011). Immunohistochemistry and immunoblot analysis of the ventral portion of lumbar spinal cord confirmed that Uch37 messenger RNA dysregulation correlates with downregulation of UCH37 protein expression in 129Sv-SOD1G93A motor neurons at disease onset (Fig. 7B–D).
![Analysis of UCH37 expression at disease onset. (A) Uch37 messenger RNA levels are specifically reduced in the 129Sv-SOD1G93A motor neurons. Messenger RNA levels are reported as mean fold-change ratio (±SE) between SOD1G93A (n = 4) and non-transgenic (n = 4) mice in 129Sv-SOD1G93A and C57-SOD1G93A motor neurons (dotted line defines the fold-change of −1.5). Q-values were generated from PPLR using the following formula: Q-val[i] = mean (1 − PPLR[1:i]); *Q-value ≤ 0.01; ns = not significant. (B) Immunohistochemical comparison performed at disease onset on lumbar spinal cord of C57-SOD1G93A, 129Sv-SOD1G93A and non-transgenic littermates showing: (i) the expression of UCH37 by motor neurons; and (ii) lower levels of UCH37 in motor neurons from 129Sv-SOD1G93A mice. Scale bar = 50 µm. (C) UCH37 western blot analysis on longitudinally dissected lumbar ventral spinal cord protein extracts from C57-SOD1G93A, 129Sv-SOD1G93A and non-transgenic littermates at disease onset. Immunoreactivity was normalized to the actual amount of protein loaded on the membrane as detected after Red Ponceau (Fluka). (D) Densitometric analysis of UCH37 levels confirms the immunohistochemical findings. Data are reported as mean ± SE of four mice per group. Two-way statistical analysis shows significant interaction (F int. = 12.92) due to strain (129Sv; C57 − F = 15.43) and genotype (non-transgenic; G93A − F = 0.70) Tukey’s post hoc **P < 0.01; ***P < 0.001.](https://oup.silverchair-cdn.com/oup/backfile/Content_public/Journal/brain/136/11/10.1093_brain_awt250/2/m_awt250f7p.jpeg?Expires=1716325030&Signature=NhudONL4kzpBUOD4gzrDH2iSBuFnbQWVlAr4D2PGEfKLQUblEuU2TpbUYXZu4nweR0piRRgmotizPxdsZz9jU-RCgtzXiH6ioHPXVLT74TJT~mc68k6zQNzYHZVXReYgFBodFhWFyevYfbJcRL9MV8UIKZ3o24aCgTxmiyb~N1mN5K3xisS2Vw947C5-IAvRKc5E2JeFbPZ~Qg93l0PUBJR46R0zvogp~mB0idrXXUy56x2S0HmeGrAdmWi1OEkSQB6WZFblvF3RT55qOYkcH9xrKU5KHauViJ8JX3KN~Iumz7Wxa2v2FJyRaCb6yTEw~pNghnZx~6Wbh5xpzs3pBQ__&Key-Pair-Id=APKAIE5G5CRDK6RD3PGA)
Analysis of UCH37 expression at disease onset. (A) Uch37 messenger RNA levels are specifically reduced in the 129Sv-SOD1G93A motor neurons. Messenger RNA levels are reported as mean fold-change ratio (±SE) between SOD1G93A (n = 4) and non-transgenic (n = 4) mice in 129Sv-SOD1G93A and C57-SOD1G93A motor neurons (dotted line defines the fold-change of −1.5). Q-values were generated from PPLR using the following formula: Q-val[i] = mean (1 − PPLR[1:i]); *Q-value ≤ 0.01; ns = not significant. (B) Immunohistochemical comparison performed at disease onset on lumbar spinal cord of C57-SOD1G93A, 129Sv-SOD1G93A and non-transgenic littermates showing: (i) the expression of UCH37 by motor neurons; and (ii) lower levels of UCH37 in motor neurons from 129Sv-SOD1G93A mice. Scale bar = 50 µm. (C) UCH37 western blot analysis on longitudinally dissected lumbar ventral spinal cord protein extracts from C57-SOD1G93A, 129Sv-SOD1G93A and non-transgenic littermates at disease onset. Immunoreactivity was normalized to the actual amount of protein loaded on the membrane as detected after Red Ponceau (Fluka). (D) Densitometric analysis of UCH37 levels confirms the immunohistochemical findings. Data are reported as mean ± SE of four mice per group. Two-way statistical analysis shows significant interaction (F int. = 12.92) due to strain (129Sv; C57 − F = 15.43) and genotype (non-transgenic; G93A − F = 0.70) Tukey’s post hoc **P < 0.01; ***P < 0.001.
Vesicle trafficking and protein transport
According to the DAVID analysis, the protein transport category represents the third most significantly altered gene functional cluster (GO: 0015031; EASE: 3.22) in 129Sv-SOD1G93A motor neurons at disease onset. There is widespread dysregulation of multiple soluble N-ethylmaleimide-sensitive factor attachment proteins (SNAREs) (YKT6 homologue, N-ethylmaleimide sensitive fusion protein attachment protein alpha, N-ethylmaleimide sensitive fusion protein attachment protein gamma, vesicle-associated membrane protein 7) as well as small GTPase Rab proteins (Ras-related protein Rab-2a, Ras-related protein Rab2b, Ras-related protein Rab11a) (Zerial and McBride, 2001; Jahn and Scheller, 2006; Sann et al., 2009; Jena et al., 2011). The activity of these molecules is principally implicated in the transport of vesicles between endoplasmic reticulum–Golgi, Golgi–endosome, early/late endosome-lysosome and Golgi-plasma membrane (Supplementary Fig. 14 and Supplementary Table 11). Notably, the vesicle-associated membrane protein-associated protein B and C, mutations in which are associated with human ALS, is downregulated (Chen et al., 2010). The level of this impairment extends to involve molecules important in organelle function such as the component of oligomeric Golgi complex 1 and component of oligomeric Golgi complex 8 that influence Golgi morphology and localization (Carninci et al., 2005; Chatterton et al., 1999) or vacuolar protein sorting 24 and chromatin modifying protein 2B that regulate endosome maturation. (Skibinski et al., 2005; Nickerson et al., 2006). Different components of the nuclear pore complex (importin 4, karyopherin alpha 1, transportin 2) are downregulated with all the implications that this may confer on the bidirectional communication between the nuclear and cytoplasmic compartments. Similarly, the activity of the respiratory chain is likely to be indirectly compromised through the dysregulation of different translocases of the inner mitochondrial (Tim) membrane (Timm10, Timm17, Timm23) and one translocase of the outer mitochondrial (Tom) membrane (Tomm7) involved in the import and insertion of multi-pass transmembrane proteins at the mitochondrial level.
Organization of neuronal projections
Neuron projection and microtubule categories represent, respectively, the fourth (GO: 0043005; EASE: 2.1) and the fifth (GO: 0005874; EASE: 1.8) gene clusters, in order of significance, related to 1101 transcripts specifically altered in 129Sv-SOD1G93A motor neurons at disease onset (Fig. 2C). Although represented as two independent categories, they show inter-dependency as microtubule stability has a fundamental role in the viability of motor axons.
Motor axon morphology and functionality are likely to be negatively influenced by the dysregulation of two tubulin subunits (tubulin alpha 4A; tubulin beta 2C) and several transcripts controlling microtubule polarization (microtubule-associated protein 1 A; microtubule-associated protein 9; tubulin polyglutamylase complex subunit 1) (Denarier et al., 1998; Nakayama et al., 2001; Regnard et al., 2003) and axonal/synapse stability and regeneration (stathmin-like 2; utrophin; cysteine-rich PDZ-binding protein) (Bhosle et al., 2006; Tararuk et al., 2006; Saro et al., 2007) (Supplementary Table 12). Interestingly, different transcripts involved in anterograde and retrograde axonal transport are specifically downregulated in 129Sv-SOD1G93A motor neurons. We found the decreased expression of two non-catalytic (dynein light chain Tctex-type 3; dynein, cytoplasmic 1 light intermediate chain 2) components involved in linking dynein 1 to cargos and to adapter proteins that regulate its function (Lo et al., 2007; Palmer et al., 2009). In addition, six kinesin heavy chain isoforms and one kinesin light chain isoform with heterogeneous activities within motor axons (microtubule turnover; mitochondrial and lysosome translocation; neurofilament transport) (Adalbert and Coleman, 2012; Millecamps and Julien, 2013) are downregulated Supplementary Table 12). We analysed the protein expression levels of kinesin heavy chain isoform 5a (Kif5a), 5b (Kif5b) and 5c (Kif5c) the activity of which in adult motor neurons was reported to be essential in maintaining normal cell homeostasis (Kanai et al., 2000; Xia et al., 2003; Cho et al., 2007). Immunoblot and immunohistochemical comparison, performed using an antibody specifically directed against the three heavy chain isoforms, further validate a marked downregulation of KIF5A, KIF5B and KIF5C in 129Sv-SOD1G93A motor neurons at disease onset (Fig. 8A–C).
![Analysis of KIF5A; KIF5B; KIF5C expression at disease onset. (A) Kif5a; Kif5b and Kif5c messenger RNA levels are specifically reduced in the 129Sv-SOD1G93A motor neurons (Kif5a, fold-change = −1.6; Kif5b, fold-change = −1.8; Kif5c, fold-change = −2.2). Messenger RNA levels are reported as mean fold-change ratio (±SE) between SOD1G93A (n = 4) and non-transgenic (n = 4) mice in 129Sv-SOD1G93A and C57-SOD1G93A motor neurons (dotted line defines the fold-change of −1.5). Q-values were generated from PPLR using the following formula: Q-val[i] = mean (1 − PPLR[1:i]); *Q-value ≤ 0.01; ns = not significant. (B) Immunohistochemical comparison performed at disease onset on lumbar spinal cord of C57-SOD1G93A, 129Sv-SOD1G93A and non-transgenic littermates showing: (i) the expression of KIF5A + B + C by motor neurons; and (ii) lower levels of the three proteins in motor neurons from 129Sv-SOD1G93A mice. Scale bar = 50 µm. (C and D) KIF A + B + C western blot analysis on longitudinally dissected lumbar ventral spinal cord protein extracts from C57-SOD1G93A, 129Sv-SOD1G93A, and non-transgenic littermates at disease onset. Immunoreactivity was normalized to β-actin. Densitometric analysis of KIF A + B + C levels confirm the immunohistochemical findings. Data are reported as the mean ± SE of four mice per group. Two-way statistical analysis shows significant interaction (F int. = 20.75) due to strain (129Sv; C57 − F = 44.41) and genotype (non-transgenic; G93A − F = 20.75). Tukey’s post hoc ***P < 0.001; ****P < 0.0001.](https://oup.silverchair-cdn.com/oup/backfile/Content_public/Journal/brain/136/11/10.1093_brain_awt250/2/m_awt250f8p.jpeg?Expires=1716325030&Signature=LwG6qXc905vv85B0WRO6ugvBo0HVygZyoq0N2rlvzbSNNf3iHu10ZY0qNMp0Ief3lxtYCaY8b5wwlroZKdttq5BLW09s~6pvO0JvKLjGPyWZm8UneKuyPIibNW7prXXVRXyp2vsq2uTyG-V63~EzJlM1TVonxPpkbmoleTlpWN5oWOEMPCV1Mw~sMU8JowOENA7BXai-W2LkjdmmOsZ~pCk5J-SyrwTAFubngolpAVL8ybAfFsTy6ptsbydKlWEU08ptxR3avHiK3Bqysehyw6tDq21BpR~WG6BzBfltqMvDfI3Now19XD2ptyhTrQGJOOiiRTx-B41Z~ckJGoSQTg__&Key-Pair-Id=APKAIE5G5CRDK6RD3PGA)
Analysis of KIF5A; KIF5B; KIF5C expression at disease onset. (A) Kif5a; Kif5b and Kif5c messenger RNA levels are specifically reduced in the 129Sv-SOD1G93A motor neurons (Kif5a, fold-change = −1.6; Kif5b, fold-change = −1.8; Kif5c, fold-change = −2.2). Messenger RNA levels are reported as mean fold-change ratio (±SE) between SOD1G93A (n = 4) and non-transgenic (n = 4) mice in 129Sv-SOD1G93A and C57-SOD1G93A motor neurons (dotted line defines the fold-change of −1.5). Q-values were generated from PPLR using the following formula: Q-val[i] = mean (1 − PPLR[1:i]); *Q-value ≤ 0.01; ns = not significant. (B) Immunohistochemical comparison performed at disease onset on lumbar spinal cord of C57-SOD1G93A, 129Sv-SOD1G93A and non-transgenic littermates showing: (i) the expression of KIF5A + B + C by motor neurons; and (ii) lower levels of the three proteins in motor neurons from 129Sv-SOD1G93A mice. Scale bar = 50 µm. (C and D) KIF A + B + C western blot analysis on longitudinally dissected lumbar ventral spinal cord protein extracts from C57-SOD1G93A, 129Sv-SOD1G93A, and non-transgenic littermates at disease onset. Immunoreactivity was normalized to β-actin. Densitometric analysis of KIF A + B + C levels confirm the immunohistochemical findings. Data are reported as the mean ± SE of four mice per group. Two-way statistical analysis shows significant interaction (F int. = 20.75) due to strain (129Sv; C57 − F = 44.41) and genotype (non-transgenic; G93A − F = 20.75). Tukey’s post hoc ***P < 0.001; ****P < 0.0001.
Overconnected transcription factors
The interactome topology performed on both whole transgenic mice data sets at the onset of the disease show a clustering coefficient (density of connections) of 0.06 for C57-SOD1G93A versus 0.04 for 129Sv-SOD1G93A highlighting a lower molecular complexity of the 129Sv-SOD1G93A gene network (Supplementary Table 13). The ‘interactome tool’ in MetacoreTM allows estimation of the interconnectedness of elements of the experimental data set (density of interactions), finding statistically significant interactions in the set and enrichment of the data set with protein classes. In particular, this tool allows the identification of statistically significant data objects that interact with and regulate other proteins, representing potential disease and process biomarkers. We used this application to identify over-connected transcription factors within the gene profiles of the two transgenic mouse strains. Over-connected transcription factors have a number of interactions more than (or equal to) the mean (mathematical expectation) and a Z-score ≥ 0. A false discovery rate (FDR) ≤ 0.05 was selected as threshold in order to reject false positives and data objects of doubtful significance.
The analysis showed a greater number of over-connected transcription factors in the C57-SOD1G93A than in the 129Sv-SOD1G93A data set (Table 2). Notably, the number of interactions of common transcription factors is greater within the C57-SOD1G93A network: STAT3 and tripartite motif-containing protein 14 (PU.1) significantly interacts with 88 and 95 active network objects, respectively versus 76 and 79 in the 129Sv-SOD1G93A network. Among the over-connected transcription factors, we analysed the protein expression of activating transcription factor 3 (Atf3) and Nrf2 as representative markers of neuronal regenerative/injury response. In particular, ATF3 levels of expression are directly proportional to the degree of ubiquitin protein aggregation inside motor neurons (Tsujino et al., 2000; Vlug et al., 2005). According to our microarray data, Atf3 messenger RNA levels are consistently higher in 129Sv-SOD1G93A versus C57-SOD1G93A motor neurons at the presymptomatic stage [C57-SOD1G93A, fold change = 1.1; Q-value: 0.3 (not significant); 129Sv-SOD1G93A, fold change = 11.7, Q-value: 6.67 × 10⁻¹⁶] and disease onset (C57-SOD1G93A, fold change = 9.8; Q-value: 7.84 × 10⁻¹¹; 129Sv-SOD1G93A, fold change = 29.8; Q-value: 1.00 × 10⁻²⁴) (Fig. 9 A). Immunohistochemistry and immunoblot analysis (Fig. 9B–D) reveal: (i) a significant difference in the basal levels of ATF3, that is more expressed in C57 than 129Sv motor neurons; (ii) a significant upregulation of ATF3 in 129Sv-SOD1G93A motor neurons versus non-transgenic littermates that accounts for the huge difference in messenger RNA levels (G93A/non-transgenic ratio) between the two mice strains at the onset of the disease; and (iii) no significant variation in ATF-3 protein levels in C57-SOD1G93A mice versus non-transgenic littermates.
![Analysis of ATF3 expression at disease onset. (A) Atf3 messenger RNA levels are consistently higher in the 129Sv-SOD1G93A (fold-change = 29.8) versus C57-SOD1G93A (fold-change = 9.8) motor neurons. Messenger RNA levels are reported as mean fold change ratio (±SE) between SOD1G93A (n = 4) and non-transgenic (n = 4) mice in 129Sv-SOD1G93A and C57-SOD1G93A motor neurons (dotted line defines the fold-change of 1.5). Q-values were generated from PPLR using the following formula: Q-val[i] = mean (1 − PPLR[1:i]); *Q-value ≤ 0.01; ns = not significant. (B) Immunohistochemical comparison performed at disease onset on lumbar spinal cord of C57-SOD1G93A, 129Sv-SOD1G93A and non-transgenic littermates showing: (i) the expression of ATF3 by motor neurons; (ii) lower basal levels of ATF3 in 129sv-Ntg compared with C57-Ntg mice; (iii) a strong increase of ATF3 in 129Sv-SOD1G93A versus their non-transgenic littermates; and (iv) no significant increase in ATF3 protein levels within C57-SOD1G93A versus non-transgenic littermates. Scale bar = 20 µm. (C) ATF3 slot-blot analysis on longitudinally dissected lumbar ventral spinal cord extracts from C57-SOD1G93A, 129Sv-SOD1G93A and non-transgenic littermates at disease onset. Immunoreactivity was normalized to the actual amount of protein loaded on the membrane as detected after Red Ponceau (Fluka). (D) Densitometric analysis of ATF3 levels confirm the immunohistochemical findings. Data are reported as mean ± SE of four mice per group. Two-way statistical analysis shows the effect of strain (129Sv; C57 − F = 8.95) and the genotype (non-transgenic; G93A − F = 7.75) on the overall variability. Tukey’s post hoc *P < 0.05; **P < 0.01.](https://oup.silverchair-cdn.com/oup/backfile/Content_public/Journal/brain/136/11/10.1093_brain_awt250/2/m_awt250f9p.jpeg?Expires=1716325030&Signature=m-AlT80R99AkcI7gdniCBh3-eb~IpV6~ZtwJ2kxM~EKWvUv7B~ZlNVebGm16etPHWnfWaPY2awNnQRIr~CKOSUcwvnIjxL50Wu~fpweKAdlxbB4foGeNHLg0NUzSs-5Gd-r6w96fbI6K8h67dDkEUdvgKQr3v-UE7fOFmrOwBITwkv8w0vFQSjoKw1JIUcMTI8DzPv9-A5WCyUBzmfvV~LtyIhY-fXeGmd2VzTbRvRwzSPYY4V7MmUi-m5kvqX0cc2N6Ajxiy1OzA~MLRJWBrewEiMPn4fC1Uk6B5K3b2W5n~Q8NO-65xGPw2Xk-HsdUiBMMrwSP~CXxJ~pK0wlyGw__&Key-Pair-Id=APKAIE5G5CRDK6RD3PGA)
Analysis of ATF3 expression at disease onset. (A) Atf3 messenger RNA levels are consistently higher in the 129Sv-SOD1G93A (fold-change = 29.8) versus C57-SOD1G93A (fold-change = 9.8) motor neurons. Messenger RNA levels are reported as mean fold change ratio (±SE) between SOD1G93A (n = 4) and non-transgenic (n = 4) mice in 129Sv-SOD1G93A and C57-SOD1G93A motor neurons (dotted line defines the fold-change of 1.5). Q-values were generated from PPLR using the following formula: Q-val[i] = mean (1 − PPLR[1:i]); *Q-value ≤ 0.01; ns = not significant. (B) Immunohistochemical comparison performed at disease onset on lumbar spinal cord of C57-SOD1G93A, 129Sv-SOD1G93A and non-transgenic littermates showing: (i) the expression of ATF3 by motor neurons; (ii) lower basal levels of ATF3 in 129sv-Ntg compared with C57-Ntg mice; (iii) a strong increase of ATF3 in 129Sv-SOD1G93A versus their non-transgenic littermates; and (iv) no significant increase in ATF3 protein levels within C57-SOD1G93A versus non-transgenic littermates. Scale bar = 20 µm. (C) ATF3 slot-blot analysis on longitudinally dissected lumbar ventral spinal cord extracts from C57-SOD1G93A, 129Sv-SOD1G93A and non-transgenic littermates at disease onset. Immunoreactivity was normalized to the actual amount of protein loaded on the membrane as detected after Red Ponceau (Fluka). (D) Densitometric analysis of ATF3 levels confirm the immunohistochemical findings. Data are reported as mean ± SE of four mice per group. Two-way statistical analysis shows the effect of strain (129Sv; C57 − F = 8.95) and the genotype (non-transgenic; G93A − F = 7.75) on the overall variability. Tukey’s post hoc *P < 0.05; **P < 0.01.
Interaction by protein function: over-connected transcription factors in C57-SOD1G93A and 129Sv-SOD1G93A motor neurons at disease onset
| IDs in active data seta | F.C.b | Q-valuec | Object named | Actuale | nf | Rg | nh | Expectedi | Ratioj | Z-scorek | P-valuel |
|---|---|---|---|---|---|---|---|---|---|---|---|
| C57-SOD1G93A | |||||||||||
| 1418747_at | 1.6 | 0.002782 | PU.1 | 95 | 1216 | 445 | 21012 | 25.8 | 3.7 | 14.2 | 2.644 × 10⁻²⁹ |
| 1450034_at | 1.6 | 0.000154 | STAT1 | 101 | 1216 | 621 | 21012 | 35.9 | 2.8 | 11.3 | 1.83 × 10⁻²¹ |
| 1418901_at | 1.5 | 0.000423 | C/EBPbeta | 103 | 1216 | 781 | 21012 | 45.2 | 2.3 | 9.0 | 2.665 × 10⁻¹⁵ |
| 1448452_at | 6.3 | 1.005 × 10⁻¹² | IRF8 | 35 | 1216 | 133 | 21012 | 7.7 | 4.5 | 10.2 | 1.873 × 10⁻¹⁴ |
| 1418982_at | 1.9 | 0.000100 | C/EBPalpha | 79 | 1216 | 545 | 21012 | 31.5 | 2.5 | 8.8 | 3.648 × 10⁻¹⁴ |
| 1459961_a_at | 2.0 | 0.002581 | STAT3 | 88 | 1216 | 660 | 21012 | 38.2 | 2.3 | 8.4 | 1.693 × 10⁻¹³ |
| 1417065_at | 2.1 | 0.000001 | EGR1 | 92 | 1216 | 737 | 21012 | 42.7 | 2.2 | 7.9 | 2.191 × 10⁻¹² |
| 1437247_at | 1.6 | 0.001732 | Fra-2 | 25 | 1216 | 85 | 21012 | 4.9 | 5.1 | 9.3 | 6.901 × 10⁻¹² |
| 1427418_a_at | 2.1 | 0.000390 | HIF1A | 73 | 1216 | 571 | 21012 | 33.0 | 2.2 | 7.3 | 1.507 × 10⁻¹⁰ |
| 1449363_at | 9.8 | 7.841 × 10⁻¹¹ | ATF-3 | 29 | 1216 | 143 | 21012 | 8.3 | 3.5 | 7.4 | 2.68 × 10−09 |
| 1423100_at | 2.0 | 0.000011 | c-Fos | 61 | 1216 | 511 | 21012 | 29.6 | 2.1 | 6.0 | 6.413 × 10−08 |
| 1426031_a_at | −1.6 | 0.010581 | NF-AT1(NFATC2) | 23 | 1216 | 138 | 21012 | 8.0 | 2.9 | 5.5 | 4.239 × 10−06 |
| 1418932_at | 1.6 | 0.001782 | E4BP4 (NFIL3) | 18 | 1216 | 101 | 21012 | 5.8 | 3.1 | 5.2 | 1.791 × 10−05 |
| 1423233_at | 6.3 | 1.222 × 10⁻¹⁴ | C/EBP | 42 | 1216 | 366 | 21012 | 21.2 | 2.0 | 4.7 | 1.863 × 10−05 |
| 1422864_at | 2.5 | 3.384 × 10−07 | AML1 (RUNX1) | 44 | 1216 | 399 | 21012 | 23.1 | 1.9 | 4.5 | 3.174 × 10−05 |
| 1417394_at | 1.6 | 0.001649 | KLF4 | 30 | 1216 | 241 | 21012 | 13.9 | 2.2 | 4.5 | 6.449 × 10−05 |
| 1422864_at | 2.5 | 3.384 × 10−07 | AML1/ETO | 15 | 1216 | 84 | 21012 | 4.9 | 3.1 | 4.7 | 8.565 × 10−05 |
| 1417487_at | 2.0 | 0.000782 | Fra-1 | 14 | 1216 | 80 | 21012 | 4.6 | 3.0 | 4.5 | 0.0001825 |
| 1417516_at | 2.2 | 4.95 × 10−09 | C/EBP zeta | 22 | 1216 | 169 | 21012 | 9.8 | 2.2 | 4.0 | 0.0003104 |
| 1451538_at | 1.7 | 0.000033 | SOX9 | 24 | 1216 | 219 | 21012 | 12.7 | 1.9 | 3.3 | 0.002025 |
| 1427682_a_at | 4.2 | 8.724 × 10⁻¹³ | EGR2 (Krox20) | 16 | 1216 | 130 | 21012 | 7.5 | 2.1 | 3.2 | 0.003458 |
| 1447448_s_at | 1.5 | 0.001126 | KLF6 | 12 | 1216 | 85 | 21012 | 4.9 | 2.4 | 3.3 | 0.0035085 |
| 1421322_a_at | 1.7 | 0.000283 | IRF9 | 9 | 1216 | 55 | 21012 | 3.2 | 2.8 | 3.4 | 0.0040431 |
| 1416543_at | 2.4 | 4.97 × 10⁻¹¹ | NRF2 | 25 | 1216 | 208 | 20265 | 15.0 | 1.7 | 2.7 | 0.0079708 |
| 1447849_s_at | −1.7 | 0.001631 | c-Maf | 11 | 1216 | 84 | 21012 | 4.9 | 2.3 | 2.9 | 0.0089414 |
| 1448797_at | 1.9 | 0.000010 | Elk-3 | 5 | 1216 | 23 | 21012 | 1.3 | 3.8 | 3.3 | 0.0090374 |
| 1447655_x_at | 1.5 | 0.000477 | SOX6 | 9 | 1216 | 63 | 21012 | 3.6 | 2.5 | 2.9 | 0.0099765 |
| 129Sv-SOD1G93A | |||||||||||
| 1418747_at | 1.5 | 0.014261 | PU.1 | 79 | 1759 | 445 | 21012 | 37.3 | 2.1 | 7.2 | 1.158 × 10⁻¹⁰ |
| 1417065_at | 1.6 | 0.001171 | EGR1 | 97 | 1759 | 737 | 21012 | 61.7 | 1.6 | 4.8 | 5.104 × 10−06 |
| 1455267_at | −1.6 | 0.000072 | ERR3 | 26 | 1759 | 121 | 21012 | 10.1 | 2.6 | 5.2 | 6.388 × 10−06 |
| 1426031_a_at | −1.8 | 0.011070 | NF-AT1(NFATC2) | 25 | 1759 | 138 | 21012 | 11.6 | 2.2 | 4.1 | 0.0001856 |
| 1448452_at | 6.9 | 1.454 × 10⁻¹⁵ | IRF8 | 24 | 1759 | 133 | 21012 | 11.1 | 2.2 | 4.0 | 0.0002628 |
| 1418982_at | 1.6 | 0.003880 | C/EBPalpha | 66 | 1759 | 545 | 21012 | 45.6 | 1.4 | 3.2 | 0.0015174 |
| 1423100_at | 1.6 | 0.003595 | c-Fos | 62 | 1759 | 511 | 21012 | 42.8 | 1.4 | 3.1 | 0.0019796 |
| 1459961_a_at | 2.0 | 0.001566 | STAT3 | 76 | 1759 | 660 | 21012 | 55.3 | 1.4 | 3.0 | 0.0027669 |
| 1449363_at | 29.8 | 1.00 × 10⁻²⁴ | ATF-3 | 13 | 682 | 114 | 20265 | 3.8 | 3.4 | 4.8 | 0.0001211 |
aA network object ID corresponding to the given gene.
bFold-change: expressed as mean fold-change ratio between four SOD1G93A and four non-transgenic mice.
cMultiple hypothesis testing: Q-value[i] = mean (1-PPLR[1:i]) where PPLR is the probability of positive log ratio.
dNetwork object name in MetaBase™.
eNumber of targets in the activated data set(s) regulated by the chosen transcription factor.
fNumber of network objects in the activated data set(s).
gNumber of targets in the complete database or background list regulated by the chosen transcription factor.
hTotal number of gene-based objects in the complete database or background list.
iMean value for hypergeometric distribution (n × R/N).
jConnectivity ratio (actual/expected).
kZ-score [(actual − expected)/sqrt(variance)].
lProbability to have the given value of actual or higher (or lower for negative Z-score).
NRF2 is a transcription factor that interacts with the antioxidant response element enhancer sequence, to promote expression of proteins involved in the response to oxidative stress (Barber and Shaw, 2010). The expression of Nrf2 messenger RNA increased in the motor neurons of C57-SOD1G93A from disease onset (Fig. 10A), whereas in 129Sv-SOD1G93A motor neurons we observed an increase in Nrf2 levels only at the end stage of the disease (data not shown). In contrast with the messenger RNA levels, immunohistochemical analysis performed on lumbar spinal cord of both transgenic mice and relevant non-transgenic littermates at the onset of the disease identified no upregulation of NRF2 protein in C57-SOD1G93A, whereas a reduction occurred in 129Sv-SOD1G93A motor neurons (Fig. 10B). Immunoblot analysis of longitudinal dissected ventral horns further validate the immunohistochemical observations at the onset of the disease showing reduced NRF2 expression in 129Sv-SOD1G93A motor neurons (Fig. 10C and D).
![Analysis of NRF2 expression at disease onset. (A) Nrf2 messenger RNA expression levels specifically increase in C57-SOD1G93A motor neurons (fold change = 2.4). Messenger RNA levels are reported as mean fold-change ratio (±SE) between SOD1G93A (n = 4) and non-transgenic (n = 4) mice in 129Sv-SOD1G93A and C57-SOD1G93A motor neurons (dotted line defines the fold-change of 1.5). Q-values were generated from PPLR using the following formula: Q-val[i] = mean (1 − PPLR[1:i]); *Q-value ≤ 0.01; ns = not significant. (B) Immunohistochemical comparison performed at disease onset on lumbar spinal cord of C57-SOD1G93A, 129Sv-SOD1G93A and non-transgenic littermates showing: (i) the expression of NRF2 by motor neurons; and (ii) lower levels of NRF2 in 129Sv-SOD1G93A motor neurons. Scale bar = 50 µm. (C) NRF2 western blot analysis on longitudinally dissected lumbar ventral spinal cord protein extracts from C57-SOD1G93A 129Sv-SOD1G93A and non-transgenic littermates at the onset of the disease. Immunoreactivity was normalized to the actual amount of proteins loaded on the membrane as detected after Red Ponceau (Fluka). (D) Densitometric analysis of NRF2 levels validates the immunohistochemical findings. Data are reported as mean ± SE of four mice per group. Two-way statistical analysis shows significant interaction (F int. = 6.69) due to strain (129Sv; C57 − F = 23.56) and genotype (non-transgenic; G93A − F = 27.45). Tukey’s post hoc ***P < 0.001; ****P < 0.0001.](https://oup.silverchair-cdn.com/oup/backfile/Content_public/Journal/brain/136/11/10.1093_brain_awt250/2/m_awt250f10p.jpeg?Expires=1716325030&Signature=jCbunu~JH0501RxrYttYtSPl-ACQGAQ9Jdnczs69v9kG9MhTq8jv1o-6YZdZtRymoLhHJ6Tac41jzZoGjxk81w1MqjIhHeVYMG1rAe88DcNwzvvRkyav9xZanBEPWUehpprMaDZZKRL4HZFTGTYj0nGvh~D~sDMHALhoM72F-wiRc9HB2Wm5ba9GQBo3F2toGORbAsFz93QpDbFem9RJxKEOOewSWt6T0gwpMnKRt2RP6BqbwSyn~4zgKgXUs-H6rejJHd68F~i75jznPmwpgXByZGdYj~VGk3gb1332XEjJ1-wzVU2qqNFzBqQVvcSUyuNRdTtKuRy37goS7292iw__&Key-Pair-Id=APKAIE5G5CRDK6RD3PGA)
Analysis of NRF2 expression at disease onset. (A) Nrf2 messenger RNA expression levels specifically increase in C57-SOD1G93A motor neurons (fold change = 2.4). Messenger RNA levels are reported as mean fold-change ratio (±SE) between SOD1G93A (n = 4) and non-transgenic (n = 4) mice in 129Sv-SOD1G93A and C57-SOD1G93A motor neurons (dotted line defines the fold-change of 1.5). Q-values were generated from PPLR using the following formula: Q-val[i] = mean (1 − PPLR[1:i]); *Q-value ≤ 0.01; ns = not significant. (B) Immunohistochemical comparison performed at disease onset on lumbar spinal cord of C57-SOD1G93A, 129Sv-SOD1G93A and non-transgenic littermates showing: (i) the expression of NRF2 by motor neurons; and (ii) lower levels of NRF2 in 129Sv-SOD1G93A motor neurons. Scale bar = 50 µm. (C) NRF2 western blot analysis on longitudinally dissected lumbar ventral spinal cord protein extracts from C57-SOD1G93A 129Sv-SOD1G93A and non-transgenic littermates at the onset of the disease. Immunoreactivity was normalized to the actual amount of proteins loaded on the membrane as detected after Red Ponceau (Fluka). (D) Densitometric analysis of NRF2 levels validates the immunohistochemical findings. Data are reported as mean ± SE of four mice per group. Two-way statistical analysis shows significant interaction (F int. = 6.69) due to strain (129Sv; C57 − F = 23.56) and genotype (non-transgenic; G93A − F = 27.45). Tukey’s post hoc ***P < 0.001; ****P < 0.0001.
Discussion
This study provides the first detailed longitudinal comparison of the gene expression profiles of laser captured motor neurons from two SOD1G93A mouse strains with different disease phenotypes. We demonstrate that a dramatic downregulation of gene expression characterizes motor neurons from the rapid progressor 129Sv-SOD1G93A mice compared with the slow progressor C57-SOD1G93A mice at the onset of the disease. The impairment predicted by gene expression changes of specific pathways involved in mitochondrial function, misfolded protein degradation, protein transport and neuron projections is particularly relevant in the 129Sv-SOD1G93A motor neurons. In contrast, C57-SOD1G93A motor neurons show activation of specific biological processes that may underpin a more consistent response to stress. In particular, GO pathway analysis of the transcriptional profile of C57-SOD1G93A motor neurons at disease onset revealed a strong upregulation of genes related to immune system processes, as well as neuroprotective signalling pathways controlled by ANG and NRF2.
Neuroprotective immune system signalling pathways
A careful analysis of differential expression of immune transcripts common to both transgenic mice reveals that C57-SOD1G93A motor neurons are more reactive to immune system stimuli than 129Sv-SOD1G93A motor neurons. Pro-inflammatory (tumour necrosis factor receptor superfamily member 1a and 1b; interleukin 6 receptor alpha) and anti-inflammatory (interleukin 2 receptor gamma chain, colony stimulating factor 2 receptor beta, transforming growth factor, beta receptor I and II and interleukin 10 receptor beta) cytokine receptors show higher messenger RNA levels in C57-SOD1G93A than in 129Sv-SOD1G93A motor neurons. Amongst these, Osmr is expressed at a much higher level in C57-SOD1G93A motor neurons. Oncostatin M is a pleiotropic cytokine of the interleukin 6 family, whose in vivo properties and physiological function remain controversial and poorly defined (Chen and Benveniste, 2004). However, recent data show that oncostatin M potently suppressed inflammation and tissue destruction in murine models of rheumatoid arthritis and multiple sclerosis (Wallace et al., 1999; Wahl and Wallace, 2001; Weiss et al., 2006). Microglia are considered to be the major producer of oncostatin M in the CNS, although it is also expressed in neurons and astrocytes (Chen et al., 2006). The higher levels of Osmr in C57-SOD1G93A compared with 129Sv-SOD1G93A mice may be related to the lower levels of Socs3 in the C57-SOD1G93A strain. SOCS3 is known to inhibit the activation of JAK-STAT pathway by interacting with the OSMR subunit, gp130, and therefore reducing its levels of expression (Baker et al., 2009). Our data suggest that oncostatin M expression may drive a neuroprotective effect in motor neurons by influencing the expression pattern of Serpina3n (neuroserpin) and Timp1 that are upregulated in C57-SOD1G93A compared with 129Sv-SOD1G93A motor neurons. TIMP1 has been described to be induced by oncostatin M in other cell systems and also to produce a neuroprotective effect by influencing the activity of matrix metalloproteases (Mmp-2 and Mmp-9) (Tong et al., 2004; Weiss et al., 2005; Chen et al., 2006). Neuroserpin, on the other hand, inhibits the activity of tissue-type plasminogen activator (t-PA), a serine protease that is a major modulator of the excitotoxic cascade (Yepes et al., 2000). In addition, the specific activation of Stat1 may be responsible for the higher Mcp-5 expression by C57-SOD1G93A motor neurons (Fulkerson et al., 2004; Kok et al., 2009). Mcp-5 is a mouse CC chemokine that is structurally and functionally homologous to of human MCP1 (Sarafi et al., 1997). MCP1 (now known as CCL2) enhances trafficking of monocytes and T cells in the CNS (Huang et al., 2001) and might represent the ‘unknown’ signal produced by injured motor neurons in order to attract T helper 2 and regulatory T cells into the spinal cord and maintain neuroprotective M2 microglia during the early stages of ALS (Appel et al., 2010). Increased levels of human MCP1 have been reported in the serum, CSF and spinal cord (motor neurons and glial cells) of patients with ALS (Henkel et al., 2004; Baron et al., 2005; Tanaka et al., 2006; Nagata et al., 2007). Previous studies reported increased messenger RNA levels of the putative murine homologue of human MCP1, JE, in the spinal cord and sciatic nerve homogenates from the mSOD1 mouse model of ALS (Henkel et al., 2006; Chiu et al., 2009). Unexpectedly, we did not find increased levels of JE messenger RNA in the ALS motor neurons analysed in the present study. These discrepant results may be related to the specificity of tissue analysed (motor neurons versus whole tissue homogenates). It is noteworthy, however, that from sequence analysis Mcp-5 is structurally more similar to human MCP1 than JE. In fact, the mature human MCP1 protein is 66% identical to the mature murine MCP-5 protein but only 55% identical to murine JE (Sarafi et al., 1997).
In addition to Mcp-5, C57-SOD1G93A motor neurons also show higher expression of other molecules involved in T cell/monocyte recruitment [chemokine (C-X-C motif) ligand 10] and activation (Cd22, Cd86, Cd48, Cd84, Cd44) indicating that CNS immune cell infiltration and modulation may be higher in the spinal cord of slow progressing mice at disease onset and supporting the concept of a beneficial role of immune system activation on the early stages of disease progression (Chiu et al., 2008; Beers et al., 2008; Appel et al., 2010; Beers et al., 2011).
Motor neurons activate the complement system for their protection
We established that C57-SOD1G93A motor neurons stimulate widespread complement activation through upregulation of the C4b and C3 subunits. We were able to identify a higher level of expression of C3 and C3 activation products in C57-SOD1G93A compared with 129Sv-SOD1G93A motor neurons. Constitutive expression of proinflammatory complement components such as C3, C5, factor H and B was previously described in human neuronal cells in vitro and in cortical neurons and cerebellar Purkinje neurons in normal murine brains (Thomas et al., 2000; Yu et al., 2002). Other authors reported upregulation of C1q messenger RNA and protein in motor neurons from transgenic ALS mice (Lobsiger et al., 2007). Most importantly, C3 protein accumulation and C3 activation product deposition was observed in motor neuron somata, sciatic nerve and neuromuscular junction from SOD1G93A mouse model at the symptomatic stage of disease (Heurich et al., 2011). The complement cascade is classically considered as a detrimental proinflammatory process, so that the general conclusions of these previous reports portray complement activation as an important contributor to motor neuron injury.
Conversely, our data suggest a neuroprotective role of the complement pathway in motor neurons as it is strongly activated at disease onset in C57-SOD1G93A motor neurons and therefore is associated with a more benign disease course. Our hypothesis is in accord with the recent suggestion that activation of complement plays an important role in neuronal survival and even in normal neuronal development (Yanamadala and Friedlander, 2010). In vitro, C1q improves neuronal viability and neurite outgrowth through the induction of NGF and NT-3 (Benoit and Tenner, 2011), whereas complement C3 deficiency leads to accelerated amyloid-β plaque deposition and neurodegeneration in amyloid precursor protein transgenic mice (Maier et al., 2008). In addition, the activity of C3a was reported to be neuroprotective against N-methyl-d-aspartic acid excitotoxicity (van Beek et al., 2001) and essential for neuronal development (Shinjyo et al., 2009). Notably, both transgenic motor neurons overexpress the complement component 3a receptor 1 (C3ar1) whereas only C57-SOD1G93A motor neurons upregulate the complement component receptor (C5ar1). The expression of C5AR1 in primary neurons and cultured neuroblastoma cells was reported to be neuroprotective against damage produced by excitotoxins and amyloid-β peptide toxicity (O’Barr et al., 2001). Consistent with this, exogenous C5a administration protects neurons against glutamate mediated neurotoxicity in vitro and in vivo (Tocco et al., 1997; Osaka et al., 1999; Mukherjee et al., 2001, 2008). Recently our understanding of the complement system has markedly evolved beyond its early recognition as a protein system merely detecting and tagging a pathogen for further clearance. It is now firmly established that complement detects a growing repertoire of distinct self and non-self danger signals and is instrumental in the initiation and further fine-tuning of adaptive immunity (Heeger and Kemper, 2012). It is likely that the constitutive synthesis of complement proteins by motor neurons reflects a requirement for a ‘primed’ system in order to instantly deal with pathophysiological processes in the spinal cord and according to our data C57-SOD1G93A motor neurons but not 129Sv-SOD1G93A motor neurons, are able to amplify and finely regulate this system during the early development of ALS pathology.
Increased major histocompatibility complex I expression by motor neurons: a potential role in neuroprotection of the axonal compartment
A large number of proteins that were first discovered in the immune system, have been now detected in the healthy, uninfected nervous system, raising the possibility that these proteins have pleiotropic functions in the CNS (Boulanger et al., 2001). Examples of immune molecules expressed by motor neurons include the MHCI complex. Rat spinal motor neurons constitutively express messenger RNAs for MhcI and β2m (Lindå et al., 1998) albeit at much lower levels that those found in tissues such as spleen and vascular endothelial cells. However, if motor neurons are exposed to injurious stimuli, such as axotomy, ventral-horn root avulsion, viral or parasitic infection or exposure to cytokines (Boulanger and Shatz, 2004), MHCI expression markedly increases. In the present study, we observed an increase of MhcI transcripts in the motor neurons of C57-SOD1G93A at the onset of the disease, suggesting a potential neuroprotective role of this phenomenon. It is noteworthy that the increase of MhcI transcripts in motor neurons was associated with an increase in MHCI immunoreactivity in the motor axons and neuromuscular junction rather than in the perikarya, suggesting that this protein is rapidly transported away from the cell body. This finding is not surprising as other reports highlight the absence of MHCI-immunoreactivity in motor neuron somata after axotomy or in the experimental allergic encephalomyelitis (EAE) mouse model despite an upregulation of MhcI messenger RNA expression in the motor neuron cell bodies (Thams et al., 2009; Freria et al., 2010). Similar to our results, MHCI immunoreactivity was instead highly upregulated in the axonal compartment in the C57-SOD1G93A mouse model after axotomy (Thams et al., 2009). Recent studies highlight the importance of MHCI overexpression in axonal regeneration and the stability of the neuromuscular junctions of motor neurons after axonal damage (Oliveira et al., 2004; Thams et al., 2009). Therefore, the higher level of MHCI in C57-SOD1G93A motor axons suggests a beneficial role of MHCI in preserving axonal integrity during the early phase of disease development in ALS.
Anterograde axonal transport of MHCI has been previously described in other neurons including the vomeronasal system in vivo and cortical and hippocampal neurons in vitro (Medana et al., 2001; Ishii and Mombaerts, 2008; Taylor et al., 2009). Interestingly, these and other studies suggested an important role for MHCI in the refinement of synapse formation and plasticity in the visual system and the hippocampus (Corriveau et al., 1998; Huh et al., 2000; Boulanger and Shatz, 2004; Shatz, 2009). Thus, the remarkable overexpression of MHCI in the motor axons and neuromuscular junction at disease onset in C57 SOD1G93A mice might explain the slowing of disease progression observed in this mouse strain compared to the 129Sv-SOD1G93A strain. There is growing evidence indicating that distal axonopathy and retraction of the motor axon terminal from the muscle end plate is an early change in the pathophysiology of ALS (Fischer et al., 2004; Dadon-Nachum et al., 2011). The rapid induction of MHCI expression in motor axons may be an early neuroprotective response to neuromuscular junction dysfunction. Further investigation is required to identify the specific molecular mechanisms responsible for upregulation of MHCI expression by motor neurons.
Understanding the specific role of MHCI in the CNS will elucidate new aspects of CNS/immune system cross-talk and may provide a new target for therapeutic intervention to preserve axonal integrity. To date, no data have been published relating to the role of MHCI in ALS despite the report that ALS shows genetic linkage to the MHC coding region (Antel et al., 1976; Kott et al., 1979; Tiwari and Terasaki, 1985).
In parallel with an increase of MHCI expression, the present analysis reports the specific upregulation of Lmp7 and Psm1 in C57-SOD1G93A motor neurons at disease onset time point. LMP7 and PSM1 are subcomponents of the immunoproteasome involved in antigen processing and presentation through the MHCI complex (Muchamuel et al., 2009; de Graaf et al., 2011). These results are in accordance with our previously published data showing altered levels of immunoproteasome subunits, including Lmp7, in C57-SOD1G93A motor neurons during the early stage of disease (Cheroni et al., 2009; Bendotti et al., 2012). Here, we demonstrate that alterations of the immunoproteasome are probably related to an attempt by motor neurons to protect themselves from degeneration rather than having a role in the pathogenesis of the disease.
Defective levels of neuroprotective factors exacerbates the speed of disease progression in 129Sv-SOD1G93A motor neurons
The systems biology analysis performed on data sets from both transgenic mice allows us to investigate specific key factors whose activity has been widely described as protective for motor neurons. In particular, the less severe ALS disease phenotype encountered in the transgenic C57 background is likely to be related to the specific ability of these mice to maintain the functional activity of certain key protein regulators. We observed that ANG is constitutively overexpressed in the C57 mouse strain compared with the 129Sv background. In addition, Ang messenger RNA upregulation in C57-SOD1G93A motor neurons from the onset of disease seems to act to maintain (or reinstate) normal levels of the ANG protein inside the cell. In contrast, 129Sv-SOD1G93A mice with the more aggressive disease course fail to upregulate Ang messenger RNA, with a concomitant dramatic reduction in ANG protein expression at disease onset. ANG was recently described to promote motor neuron survival in vitro and to have beneficial effects on the disease course in SOD1G93A mice (Kieran et al., 2008; Sebastià et al., 2009; Li and Hu, 2010). Angiogenic activity of ANG is classically related to its ability to regulate ribosomal RNA transcription after nuclear translocation (Li and Hu, 2010; Aparicio-Erriu and Prehn, 2012) and motor neurons actively produce and secrete ANG to induce RNA cleavage in astroglia (Aparicio-Erriu and Prehn, 2012; Skorupa et al., 2012). ANG mutations identified in patients with ALS (fALS9) are associated with a functional loss of ANG activity due to impairment of ribonucleolysis, nuclear translocation, or both (Kishikawa et al., 2008; Li and Hu, 2010; Aparicio-Erriu and Prehn, 2012). In addition, decreased ANG levels were observed in the spinal cord of SOD1G93A mice and ALS patients (Hu and Kishikawa, 2011) so that the downregulation of this protein in 129Sv-SOD1G93A motor neurons at the onset of the disease may be interpreted as having a detrimental influence on disease progression.
Interestingly, NRF2 exhibits a pattern of expression similar to that observed for ANG where messenger RNA upregulation within C57-SOD1G93A motor neurons underpins maintenance of normal levels of the NRF2 protein at the onset of the disease, whereas the lack of messenger RNA upregulation leads to reduced NRF2 protein expression in 129Sv-SOD1G93A motor neurons. The NF-E2-related factor 2/antioxidant response element (Nrf2/antioxidant response element) signalling programme is an endogenous cytoprotective system that is ubiquitously expressed (Barber and Shaw, 2010; Jung and Kwak, 2010). The activation of NRF2 promotes expression of an array of neuroprotective proteins including those involved in glutathione biosynthesis, and antioxidant defence and phase II drug metabolizing enzymes. This system has been shown to be effective at blocking neurotoxicity in vitro and in vivo. (Lee et al., 2003; Shih et al., 2003; Kraft et al., 2004, 2006; Mead et al., 2013). Dysregulation of NRF2 and the antioxidant response element has been reported in an NSC34 cellular model of SOD1-associated familial ALS (Kirby et al., 2005) as well as in the motor cortex and spinal cord of patients with ALS (Sarlette et al., 2008). Induction of NRF2 overexpression in the spinal cord (motor neurons and astrocytes) and distal muscle of SOD1 transgenic ALS mice model showed neuroprotective effects (Kraft et al., 2007; Vargas et al., 2008). Thus, impairment of the Nrf2/antioxidant response element signalling system appears to increase the vulnerability of motor neurons to stress-induced toxic insults.
Increased expression levels of ANG and NRF2 observed in C57-SOD1G93A motor neurons at disease onset appear to be key factors involved in slowing disease progression. In contrast, motor neurons from the rapid progressor 129Sv-SOD1G93A strain appear to lack an equivalent robust ANG and NRF2 motor neuronal stress response.
Impairment of key functions at disease onset in the motor neurons from 129Sv-SOD1G93A mice
According to our microarray data, the dysregulation of key neuroprotective factors within 129Sv-SOD1G93A motor neurons may be the consequence of a multisystem impairment involving different compartments and cellular processes. The increased state of stress of motor neurons from the 129Sv-SOD1G93A strain was confirmed by monitoring ATF3 levels during the progression of the disease. ATF3, which is strongly overexpressed in 129Sv-SOD1G93A mice versus 129Sv non-transgenic littermates at disease onset, is a member of the ATF/CREB family of transcription factors whose upregulation is directly proportional to motor neuron impairment and axonal injury (Tsujino et al., 2000; Vlug et al., 2005). The 129Sv-SOD1G93A motor neuron gene signature predicts that three vital biological processes are strikingly compromised at disease onset: energy metabolism; protein degradation and vesicle trafficking.
Mitochondria from the rapid progressor mouse strain show a widespread downregulation of messenger RNAs encoding Krebb’s cycle enzymes, the NADH dehydrogenase complex and ATP synthase. The gene expression data were validated by the demonstration of a dramatic decrease in the activity of the electronic transport chain complex I and ATP production in the ventral spinal cord of 129Sv-SOD1G93A mice. Although functional alterations of mitochondria related to an increase in oxidative stress and exitotoxicity have been widely reported in the context of ALS (Shi et al., 2010; Duffy et al., 2011; Cozzolino et al., 2012; Federico et al., 2012; Johri and Beal, 2012), the order of events leading to mitochondrial dysfunction is far from clear. Our data highlight the dysregulation of two mechanisms potentially involved in mitochondrial stability: the massive downregulation of the mitochondrial translational machinery and the upregulation of the uncoupling protein 2. Both of these mechanisms have been reported to be protective against oxidative stress, decreasing the redox pressure on the electronic transport chain (Crawford et al., 1997; Kristal et al., 1997; Dulloo et al., 2001; Serviddio et al., 2008). However, their induction in pathological conditions may result in a dramatic decrease in the efficiency of ATP production, as well as the induction of a form of cell death that morphologically resembles oncosis (Mills et al., 2002).
Proteasome alterations related to protein aggregation have been widely reported in transgenic ALS mouse models and are now considered as one of the main hallmarks of the disease (Bendotti et al., 2012). The present microarray analysis predicts a defect of the ubiquitin proteasome system in 129Sv-SOD1G93A motor neurons from disease onset. ATF3 protein overexpression in 129Sv motor neurons represents an index of a gradual intracellular accumulation of ubiquitinated material in motor neurons (Vlug et al., 2005). Interestingly, ATF3 has recently been reported as a novel repressor of NRF2 (Brown et al., 2008) so that higher levels of ATF3 may cause reduced expression of NRF2 that, in turn, may affect proteasome composition and stability (Kapeta et al., 2010; Pickering et al., 2010, 2012). In addition, through the analysis of expression levels of UCH37, we propose a novel mechanism that may be responsible for improper processing of unfolded proteins. The proteasome generally recognizes substrate through its multi-ubiquitin chain, followed by ATP-dependent unfolding and translocation of the substrate from the regulatory particle into the proteolytic core particle to be degraded. Substrate-bound ubiquitin groups are for the most part not delivered to the core particle and broken down together with substrate, but instead recovered as intact free ubiquitin and ubiquitin chains. UCH37, together with 26S proteasome regulatory subunit RPN11 and ubiquitin carboxyl-terminal hydrolase 14, is responsible for the deubiquitination of the substrate on the proteasome (Qiu et al., 2006; Yao et al., 2006). Reduced levels of UCH37 in 129Sv-SOD1G93A motor neurons may therefore be responsible, in addition to proteasome alterations, for the increased formation of cytosolic poly-ubiquitinated unfolded protein inclusions found in these mice as compared to the C57-SOD1G93A mice (in press).
A further noteworthy finding is that the dysregulation of the vesicle-associated membrane protein-associated protein B and C, chromatin modifying protein 2B, together with 21 other SNAREs and GTPase proteins, in 129Sv-SOD1G93A motor neurons. This depicts a complex scenario in which the malfunctioning of an intricate protein-network may affect motor neuron physiology. In recent years, an increasing number of mutations have been identified in genomic sequences of transgenic mice and ALS patients coding for different proteins involved in vesicle trafficking and protein targeting (Schmitt-John et al., 2005; Parkinson et al., 2006; Teuling et al., 2007; Cox et al., 2010). Among these, vesicle-associated membrane protein-associated protein B and C, is normally activated when misfolded proteins accumulate in the endoplasmic reticulum, and when mutated it promotes ubiquitinated aggregate formation and neuronal cell death. Similarly, mutation of proteins that regulate protein sorting to the endosome including chromatin modifying protein 2B and vacuolar protein sorting 24 are associated with motor neuron injury. Vesicle trafficking is an essential cellular function that regulates the homeostasis of subcellular compartments as well as the normal activity of physiological processes such as autophagy and neurotransmitter release (Jahn and Scheller, 2006; Chaineau et al., 2009; Longatti et al., 2009; Sann et al., 2009; Santos et al., 2009). In addition, recent findings have begun to provide a more detailed view of the molecular mechanisms underlying vesicle trafficking in neuronal cells. Trafficking through the Golgi is required for dendritic growth, whereas endosomal trafficking regulates neurite outgrowth and guidance (Sann et al., 2009). For example, disrupting the function of vesicle-associated membrane protein 7 prevents outgrowth of both axons and dendrites in mouse hippocampal neurons (Martinez-Arca et al., 2001) whereas loss of vacuolar protein sorting 35 causes signalling defects at the neuromuscular junction, including upregulation of TGF-β/BMP signalling and excessive formation of synaptic terminals (Korolchuk et al., 2007). Thus, downregulated expression of this cluster of genes in the 129Sv-SOD1G93A motor neurons at the onset of disease may predispose the mice to rapid disease progression.
The last two gene categories specifically downregulated at disease onset in 129Sv-SOD1G93A motor neurons are involved in microtubule stability and neuron projections. Interestingly, the gene cluster analysis reports downregulation of messenger RNAs encoding two non-catalytic subunits of dynein 1 complex, six kinesin heavy chain isoforms and one kinesin light chain isoform. Amongst these, Kif5a, Kif5b and Kif5c are expressed at high levels in normal adult motor neurons (Kanai et al. 2000) and are involved in neurofilament and mitochondrial axonal transport (Xia et al., 2003; Cho et al., 2007). The analysis of protein levels reveals that KIF5A, KIF5B and KIF5C are markedly reduced in 129Sv-SOD1G93A mice, at disease onset. These results predict that anterograde axonal transport is likely to be impaired in motor neurons from the rapidly progressing mice from the initial phase of the disease.
Impairment of axonal transport has been reported in multiple neurodegenerative diseases, including ALS (De Vos et al., 2008; Magrané and Manfredi, 2009; Bilsland et al., 2010; Millecamps and Julien, 2013). Deficits in bidirectional motor axonal transport have been documented in SOD1G93A mice even at the presymptomatic stage of the disease, suggesting that this phenomenon represents an early pathophysiological index of motor neuron impairment (Bilsland et al., 2010). It has been reported that axonal transport is in turn strongly influenced by mitochondrial activity and it has been proposed that loss of mitochondrial membrane potential is associated with an increase in retrograde transport (Miller and Sheetz, 2004). These findings have been confirmed in cultured motor neurons from SOD1G93A mice where mitochondrial transport is reduced in the anterograde direction, resulting in 50% depletion in the number of mitochondria in axons (De Vos et al., 2007). Thus, it is likely that the massive deficit in mitochondrial activity demonstrated in 129Sv-SOD1G93A motor neurons, coupled with impairment of axonal transport, might influence motor neuron homeostasis at disease onset underpinning a more rapid disease progression in these mice compared to the C57SOD1G93A mice.
Conclusion
Evidence from genetically engineered SOD1 transgenic mice suggests that the onset of the disease involves incompletely characterized processes in motor neurons, whereas disease progression after onset involves microglia, astrocytes and the blood–brain barrier (Boillee et al., 2006a, b; Maragakis and Rothstein, 2006; Lobsiger et al., 2007; Jaarsma et al., 2008; Yamanak et al., 2008; Zhong et al., 2008). Consistent with this notion, our longitudinal gene expression analysis of motor neurons provides evidence that specific alterations occurring in motor neurons at disease onset are fundamental in dictating the subsequent course of the disease. In particular, the capacity of motor neurons to activate immunological, angiogenic and anti-oxidative processes seems to promote neuroprotective effects that are associated with slower disease progression. In contrast, when these mechanisms are less robustly activated as in the 129Sv-SOD1G93A mice, a massive impairment of mitochondrial function and protein catabolic processes ensues associated with a more aggressive disease course. Given the complexity of the genes that are differentially expressed in the motor neurons of these two transgenic mouse models, it is difficult to extrapolate a single target for the development of effective therapies. However, this study has identified a set of key genes and pathways that are likely to account for the severity of the disease course in murine ALS and which may prove useful in unravelling the heterogeneity of the human disease. Currently, there is striking evidence that genetic modifiers identified in transgenic mice may represent important candidates underlying the disease phenotype in humans (Van Hoecke et al., 2012). Identification of genetically controlled indices of fast and slow disease progression in human ALS could lead to several translational benefits including elucidation of biomarkers for better disease stratification and therapeutic strategies to upregulate molecular factors determining slower disease progression.
Finally, our results add weight to the recent evidence suggesting a beneficial role of the inflammatory response on the progression of ALS (Beers et al., 2008, 2011; Chiu et al., 2008; Appel et al., 2010) as the mouse strain with the slower disease course shows more significant activation of immunological pathways at the time of disease onset. Major attention has been given to astrocytes, microglia, oligodendrocytes and most recently to the immune system as important players in the modulation of the disease course in ALS.
In this report, we highlight the propensity of motor neurons to activate immunological defence mechanisms as well as other protective mechanisms, in response to cell stress induced by the presence of mutant SOD1. The genetic background of the SOD1 mutant mouse has a large influence on the balance of these pathways and, as a consequence, on the rapidity of the disease course and lifespan of the animals. Detailed understanding of these pathways in human patients with ALS may provide new targets for therapies to ameliorate disease progression.
Funding
This work was supported by the Motor Neurone Disease Association (Grant number 124695-1), Regione Lombardia under Institutional Agreement no. 14501A and from the European Community’s Seventh Frame Work Programme (FP7 / 2007-2013) under grant agreement n° (259867 - Euromotor). P.J.S. is supported by NIHR as a Senior Investigator.
Supplementary material
Supplementary material is available at Brain online.
Abbreviations
- ALS
amyotrophic lateral sclerosis
- MHCI
major histocompatibility complex I
- Ntg
non-transgenic
- NRF2
nuclear factor (erythroid-derived 2)-like 2
- UCH37
ubiquitin C-terminal hydrolase 37
- PPLR
probability of positive log ratio
References
Author notes
*These authors contributed equally to this work.

